


 |
市场调查报告书
商品编码
1836704
中重型商用车市场:市场份额分析、行业趋势、统计数据和成长预测(2025-2030 年)Medium And Heavy Duty Commercial Vehicles - Market Share Analysis, Industry Trends & Statistics, Growth Forecasts (2025 - 2030) |
||||||
※ 本网页内容可能与最新版本有所差异。详细情况请与我们联繫。
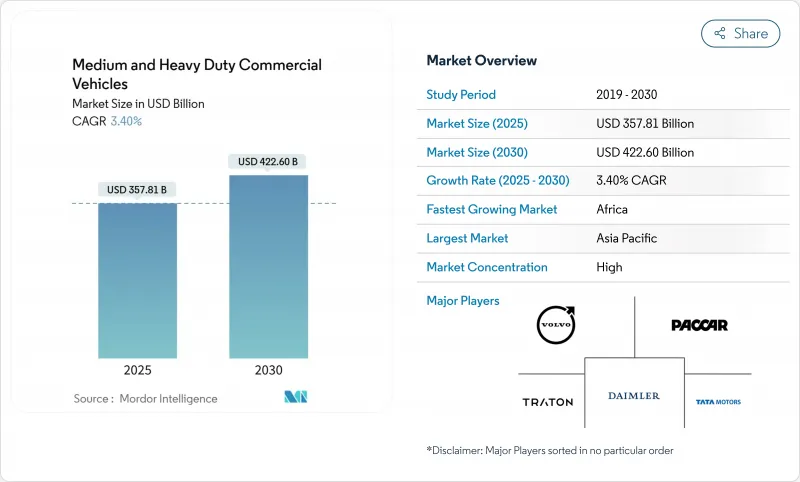
预计 2025 年中重型商用车市场规模将达到 3,578.1 亿美元,到 2030 年预计将达到 4,226 亿美元,预测期内(2025-2030 年)的复合年增长率为 3.40%。
这得归功于亚太、拉丁美洲和非洲地区的基础设施现代化,同时,欧洲符合欧VII标准的车辆数量和北美符合EPA 2027标准的车辆数量也在增加。监管趋同正在缩短更换週期,但内燃机汽车仍占据主导地位,而纯电动车的基数较小,销售量正在不断扩大。公共部门对道路和物流走廊的奖励策略、电子商务对轻型卡车的需求,以及能够改善总体拥有成本和安全分析的软体定义汽车平臺,都将进一步推动成长。
全球中重型商用车市场趋势与洞察
欧盟VII和EPA 2027排放气体标准推动汽车更新换代
严格的氮氧化物和二氧化碳法规正在加速欧洲旧欧VI之前柴油机组的更换,并迫使北美比计划更早更新其6-8级库存。最近采用的欧7标准实施了严格的限制,尤其是对重型车辆(HDV)。根据测试週期,它将氮氧化物(NOx)的限制降低了50%到62%。它还用更严格、更明确的非甲烷有机气体(NMOG)和甲烷(CH4)限制取代了总碳氢化合物(THC)的限制。调整时机会给供应商带来负担,但会为后处理和电池技术创造规模经济。加州的先进清洁卡车法规涵盖了美国25%的市场,要求在2030年实现50%的零排放销售。早期采用者受益于奖励池和残值溢价,而后来者则面临供不应求和合规成本上升的问题。拥有现有电气产品系列的製造商可以享受先发优势,并在两个地区摊提开发成本。
新兴国家基础设施奖励策略
印度、印尼、马来西亚和主要拉丁美洲国家政府支持的道路和能源项目持续推动中重型商用车市场的需求。印度的FAME框架设定的目标是到2030年将电动商用车的普及率提高到70%,该框架支持了电动卡车销量每年49%的增长,并鼓励供应商实现电池模组和动力传动系统的本地化。印尼和马来西亚类似的多年期道路建设和电气化措施正在推动区域规模化发展。同时,美洲开发银行估计,协调一致的奖励可望使拉丁美洲在全球电动卡车销售中的份额到2030年从0.45%提升至4%。这些措施提供了超越通常七年更换週期的采购可见性,使零件製造商能够确保产能并降低资本支出风险。经济奖励策略和在地采购规则的结合,为底盘、驾驶室和充电基础设施供应商提供了稳定的订单管道。
零排放卡车的初始成本高
电池组占单位成本的40%,这使得电动重型卡车比柴油卡车贵20-30%。随着磷酸铁锂化学成分的扩大,预计总成本将在四年内持平,但许多小型车队缺乏资金筹措能力。卡车即服务合约和电池租赁可以帮助製造商创造经常性收益,同时将购买成本降低高达42%。虽然大型车队已经采用了这些模式,但在新兴市场,由于信贷受限的买家仍然面临高昂的门槛利率,这些模式的普及速度缓慢。
报告中分析的其他驱动因素和限制因素
- 电子商务物流的扩张
- 利用基于远端资讯处理的使用情况保险降低整体拥有成本
- 电池供应链瓶颈
細項分析
2024年,16吨以上车型约占中重型商用车市场份额的60.26%,占中重型商用车市场最大份额。远距货运网路优先考虑负载容量而非充电便利性,这推动了需求成长。相比之下,由于城市配送平台的普及,3.5-7.5吨级的中重型商用车的复合年增长率达到7.81%,增速超过其他所有频宽。由于100-200千瓦时的电池组即可涵盖日常路线,该等级车型对电池的要求较低,从而降低了资本支出和充电复杂性。同时,7.5-16吨级的中型车辆正经历与建筑和市政采购週期相关的稳定更换趋势。
电池容量与车辆品质成正比,重型运输车辆需要500千瓦时或更高的电池容量才能满足预期的工作週期。这项要求增加了车辆重量和基础设施成本,与轻型车辆相比,电气化进程有所放缓。监管机构根据车辆总重来区分限制,迫使製造商在其工程蓝图中平衡后后处理和零排放设计。儘管成本存在差异,但一些矿业公司正在试用150吨级的电动自动卸货卡车,一旦充电网路到位,这可能会在生命週期内节省成本。
就2024年中重型商用车市占率而言,内燃机将以91.72%的销售量维持领先地位。然而,由于补贴、营业成本下降以及都市区的快速普及,纯电动卡车正处于快速成长轨道,到2030年的复合年增长率将达到9.83%。在电动续航里程和电网接入仍面临挑战的地区,压缩天然气和液化天然气等替代燃料将继续占据市场领先地位。对于必须在续航里程灵活性和零排放城市准入之间取得平衡的营运商来说,插电式混合动力汽车是一种过渡解决方案。
到2024年,中国将占全球电动重型卡车销量的80%以上,体现了合作奖励和区域供应链的影响力。燃料电池电动车原型车正在德国、韩国和美国进行早期试验,用于远距运输,因为电池品质会影响负载容量。因此,到2030年,推进系统组合可能会有所不同,具体取决于总拥有成本的计算、能源价格趋势和基础设施部署。
区域分析
受中国製造业深度和印度不断扩张的政策推动,亚太地区将在2024年占据全球销售额的45.52%。预计到2030年,随着目标商标产品製造商将电池工厂、软体中心和零件测试中心设在最大买家附近,该地区的领先地位将进一步扩大。光是中国就将在2024年支持超过9万辆电动重型卡车的註册,比亚迪和上汽将向匈牙利和印尼出口套件,以分散其关税风险。印度有14个邦的奖励计划,北方邦和马哈拉斯特拉邦可以建立有利于3.5吨电动卡车的市级低排放气体区。
北美和欧洲是成熟且利润丰厚的市场,协调一致的法规确保了技术的统一。欧盟的目标是到2030年将重型卡车的二氧化碳排放量减少45%,欧VII标准将于2029年生效。加州的先进清洁卡车法规正在影响国家采购计划,其他11个州也采用了该蓝图,涵盖了美国6-8级卡车需求的四分之一。加拿大的目标是到2030年实现35%的零排放卡车销量,并正在资助在横贯加拿大高速公路上建造充电走廊。在企业方面,沃尔沃和戴姆勒已成立合资企业,以建立通用的作业系统,而佩卡正在整合其内部电池组,以防止波动。
儘管初期投资规模不大,但非洲的投资动能强劲,复合年增长率高达9.10%。摩洛哥和埃及已订购与中型卡车共用的电动公车,使其成为该地区供应的核心。衣索比亚已超额完成2030年公车电气化目标,展现了密集型采购模式的潜力。南非的电动车白皮书提出了双平台蓝图,将现有柴油车辆的燃油效率提升与在采矿带周围建造快速充电站的奖励相结合。这些倡议预示着潜在的需求,如果电网可靠性提高,出货量可能会实现两位数成长。
其他福利:
- Excel 格式的市场预测 (ME) 表
- 3个月的分析师支持
目录
第一章 引言
- 研究假设和市场定义
- 调查范围
第二章调查方法
第三章执行摘要
第四章 市场状况
- 市场概况
- 市场驱动因素
- 因欧盟 VII 和 EPA 2027排放气体法规而更新车辆
- 新兴国家基础设施奖励策略
- 电子商务物流的扩张
- 采矿业大力推行电池电动运输卡车
- 基于远端资讯处理的使用保险可降低整体拥有成本
- 二次电池租赁模式
- 市场限制
- 零排放卡车的初始成本很高
- 电力电子和电池供应链瓶颈
- 车站级电网容量限制
- 混合动力电动车传动系统技术熟练的工程师短缺
- 价值/供应链分析
- 监管状况
- 技术展望
- 波特五力分析
- 新进入者的威胁
- 买方的议价能力
- 供应商的议价能力
- 替代品的威胁
- 竞争对手之间的竞争强度
第五章市场规模与成长预测:价值(美元)与数量(单位)
- 按吨位
- 3.5至7.5吨
- 7.5至16吨
- 超过16吨
- 依推进类型
- 内燃机(柴油、汽油)
- 电池电动
- 插电式混合动力
- 燃料电池电力
- 替代燃料(CNG、LNG、生质燃料、LPG)
- 按车辆类型
- 刚性卡车
- 联结车
- 自卸卡车/自动卸货卡车
- 专用卡车和商用卡车
- 按最终用户产业
- 物流/运输
- 建筑和采矿
- 农业/林业
- 公共工程和市政服务
- 按地区
- 北美洲
- 美国
- 加拿大
- 北美其他地区
- 南美洲
- 巴西
- 阿根廷
- 其他南美
- 欧洲
- 德国
- 英国
- 法国
- 西班牙
- 义大利
- 俄罗斯
- 其他欧洲国家
- 亚太地区
- 中国
- 印度
- 日本
- 韩国
- 澳洲
- 其他亚太地区
- 中东和非洲
- 阿拉伯聯合大公国
- 沙乌地阿拉伯
- 土耳其
- 南非
- 埃及
- 其他中东和非洲地区
- 北美洲
第六章 竞争态势
- 市场集中度
- 策略趋势
- 市占率分析
- 公司简介
- Daimler Truck AG
- Volvo Group
- Traton SE(MAN, Scania, Navistar)
- PACCAR Inc.
- Tata Motors Ltd.
- Hyundai Motor Co.
- CNHTC(Sinotruk)
- Dongfeng Motor Corp.
- FAW Group
- Renault Trucks
- Isuzu Motors Ltd.
- Hino Motors
- Ashok Leyland
- Iveco Group
- Kamaz PJSC
- Shacman(Shaanxi Auto)
- UD Trucks
- BYD Auto
- Nikola Corp.
第七章 市场机会与未来展望
The Medium and Heavy Duty Commercial Vehicles Market size is estimated at USD 357.81 billion in 2025, and is expected to reach USD 422.60 billion by 2030, at a CAGR of 3.40% during the forecast period (2025-2030).
This measured expansion comes as fleets align with Euro VII in Europe and EPA 2027 in North America while modernizing infrastructure across Asia-Pacific, Latin America, and Africa. Regulatory convergence has tightened replacement cycles, yet internal combustion engines dominate sales, and battery-electric models are scaling from a small base. Growth is further reinforced by public-sector stimulus for road and logistics corridors, e-commerce demand for lighter trucks, and software-defined vehicle platforms that improve total cost of ownership and safety analytics.
Global Medium And Heavy Duty Commercial Vehicles Market Trends and Insights
Fleet Renewal Driven by Euro VII & EPA 2027 Emission Rules
Stringent NOx and CO2 targets accelerate the replacement of pre-Euro VI and older diesel units in Europe and compel North American fleets to refresh Class 6-8 inventories sooner than planned. Recently adopted Euro 7 standards impose stricter limits, especially for heavy-duty vehicles (HDVs). These standards reduce nitrogen oxides (NOX) limits by 50% to 62%, depending on the test cycle. Additionally, they replace the total hydrocarbon (THC) limits with distinct, more stringent limits for non-methane organic gases (NMOG) and methane (CH4). Coordinated timing compresses procurement into narrow windows that strain suppliers but unlock economies of scale for after-treatment and battery technologies. California's Advanced Clean Trucks regulation, covering 25% of the US market, mandates 50% zero-emission sales by 2030. Operators that adopt early benefit from incentive pools and residual-value premiums, whereas late movers face supply shortages and higher compliance costs. Manufacturers with existing electric portfolios enjoy a first-mover edge and can amortize development expenses across both regions.
Infrastructure Stimulus in Emerging Economies
Government-backed road and energy programs continue to lift medium and heavy commercial vehicles market demand in India, Indonesia, Malaysia, and key Latin American countries. India's FAME framework targets 70% electric commercial vehicle penetration by 2030, supporting 49% annual growth in electric truck sales and encouraging suppliers to localize battery modules and drivetrains. Similar multi-year road-building and electrification measures in Indonesia and Malaysia foster a regional scale. At the same time, the Inter-American Development Bank estimates that coordinated incentives could raise Latin America's share of global electric truck sales from 0.45% to 4% by 2030. These initiatives extend purchasing visibility beyond the normal seven-year replacement horizon, enabling component makers to secure capacity and de-risk capital investment. The combination of stimulus funds and local content rules underpins a steady pipeline of orders for chassis, cabs, and charging infrastructure suppliers.
High Upfront Cost of Zero-Emission Trucks
Battery packs account for 40% of unit cost, leaving electric heavy trucks priced 20-30% above diesel equivalents. Total cost parity is projected within four years as lithium-iron-phosphate chemistries scale, yet many small carriers lack financing headroom. Truck-as-a-service contracts and battery leasing can cut acquisition costs by up to 42% while helping manufacturers generate recurring revenue. Large fleet operators are already adopting these models, but credit-constrained buyers in emerging economies still face high hurdle rates that slow take-up.
Other drivers and restraints analyzed in the detailed report include:
- E-Commerce Logistics Expansion
- Telematics-Enabled Usage-Based Insurance Lowers TCO
- Supply-Chain Bottlenecks for Batteries
For complete list of drivers and restraints, kindly check the Table Of Contents.
Segment Analysis
The above-16-ton models contributed around 60.26% of 2024 medium and heavy commercial vehicles market share, securing the largest slice of the medium and heavy commercial vehicles market. Demand is anchored by long-haul freight networks that prioritize payload capacity over convenience when charging. In contrast, the 3.5-7.5 ton class of medium and heavy commercial vehicles is expanding at 7.81% CAGR, outpacing all other bands as urban delivery platforms proliferate. This segment benefits from lower battery requirements as packs of 100-200 kWh suffice for daily routes, reducing capital outlays and charging complexity. Meanwhile, medium-duty units in the 7.5-16-ton range see stable replacement linked to construction and municipal procurement cycles.
Battery size scales steeply with vehicle mass, with heavy haulers needing 500 kWh or more to meet duty-cycle expectations. That requirement inflates curb weight and infrastructure costs, slowing electrification relative to lighter classes. Regulators differentiate limits by gross vehicle weight, compelling manufacturers to balance after-treatment and zero-emission designs across engineering roadmaps. Despite the cost gap, several mining companies are piloting 150-ton electric dumpers that yield life-cycle savings once charging networks are in place.
Internal combustion engines retained 91.72% revenue in 2024 of medium and heavy commercial vehicles market share, cementing their lead in the medium and heavy commercial vehicles market. Yet battery-electric trucks are on a steep 9.83% CAGR trajectory to 2030, helped by subsidies, lower operating costs, and rapid urban-fleet adoption. Alternative fuels such as compressed natural gas and liquefied natural gas continue to serve regional niches where electric range or grid access remains problematic. Plug-in hybrids act as transitional solutions for operators who must combine range flexibility with zero-emission urban entry.
China accounted for over 80% of global electric heavy-truck sales in 2024, illustrating the influence of coordinated incentives and local supply chains. Fuel-cell electric prototypes are under test for long-haul corridors where battery mass hurts payload, with early pilots in Germany, South Korea, and the US. The propulsion mix will therefore remain heterogeneous through 2030, driven by total cost of ownership calculations, energy-price trajectories, and infrastructure rollouts.
The Medium and Heavy Commercial Vehicle Market Report is Segmented by Tonnage (3. 5 To 7. 5 T, 7. 5 To 16 T, and Above 16 T), Propulsion Type (IC Engine, Plug-In Hybrid Electric, Battery Electric, and More), Vehicle Type (Rigid Truck and More), End-User Industry (Logistics and Transportation, Construction and Mining, and More), and Geography. The Market Forecasts are Provided in Terms of Value (USD) and Volume (Units).
Geography Analysis
Asia-Pacific's 45.52% 2024 revenue share stems from China's production depth and India's expanding policy push. The region is expected to extend its lead by 2030 because original-equipment manufacturers co-locate battery plants, software centers, and component testing near their largest buyers. China alone supported over 90,000 electric heavy-truck registrations in 2024, with BYD and SAIC exporting kits to Hungary and Indonesia to diversify tariff exposure. India backs 14 state incentive programs, allowing Uttar Pradesh and Maharashtra to create city-level low-emission zones that favor 3.5-ton battery trucks.
North America and Europe represent mature yet lucrative markets where coordinated rules ensure technological harmonization. The EU aims for a 45% CO2 cut in heavy trucks by 2030, and Euro VII will take effect in 2029. California's Advanced Clean Trucks rule influences national purchase plans because 11 other states have adopted its roadmap, covering one quarter of the US Class 6-8 demand. Canada targets 35% zero-emission truck sales by 2030 and funds charging corridors on the Trans-Canada Highway. On the corporate side, Volvo and Daimler established a joint venture to create a common operating system, while PACCAR integrates in-house battery packs to shield itself from volatility.
Africa is gaining investment momentum despite modest starting volumes and is rapidly growing with a robust CAGR of 9.10%. Morocco and Egypt order electric buses that share components with medium-duty trucks, creating a nucleus for regional supply. Ethiopia has already exceeded its 2030 bus electrification target, illustrating the potential of aggregated procurement models. South Africa's EV White Paper sets a dual platform roadmap that combines fuel efficiency upgrades for existing diesels with incentives for fast-charge depots around mining belts. These initiatives point to latent demand that could translate into double-digit shipment growth once grid reliability improves.
- Daimler Truck AG
- Volvo Group
- Traton SE (MAN, Scania, Navistar)
- PACCAR Inc.
- Tata Motors Ltd.
- Hyundai Motor Co.
- CNHTC (Sinotruk)
- Dongfeng Motor Corp.
- FAW Group
- Renault Trucks
- Isuzu Motors Ltd.
- Hino Motors
- Ashok Leyland
- Iveco Group
- Kamaz PJSC
- Shacman (Shaanxi Auto)
- UD Trucks
- BYD Auto
- Nikola Corp.
Additional Benefits:
- The market estimate (ME) sheet in Excel format
- 3 months of analyst support
TABLE OF CONTENTS
1 Introduction
- 1.1 Study Assumptions & Market Definition
- 1.2 Scope of the Study
2 Research Methodology
3 Executive Summary
4 Market Landscape
- 4.1 Market Overview
- 4.2 Market Drivers
- 4.2.1 Fleet renewal driven by Euro-VII & EPA 2027 emission rules
- 4.2.2 Infrastructure stimulus in emerging economies
- 4.2.3 E-commerce logistics expansion
- 4.2.4 Mining sector's push for battery-electric haul trucks
- 4.2.5 Telematics-enabled usage-based insurance lowers TCO
- 4.2.6 Secondary-use Battery Leasing Models
- 4.3 Market Restraints
- 4.3.1 High upfront cost of zero-emission trucks
- 4.3.2 Supply-chain bottlenecks for power-electronics & batteries
- 4.3.3 Depot-level grid-capacity limitations
- 4.3.4 Skilled-Technician Shortage for HV-EV Drivetrains
- 4.4 Value / Supply-Chain Analysis
- 4.5 Regulatory Landscape
- 4.6 Technological Outlook
- 4.7 Porter's Five Forces Analysis
- 4.7.1 Threat of New Entrants
- 4.7.2 Bargaining Power of Buyers
- 4.7.3 Bargaining Power of Suppliers
- 4.7.4 Threat of Substitutes
- 4.7.5 Intensity of Competitive Rivalry
5 Market Size & Growth Forecasts (Value (USD) and Volume (Units))
- 5.1 By Tonnage
- 5.1.1 3.5 to 7.5 t
- 5.1.2 7.5 to 16 t
- 5.1.3 Above 16 t
- 5.2 By Propulsion Type
- 5.2.1 Internal-Combustion Engine (Diesel & Gasoline)
- 5.2.2 Battery Electric
- 5.2.3 Plug-in Hybrid Electric
- 5.2.4 Fuel-cell Electric
- 5.2.5 Alternative Fuels (CNG, LNG, Bio-fuel, LPG)
- 5.3 By Vehicle Type
- 5.3.1 Rigid Truck
- 5.3.2 Tractor-Trailer
- 5.3.3 Tipper / Dump Truck
- 5.3.4 Specialized & Vocational Trucks
- 5.4 By End-user Industry
- 5.4.1 Logistics & Transportation
- 5.4.2 Construction & Mining
- 5.4.3 Agriculture & Forestry
- 5.4.4 Utilities & Municipal Services
- 5.5 By Geography
- 5.5.1 North America
- 5.5.1.1 United States
- 5.5.1.2 Canada
- 5.5.1.3 Rest of North America
- 5.5.2 South America
- 5.5.2.1 Brazil
- 5.5.2.2 Argentina
- 5.5.2.3 Rest of South America
- 5.5.3 Europe
- 5.5.3.1 Germany
- 5.5.3.2 United Kingdom
- 5.5.3.3 France
- 5.5.3.4 Spain
- 5.5.3.5 Italy
- 5.5.3.6 Russia
- 5.5.3.7 Rest of Europe
- 5.5.4 Asia-Pacific
- 5.5.4.1 China
- 5.5.4.2 India
- 5.5.4.3 Japan
- 5.5.4.4 South Korea
- 5.5.4.5 Australia
- 5.5.4.6 Rest of Asia-Pacific
- 5.5.5 Middle East and Africa
- 5.5.5.1 United Arab Emirates
- 5.5.5.2 Saudi Arabia
- 5.5.5.3 Turkey
- 5.5.5.4 South Africa
- 5.5.5.5 Egypt
- 5.5.5.6 Rest of Middle East and Africa
- 5.5.1 North America
6 Competitive Landscape
- 6.1 Market Concentration
- 6.2 Strategic Moves
- 6.3 Market Share Analysis
- 6.4 Company Profiles (Includes Global Level Overview, Market Level Overview, Core Segments, Financials as Available, Strategic Information, Market Rank/Share for Key Companies, Products and Services, SWOT Analysis, and Recent Developments)
- 6.4.1 Daimler Truck AG
- 6.4.2 Volvo Group
- 6.4.3 Traton SE (MAN, Scania, Navistar)
- 6.4.4 PACCAR Inc.
- 6.4.5 Tata Motors Ltd.
- 6.4.6 Hyundai Motor Co.
- 6.4.7 CNHTC (Sinotruk)
- 6.4.8 Dongfeng Motor Corp.
- 6.4.9 FAW Group
- 6.4.10 Renault Trucks
- 6.4.11 Isuzu Motors Ltd.
- 6.4.12 Hino Motors
- 6.4.13 Ashok Leyland
- 6.4.14 Iveco Group
- 6.4.15 Kamaz PJSC
- 6.4.16 Shacman (Shaanxi Auto)
- 6.4.17 UD Trucks
- 6.4.18 BYD Auto
- 6.4.19 Nikola Corp.
7 Market Opportunities & Future Outlook
- 7.1 White-space & Unmet-need Assessment
 8级卡车市场:按卡车类型、推进系统、变速箱、引擎功率和最终用途划分-2026-2032年全球预测
 全球7级卡车市场规模、份额、趋势和成长分析报告(2026-2034年)全球8级卡车市场规模、份额、趋势和成长分析报告(2026-2034年)
 中重型商用车排气系统市场-全球产业规模、份额、趋势、机会及预测(依燃料类型、后处理类型、零件类型、地区及竞争格局划分,2021-2031年)中重型商用车泵市场-全球产业规模、份额、趋势、机会和预测:按泵类型、技术类型、销售管道、地区和竞争格局划分,2021-2031年轻型商用车泵市场 - 全球产业规模、份额、趋势、机会及预测(按泵浦类型、技术类型、销售管道、地区和竞争格局划分,2021-2031年)
 8级卡车市场成长机会、成长要素、产业趋势分析及2026年至2035年预测7级卡车市场机会、成长要素、产业趋势分析及2026年至2035年预测日本轻型商用车与中重型卡车市场展望(2025 年)全球中重型商用车售后市场策略分析(2025)