


 |
市场调查报告书
商品编码
1913364
电动巴士市场机会、成长要素、产业趋势分析及预测(2026-2035年)Electric Bus Market Opportunity, Growth Drivers, Industry Trend Analysis, and Forecast 2026 - 2035 |
||||||
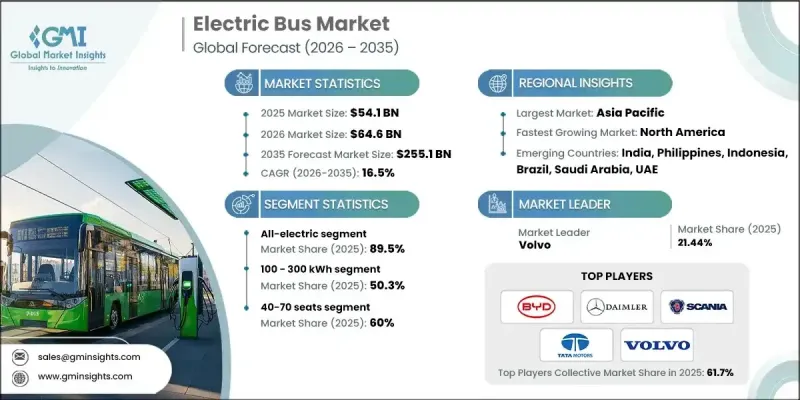
全球电动巴士市场预计到 2025 年价值 541 亿美元,到 2035 年将达到 2,551 亿美元,年复合成长率为 16.5%。
随着公共交通系统快速向电动出行转型,以支持更清洁的城市和更有效率的运营,市场也迅速发展。如今,电动公车配备了先进的电池系统、优化的电动动力系统、智慧能源管理和高效的热控制,从而降低了营运成本并提高了服务可靠性。交通管理部门正在引入这些车辆,以降低燃料和维护成本、减少排放气体、提高乘客舒适度,同时实现老旧车队的现代化。政策主导的脱碳、改善空气品质和永续城市发展倡议,正直接加速电动公车的普及。对充电基础设施、车辆数位化和营运分析的大量投资,使营运商能够最大限度地延长运作并优化路线规划。随着电气化减少对传统燃料的依赖,电动公车正日益被视为改善城际和市内交通网络环境绩效和经济稳定性的长期解决方案。
| 市场覆盖范围 | |
|---|---|
| 开始年份 | 2025 |
| 预测年份 | 2026-2035 |
| 起始值 | 541亿美元 |
| 预测金额 | 2551亿美元 |
| 复合年增长率 | 16.5% |
预计到2025年,纯电动车市占率将达到89.5%,并在2035年之前以16.2%的复合年增长率成长。该细分市场之所以占据领先地位,主要得益于其零排放营运、较低的机械复杂性以及强而有力的监管支持。与替代动力技术相比,纯电动公车拥有更低的生命週期拥有成本,同时符合排放目标,因此更受运输业者的青睐。
预计到2025年,100-300千瓦时电池容量范围将占据50.3%的市场份额,并在2026年至2035年间以16.6%的复合年增长率增长。此容量范围的电池因其在续航里程、充电效率和车辆重量方面的出色平衡而被广泛采用。此容量范围的公车能够满足日常线路营运需求,无需频繁充电中断,从而帮助营运商维持稳定的班次并控制营运成本。
预计2025年,中国电动公车市场规模将达到210.8亿美元,市占率将达65.5%。这一市场主导地位得益于强有力的政策支持、长期的车辆电气化规划以及传统公车被电动公车广泛替代。对公共交通现代化建设的持续投入,也使得电动公车在大都会圈和区域交通网络中维持了较高的普及率。
目录
第一章调查方法
第二章执行摘要
第三章业界考察
- 生态系分析
- 供应商情况
- 利润率分析
- 成本结构
- 每个阶段的附加价值
- 影响价值链的因素
- 中断
- 产业影响因素
- 司机
- 政府加大对零排放公共交通的强制性要求
- 公共资金和补贴大幅增加,用于发展电动巴士
- 人们日益关注都市区空气质量,并加强永续性目标。
- 与柴油巴士相比,消费者对总拥有成本较低的电动巴士的需求日益增长。
- 电池能量密度与动力传动系统效率的进步
- 产业潜在风险与挑战
- 电动公车和充电基础设施的前期成本很高
- 发展中地区充电基础设施及电网容量不足
- 市场机会
- 新兴经济体电动公车的普及率不断提高
- 扩大城际和长途公车路线的电气化规模
- 电池更换和能源即服务 (EaaS)经营模式的兴起
- 促进将电动公车融入智慧城市计划
- 司机
- 成长潜力分析
- 监管环境
- 北美洲
- 美国联邦电气化奖励和基础设施资金筹措
- 欧洲
- 德国:《电动车法案》(EmoG)
- 英国:零排放公车资金筹措计划
- 法国:流动性导向法(LOM 法)
- 义大利:国家能源与气候计画(PNIEC)
- 亚太地区
- 中国:新能源汽车(NEV)强制政策
- 印度:FAME II 电动公车补贴计划
- 日本:国家电动车/燃料电池车引进蓝图
- 澳洲:各州零排放公车目标
- 拉丁美洲
- 巴西:国家电动车政策(PNME)
- 墨西哥:零排放都市区公共交通计划
- 阿根廷:各州清洁交通法规
- 中东和非洲
- 阿联酋:电动车充电与清洁交通法规
- 沙乌地阿拉伯:2030愿景电动车交通框架
- 南非:绿色交通战略
- 北美洲
- 波特五力分析
- PESTEL 分析
- 科技与创新趋势
- 当前技术趋势
- 新兴技术
- 专利分析
- 定价分析
- 按地区
- 透过推进力
- 生产统计
- 生产基地
- 消费基础
- 出口和进口
- 成本細項分析
- 车辆成本
- 营运成本
- 总拥有成本 (TCO)
- 充电基础设施成本
- 安装和运作成本
- 研发费用
- 永续性和环境影响分析
- 永续实践
- 减少废弃物策略
- 生产中的能源效率
- 环保倡议
- 碳足迹考量
- 未来前景与机会
- 技术蓝图和演进时间表
- 新的申请机会
- 投资需求和资金筹措来源
- 风险评估与缓解
- 给市场参与企业的策略建议
第四章 竞争情势
- 介绍
- 公司市占率分析
- 主要市场公司的竞争分析
- 竞争定位矩阵
- 战略展望矩阵
- 重大进展
- 併购
- 伙伴关係与合作
- 新产品发布
- 企业扩张计画和资金筹措
第五章 依推进方式分類的市场估计与预测,2022-2035年
- 全电动
- PHEV
- 燃料电池汽车(FCEV)
第六章 依座位容量分類的市场估算与预测,2022-2035年
- 不到40个座位
- 40-70
- 70个或更多座位
第七章 按服务分類的市场估计与预测,2022-2035年
- 城际
- 城市
8. 按所有权类型分類的市场估算与预测,2022-2035 年
- 政府
- 本公司自有车辆
- 租赁和出租
- 叫车服务供应商
- 其他的
第九章 依充电基础设施分類的市场估算与预测,2022-2035年
- 公共充电网络
- 私人的
- 杂交种
第十章 依电池容量分類的市场估计与预测,2022-2035年
- 小于100度
- 100至300千瓦时
- 超过300度
第十一章 2022-2035年各地区市场估计与预测
- 北美洲
- 美国
- 加拿大
- 欧洲
- 德国
- 英国
- 法国
- 义大利
- 西班牙
- 俄罗斯
- 北欧国家
- 亚太地区
- 中国
- 印度
- 日本
- 澳洲
- 韩国
- 菲律宾
- 印尼
- 拉丁美洲
- 巴西
- 墨西哥
- 阿根廷
- 中东和非洲
- 南非
- 沙乌地阿拉伯
- 阿拉伯聯合大公国
第十二章:公司简介
- 世界公司
- BYD
- Daimler
- Geely Automobile Holdings
- IVECO
- MAN Bus
- NFI
- Scania
- Tata Motors
- Volvo
- Zhengzhou Yutong Bus
- 本地製造商
- Beiqi Foton Motor
- Ebusco
- Irizar
- King Long United Automotive
- Solaris Bus &Coach
- VDL Bus &Coach
- Xiamen Golden Dragon Bus
- 新兴製造商
- Anhui Ankai Automobile.
- Proterra
- Zhongtong Bus
The Global Electric Bus Market was valued at USD 54.1 billion in 2025 and is estimated to grow at a CAGR of 16.5% to reach USD 255.1 billion by 2035.
The market is evolving rapidly as public transportation systems increasingly shift toward electrified mobility to support cleaner cities and more efficient transit operations. Electric buses are now designed with advanced battery systems, optimized electric drivetrains, intelligent energy management, and efficient thermal controls that enable lower operating expenses and improved service reliability. Transit authorities are adopting these vehicles to cut fuel and maintenance costs, lower emissions, and enhance rider comfort while modernizing aging fleets. Policy-driven commitments to decarbonization, air quality improvement, and sustainable urban development are directly accelerating electric bus adoption. Large-scale investments in charging infrastructure, fleet digitization, and operational analytics are allowing operators to maximize uptime and improve route planning. As electrification reduces dependence on conventional fuels, electric buses are increasingly viewed as a long-term solution that improves both environmental performance and economic stability across urban and intercity transport networks.
| Market Scope | |
|---|---|
| Start Year | 2025 |
| Forecast Year | 2026-2035 |
| Start Value | $54.1 Billion |
| Forecast Value | $255.1 Billion |
| CAGR | 16.5% |
The all-electric category represented 89.5% share in 2025 and is forecast to grow at a CAGR of 16.2% through 2035. This segment leads the market due to its zero-emission operation, reduced mechanical complexity, and strong regulatory backing. Transit operators favor fully electric buses as they align with emission reduction targets while offering lower lifetime ownership costs compared to alternative propulsion technologies.
The 100-300 kWh battery capacity range accounted for 50.3% share in 2025 and is expected to expand at a CAGR of 16.6% between 2026 and 2035. This battery class is widely adopted because it offers an effective balance between driving range, charging efficiency, and vehicle weight. Buses in this range support daily route requirements without excessive charging interruptions, helping operators maintain consistent schedules and control operational costs.
China Electric Bus Market held 65.5% share and generated USD 21.08 billion during 2025. Market leadership is supported by strong policy alignment, long-term fleet electrification programs, and widespread replacement of conventional buses with electric alternatives. Continuous investment in public transport modernization has sustained high deployment levels across metropolitan and regional networks.
Key companies operating in the Global Electric Bus Market include BYD, Solaris Bus & Coach, Tata Motors, Volvo, Zhongtong Bus, Proterra, Daimler, NFI Group, Scania, and MAN Bus. Companies in the Global Electric Bus Market are strengthening their competitive position through technology innovation, capacity expansion, and strategic partnerships. Manufacturers are investing heavily in battery efficiency improvements, modular vehicle platforms, and software-enabled fleet management solutions to enhance performance and reliability. Localization of manufacturing and supply chains is being used to reduce costs and meet regional procurement requirements. Firms are also offering comprehensive service packages that include maintenance support, charging solutions, and lifecycle management to build long-term customer relationships. Collaboration with transit authorities and infrastructure providers is enabling smoother deployment, while continuous product upgrades help address evolving regulatory and operational expectations across global markets.
Table of Contents
Chapter 1 Methodology
- 1.1 Research approach
- 1.2 Quality commitments
- 1.2.1 GMI AI policy & data integrity commitment
- 1.3 Research trail & confidence scoring
- 1.3.1 Research trail components
- 1.3.2 Scoring components
- 1.4 Data collection
- 1.4.1 Partial list of primary sources
- 1.5 Data mining sources
- 1.5.1 Paid sources
- 1.6 Base estimates and calculations
- 1.6.1 Base year calculation
- 1.7 Forecast model
- 1.8 Research transparency addendum
Chapter 2 Executive Summary
- 2.1 Industry 3600 synopsis, 2022 - 2035
- 2.2 Key market trends
- 2.2.1 Regional
- 2.2.2 Propulsion
- 2.2.3 Battery capacity
- 2.2.4 Seating capacity
- 2.2.5 Service
- 2.2.6 Fleet ownership
- 2.2.7 Charging infrastructure
- 2.3 TAM Analysis, 2026-2035
- 2.4 CXO perspectives: Strategic imperatives
- 2.4.1 Executive decision points
- 2.4.2 Critical success factors
- 2.5 Future outlook and strategic recommendations
Chapter 3 Industry Insights
- 3.1 Industry ecosystem analysis
- 3.1.1 Supplier landscape
- 3.1.2 Profit margin analysis
- 3.1.3 Cost structure
- 3.1.4 Value addition at each stage
- 3.1.5 Factor affecting the value chain
- 3.1.6 Disruptions
- 3.2 Industry impact forces
- 3.2.1 Growth drivers
- 3.2.1.1 Rise in government mandates for zero-emission public transportation
- 3.2.1.2 Surge in public funding and subsidies for electric bus procurement
- 3.2.1.3 Increase in urban air-quality concerns and sustainability targets
- 3.2.1.4 Growth in demand for lower total cost of ownership compared to diesel buses
- 3.2.1.5 Advancements in battery energy density and powertrain efficiency
- 3.2.2 Industry pitfalls and challenges
- 3.2.2.1 High upfront cost of electric buses and charging infrastructure
- 3.2.2.2 Limited charging infrastructure and grid capacity in developing regions
- 3.2.3 Market opportunities
- 3.2.3.1 Expansion of electric bus adoption in emerging economies
- 3.2.3.2 Growth in electrification of intercity and long-distance bus routes
- 3.2.3.3 Rise in battery swapping and energy-as-a-service business models
- 3.2.3.4 Increasing integration of electric buses into smart city initiatives
- 3.2.1 Growth drivers
- 3.3 Growth potential analysis
- 3.4 Regulatory landscape
- 3.4.1 North America
- 3.4.1.1 US Federal Electrification Incentives & Infrastructure Funding.
- 3.4.2 Europe
- 3.4.2.1 Germany: Electric Mobility Act (EmoG)
- 3.4.2.2 UK: Zero-Emission Bus Funding Programs
- 3.4.2.3 France: Mobility Orientation Law (LOM Act)
- 3.4.2.4 Italy: National Energy & Climate Plan (PNIEC)
- 3.4.3 Asia Pacific
- 3.4.3.1 China: New Energy Vehicle (NEV) Mandate
- 3.4.3.2 India: FAME II Electric Bus Incentives
- 3.4.3.3 Japan: National EV & FCV Deployment Roadmap
- 3.4.3.4 Australia: State-Level Zero-Emission Bus Targets
- 3.4.4 Latin America
- 3.4.4.1 Brazil: National Electric Mobility Policy (PNME)
- 3.4.4.2 Mexico: Urban Zero-Emission Public Transport Programs
- 3.4.4.3 Argentina: Provincial Clean Mobility Regulations
- 3.4.5 MEA
- 3.4.5.1 UAE: EV Charging & Clean Transport Regulations
- 3.4.5.2 Saudi Arabia: Vision 2030 EV Transport Framework
- 3.4.5.3 South Africa: Green Transport Strategy
- 3.4.1 North America
- 3.5 Porter's analysis
- 3.6 PESTEL analysis
- 3.7 Technology and Innovation landscape
- 3.7.1 Current technological trends
- 3.7.2 Emerging technologies
- 3.8 Patent analysis
- 3.9 Pricing Analysis
- 3.9.1 By region
- 3.9.2 By propulsion
- 3.10 Production statistics
- 3.10.1 Production hubs
- 3.10.2 Consumption hubs
- 3.10.3 Export and import
- 3.11 Cost breakdown analysis
- 3.11.1 Vehicle Cost
- 3.11.2 Operational Cost
- 3.11.3 Total cost of ownership (TCO)
- 3.11.4 Charging Infrastructure Cost
- 3.11.5 Installation & activation costs
- 3.11.6 Research & development costs
- 3.12 Sustainability and environmental impact analysis
- 3.12.1 Sustainable practices
- 3.12.2 Waste reduction strategies
- 3.12.3 Energy efficiency in production
- 3.12.4 Eco-friendly initiatives
- 3.12.5 Carbon footprint considerations
- 3.13 Future outlook & opportunities
- 3.13.1 Technology roadmap & evolution timeline
- 3.13.2 Emerging application opportunities
- 3.13.3 Investment requirements & funding sources
- 3.13.4 Risk assessment & mitigation strategies
- 3.13.5 Strategic recommendations for market participants
Chapter 4 Competitive Landscape, 2025
- 4.1 Introduction
- 4.2 Company market share analysis
- 4.2.1 North America
- 4.2.2 Europe
- 4.2.3 Asia Pacific
- 4.2.4 Latin America
- 4.2.5 MEA
- 4.3 Competitive analysis of major market players
- 4.4 Competitive positioning matrix
- 4.5 Strategic outlook matrix
- 4.6 Key developments
- 4.6.1 Mergers & acquisitions
- 4.6.2 Partnerships & collaborations
- 4.6.3 New Product Launches
- 4.6.4 Expansion Plans and funding
Chapter 5 Market Estimates & Forecast, By Propulsion, 2022 - 2035 ($Bn, Units)
- 5.1 Key trends
- 5.2 All-electric
- 5.3 PHEV
- 5.4 FCEV
Chapter 6 Market Estimates & Forecast, By Seating Capacity, 2022 - 2035 ($Bn, Units)
- 6.1 Key trends
- 6.2 Below 40
- 6.3 40-70
- 6.4 Above 70
Chapter 7 Market Estimates & Forecast, By Service, 2022 - 2035 ($Bn, Units)
- 7.1 Key trends
- 7.2 Intercity
- 7.3 Intracity
Chapter 8 Market Estimates & Forecast, By Fleet Ownership, 2022 - 2035 ($Bn, Units)
- 8.1 Key trends
- 8.2 Government
- 8.3 Private Fleet
- 8.4 Leasing & Rental
- 8.5 Ride-hailing Operator
- 8.6 Others
Chapter 9 Market Estimates & Forecast, By Charging Infrastructure, 2022 - 2035 ($Bn, Units)
- 9.1 Key trends
- 9.2 Public Charging Network
- 9.3 Private
- 9.4 Hybrid
Chapter 10 Market Estimates & Forecast, By Battery Capacity, 2022 - 2035 ($Bn, Units)
- 10.1 Key trends
- 10.2 Below 100 kWh
- 10.3 100-300 kWh
- 10.4 Above 300 kWh
Chapter 11 Market Estimates & Forecast, By Region, 2022 - 2035 ($Bn, Units)
- 11.1 Key trends
- 11.2 North America
- 11.2.1 US
- 11.2.2 Canada
- 11.3 Europe
- 11.3.1 Germany
- 11.3.2 UK
- 11.3.3 France
- 11.3.4 Italy
- 11.3.5 Spain
- 11.3.6 Russia
- 11.3.7 Nordics
- 11.4 Asia Pacific
- 11.4.1 China
- 11.4.2 India
- 11.4.3 Japan
- 11.4.4 Australia
- 11.4.5 South Korea
- 11.4.6 Philippines
- 11.4.7 Indonesia
- 11.5 Latin America
- 11.5.1 Brazil
- 11.5.2 Mexico
- 11.5.3 Argentina
- 11.6 MEA
- 11.6.1 South Africa
- 11.6.2 Saudi Arabia
- 11.6.3 UAE
Chapter 12 Company Profiles
- 12.1 Global Players
- 12.1.1 BYD
- 12.1.2 Daimler
- 12.1.3 Geely Automobile Holdings
- 12.1.4 IVECO
- 12.1.5 MAN Bus
- 12.1.6 NFI
- 12.1.7 Scania
- 12.1.8 Tata Motors
- 12.1.9 Volvo
- 12.1.10 Zhengzhou Yutong Bus
- 12.2 Regional Players
- 12.2.1 Beiqi Foton Motor
- 12.2.2 Ebusco
- 12.2.3 Irizar
- 12.2.4 King Long United Automotive
- 12.2.5 Solaris Bus & Coach
- 12.2.6 VDL Bus & Coach
- 12.2.7 Xiamen Golden Dragon Bus
- 12.3 Emerging Players
- 12.3.1 Anhui Ankai Automobile.
- 12.3.2 Proterra
- 12.3.3 Zhongtong Bus
 电池驱动电动巴士市场:机会、成长要素、产业趋势分析以及 2026 年至 2035 年的预测。
 欧洲电动巴士:市场占有率分析、产业趋势与统计、成长预测(2026-2031)
 全球电动巴士市场规模、份额、趋势和成长分析报告(2026-2034年)全球电池驱动电动巴士市场规模、份额、趋势和成长分析报告(2026-2034)燃料电池电动巴士全球市场规模、份额、趋势和成长分析报告(2026-2034)
 日本电动巴士市场规模、份额、趋势及预测(按动力方式、电池类型、车身长度、续航里程、电池容量和地区划分,2026-2034年)
 全球电动巴士市场:依电池类型、动力系统、应用、巴士尺寸、车身类型、充电方式、电池容量和地区划分 - 市场规模、市场动态、主要参与者、机会分析和预测(2026-2035年)
 全球电动铰接式城市公车市场:按推进技术、电池化学成分、充电方式、车辆长度和最终用户分類的预测(2026-2032年)按动力来源、传动方式、铰接长度、车门配置、应用和最终用户分類的铰接式城市公车市场,全球预测,2026-2032年按动力类型、车辆类型、服务类型、购买类型和最终用户分類的学前校车市场-全球预测(2026-2032 年)