


 |
市场调查报告书
商品编码
1518931
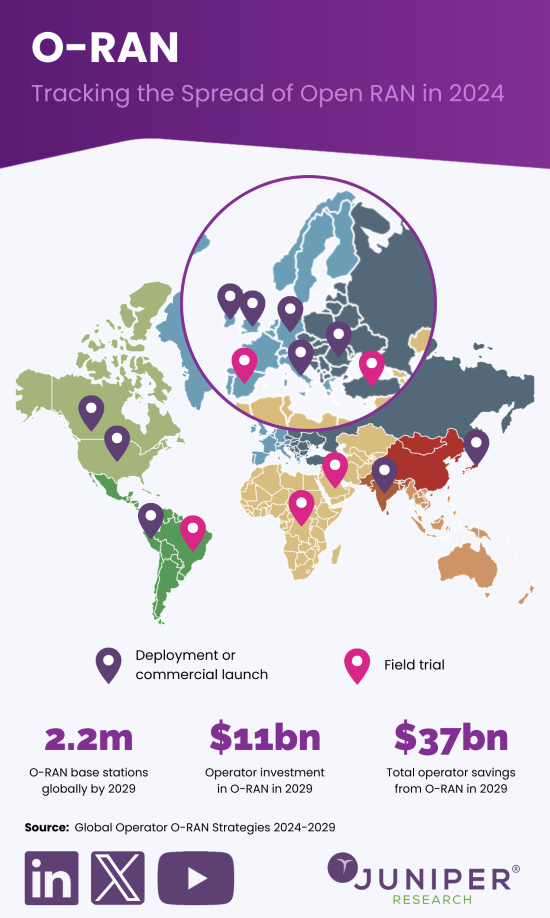
营运商 O-RAN 策略的全球市场:2024-2029Global Operator O-RAN Strategies: 2024-2029 |
||||||
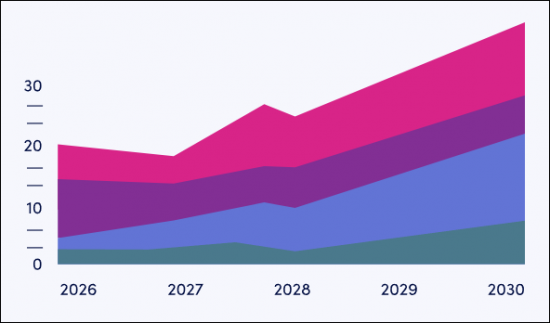
营运商对 Open RAN 的投资预计将在未来五年内激增,达到 390 亿美元。电信业者专注于最大限度地提高网路效率。
| 关键统计数据 | |
|---|---|
| 2024年营运商O-RAN投资: | 35亿美元 |
| 2029年运营商O-RAN投资: | 390亿美元 |
| 2029 年符合 O-RAN 标准的基地台百分比: | 19.1% |
| 预测期: | 2024-2029 |
该研究套件提供了对快速增长的竞争市场的见解和可行的见解,以帮助利益相关者(包括运营商和O-RAN 供应商)专注于运营商网络中O-RAN 硬体和软体的研发,并利用您的部署。
研究套件探讨了全球营运商的O-RAN 策略,并提供分析和建议,以帮助营运商最大限度地发挥O-RAN 对服务品质、网路效能和网路效率的影响,以及有关RIS(可重构)、MOCN (Multi Operator Core Network)、网路切片、流量引导、专用网路的分析和建议,包括用户设备、数据生成等的趋势和预测,以及对 13 个 O-RAN 市场领导者和技术提供者的广泛分析之竞争排行榜等。
主要特点
- 市场动态:涵盖 O-RAN 市场的主要趋势和业务见解,包括 RIS 整合、RAN 共享、流量引导、网路切片、单供应商 RAN 和多供应商 RAN。这些用例对于营运商最大限度地提高整体拥有成本并提高服务品质和网路技术效能至关重要。它还包括对 O-RAN 联盟发布的最新 O-RAN 标准的分析,包括新的 O-RAN 前传介面的引入以及营运商和供应商的试验。我们还推荐 xApp 和 rApp 开发和部署、多供应商 O-RAN 部署和整合以及绿地和棕地 O-RAN 部署的策略。
- 主要要点和策略建议:详细分析了主要市场份额的发展机会和调查结果,并为营运商和 O-RAN 供应商提供了策略建议。
- 基准产业预测:行动网路营运商和 O-RAN 供应商的市场规模预测和业务概述提供了对行动用户和蜂窝物联网设备总数、营运商总收入和蜂窝数据生成总量的预测。它还包括基地台总数、O-RAN基地台总数、营运商O-RAN总投资和商业部署,以及未来五年累积O-RAN投资预测。
- Juniper Research 的竞争排行榜:彙集了 13 家 O-RAN 供应商的能力和能力评级。它详细分析了 O-RAN 行业主要参与者的市场规模及其提供的服务。
样本视图
市场数据/预测报告:
市场趋势/策略报告:
市场数据及预测报告
该研究套件包括对 40 个表格和 24,000 多个数据点中的一整套预测数据的存取。调查包含以下指标:
- 用户设备总数:依行动订阅/蜂窝物联网设备划分
- 用户设备产生的蜂窝数据总量:按行动合约和蜂窝物联网设备
- 来自用户设备的营运商总收入:按行动合约和蜂窝物联网设备分类
- 基地台总数
- 符合 O-RAN 标准的基地台总数
- 业者每年对O-RAN的投资总额
- 营运商对O-RAN的累计投资
Juniper Research 互动式预测 Excel 具有以下功能:
- 统计分析:可以查询资料期间所有地区、国家的特定指标。可以轻鬆修改图表并将其汇出到剪贴簿。
- 国家资料工具:此工具可让您查看预测期内的所有区域和国家指标。您可以缩小搜寻列中显示的指标范围。
- 国家比较工具:您可以选择特定国家进行比较。该工具包括汇出图表的功能。
- 假设分析:透过五个互动式场景,主动将预测指标与您自己的假设进行比较。
目录
市场趋势/策略
第1章 重点与策略建议
- 很重要的一点
- 关键策略建议
第2章 市场状况
- O-RAN:简介
- O-RAN标准的製定
- O-RAN 测试和开发
- 推动 O-RAN 开发和部署的关键因素
第3章 未来战略与机遇
- O-RAN的关键组件
- O-RAN单元
- RIC
- SMO
- O-Cloud
- 营运商部署 O-RAN 的关键策略考量
- O-RAN 为营运商带来的机遇
第4章 国家储备指数
- 国家储备指数:简介
- 优先市场
- 不断成长的市场
- 新兴市场
竞争排行榜
第1章 竞争排行榜
第2章 供应商简介
- 供应商简介
- Airspan Networks
- Ericsson
- Fujitsu
- Juniper Networks
- Mavenir
- NEC
- Fujitsu
- Juniper Networks
- Mavenir
- NEC
- Fujitsu
- Juniper Networks
- Mavenir
- NEC
- Nokia
- Parallel Wireless
- Radisys
- Rakuten Symphony
- Samsung
- SynaXG
- VMware
- 评价方法
- 限制和解释
数据/预测
第1章 引言/研究方法
第2章 预测概述
- 消费者订阅总数
- 消费者订阅产生的蜂窝数据总量
- 营运商来自消费者订阅的总收入
- 蜂窝物联网设备总数
- 蜂窝物联网设备产生的蜂窝数据总量
- 来自蜂窝物联网设备的营运商总收入
- 基地台总数
- 符合 O-RAN 标准的基地台总数
- 营运商对O-RAN的总投资
- O-RAN 为营运商节省了总成本
'Open-RAN Investment by Operators to Surge in Next Five Years Reaching $39 Billion, as Operators Focus on Maximising Network Efficiency'
| KEY STATISTICS | |
|---|---|
| Operator O-RAN investment in 2024: | $3.5bn |
| Operator O-RAN investment in 2029: | $39bn |
| Proportion of total base stations that are O-RAN-compliant in 2029: | 19.1% |
| Forecast period: | 2024-2029 |
Overview
Juniper Research's "O-RAN (Open Radio Access Network)" research suite provides insights and actionable insights into this rapidly growing and competitive market; enabling stakeholders, such as operators and O-RAN vendors to navigate and capitalise on the development and deployment of O-RAN hardware and software in operator networks.
This is achieved through a detailed assessment of the solution flexibility factors driving O-RAN architectures development and deployment in the telecommunications industry, including the growing volume and technical challenges of volatility in cellular data generation, and increasing mobile user equipment and higher RAN capital and operating expenditure. The report also provides an analysis of the different O-RAN components, including the RIC (Radio Access Network Intelligent Controller) split into non-RT RIC (Real-time Radio Access Network Intelligent Controller) and near-RT-RIC, SMO (Service Management and Orchestration), O-Cloud, and radio units, distributed units, and centralised units. It also provides operators with strategies for xApp and rApp development and deployment, O-RAN security innovation, multi-vendor and integration, and brownfield deployments.
The market growth report also includes analysis and recommendations for how operators can maximise the impact of O-RAN on quality of service, network performance, and network efficiency. Analysis and recommendations are provided for RIS (Reconfigurable Intelligent Surface) integration, MOCN (Multi Operator Core Network), network slicing, traffic steering, and private networks.
The market forecast suite includes several different options that can be purchased separately, including access to data mapping and a forecast document; a strategy and trends document detailing critical trends in the market and strategic recommendations for deploying O-RAN and maximising its benefits, such as eliminating vendor lock-in and increased access to intelligence and automation, and a Competitor Leaderboard containing extensive analysis of 13 market leaders and technology providers in O-RAN.
The connectivity technology coverage can also be purchased as a Full Research Suite, which contains all these elements and offers a substantial discount.
Collectively, they provide a critical tool for understanding these rapidly emerging market segments, and for operators and O-RAN vendors shaping their future strategy for monetisation and network transformation. Its unparalleled coverage makes this research suite an incredibly useful resource for charting the future of a crucial and rapidly growing market.
Key Features
- Market Dynamics: Insights into key trends and opportunities within the O-RAN market; such as RIS integration, RAN sharing, traffic steering, network slicing, as well as single-0vednor and multi-vendor RAN. These use cases will be critical to operators maximising total cost of ownership saving and benefits to quality of service and network technologies performance. Included is analysis of the latest O-RAN standards released by the O-RAN Alliance such as the introduction of a new O-RAN fronthaul interface, and trials by operators and vendors. Also provided are recommendations for the development and deployment of xApps and rApps, the deployment and integration of multi-vendor O-RAN, and strategies for greenfield and brownfield O-RAN deployments.
- Key Takeaways & Strategic Recommendations: In-depth analysis of key development opportunities and findings within the O-RAN market shares, accompanied by strategic recommendations for operators and O-RAN vendors.
- Benchmark Industry Forecasts: The forecast market size business overview into mobile network operators and O-RAN vendors provides forecasts for the total number of mobile subscribers and cellular IoT devices, total operator revenue, and total cellular data generated. Also included are forecasts for the total number of base stations, total number of O-RAN base stations, total operator investment and commercial deployment in O-RAN, and cumulative investment in O-RAN over the next five years.
- Juniper Research Competitor Leaderboard: Key player capability and capacity assessment of 13 O-RAN vendors via the Juniper Research Competitor Leaderboard. This features market sizing for major players in the O-RAN industry and detailed analysis of their offerings.
Market Data & Forecasting Report
The research suite for the "O-RAN" market includes access to the full set of forecast data of 40 tables and over 24,000 datapoints. Metrics in the research suite include:
- Total User Equipment, Split by Mobile Subscriptions and Cellular IoT Devices
- Total Cellular Data Generated by User Equipment, Split by Mobile Subscriptions and Cellular IoT Devices
- Total Operator Revenue from User Equipment, Split by Mobile Subscriptions and Cellular IoT Devices
- Total Number of Base Stations
- Total Number of O-RAN Compliant Base Stations
- Total Operator Investment in O-RAN Per Year
- Cumulative Operator Investment in O-RAN
Juniper Research Interactive Forecast Excel contains the following functionality:
- Statistics Analysis: Users benefit from the ability to search for specific metrics, displayed for all regions and countries across the data period. Graphs are easily modified and can be exported to the clipboard.
- Country Data Tool: This tool lets users look at metrics for all regions and countries in the forecast period. Users can refine the metrics displayed via a search bar.
- Country Comparison Tool: Users can select and compare specific countries. The ability to export graphs is included in this tool.
- What-if Analysis: Here, users can compare forecast metrics using a proactive approach, against their own assumptions, via 5 interactive scenarios.
Market Trends & Strategies Report
This growth of demand report thoroughly examines the "O-RAN" market landscape; assessing market trends and factors shaping the evolution of this rapidly developing and growing market. The future market trends report delivers a comprehensive analysis of the strategic business opportunities for operators and O-RAN vendors.
The innovative ecosystem report addresses how stakeholders should maximise the impact of O-RAN through use cases such as RIS integration, MOCN, network slicing, traffic steering, and private networks. Analysis, market breakdown and strategic recommendations are provided for xApp and rApp development and deployment, network security innovation, such as zero trust architectures, brownfield O-RAN deployments, and multi-vendor operator deployments.
It also includes evaluation of specific operators' cloudification strategies and the wider O-RAN market in key countries. This includes analysis of the progress in O-RAN deployments and development, the development of O-RAN standards by the O-RAN Alliance, and country-level O-RAN trends.
Competitor Leaderboard Report
The Competitor Leaderboard report provides a detailed evaluation and market positioning for 13 O-RAN vendors. The key companies are positioned as established leaders, leading challengers, or disruptors and challengers based on capacity and capability assessment. This includes analysis of the key advantages in the market, O-RAN technology and ecosystem, and O-RAN partnerships and integration, with key vendors including:
|
|
This O-RAN solutions document is centred around the Juniper Research Competitor Leaderboard; a vendor positioning tool that provides an at-a-glance view of the competitive landscape in a market, backed by a robust methodology.
Table of Contents
Market Trends & Strategies
1. Key Takeaways & Strategic Recommendations
- 1.1. Key Takeaways
- 1.2. Key Strategic Recommendations
2. Market Landscape
- 2.1. O-RAN Introduction
- Figure 2.1: Map of O-RAN Commercial Deployments
- 2.2. O-RAN Standard Developments
- 2.3. O-RAN Trials and Developments
- 2.4 Key Factors Driving O-RAN Development and Deployment
- 2.4.1. 5G and 6G Networks Necessitate Expanded RAN Deployments
- Figure 2.2: Total Number of Base Stations, Split by Eight Key Regions, 2024-2029
- i. Base Station Site Availability Issues Promote RAN Sharing
- 2.4.2. Cellular Data Generation Growth Requires RAN Intelligence
- Figure 2.3: Total Cellular Data Consumed (PB), Split by Mobile Subscribers and Cellular IoT, 2024-2029
- i. Increasingly Volatility in Cellular Data Consumption
- 2.4.1. 5G and 6G Networks Necessitate Expanded RAN Deployments
3. Future Strategies & Opportunities
- 3.1 Key Components of O-RAN
- Figure 3.1: O-RAN Architecture
- 3.1.1. O-RAN Units
- 3.1.2. RIC
- Figure 3.2:RIC Use Cases
- Figure 3.3: RIC Architecture
- i. xApp and rApp Strategies
- 3.1.3. SMO
- 3.1.4. O-Cloud
- 3.2 Key Strategic Considerations for Operators Implementing O-RAN
- 3.2.1. Multi-Vendor Transitions and System Integration
- 3.2.2. Greenfield and Brownfield O-RAN Deployments
- 3.2.3. Security in O-RAN Deployments
- Figure 3.4: 2024 O-RAN Security Specifications Roadmap
- i. Zero-Trust Architectures in O-RAN
- 3.3. Operator Opportunities in O-RAN
- 3.3.1. Intelligent Electromagnetic Environments With RIS
- Figure 3.5: RIS In Operation
- 3.3.2. MOCN (Multi-Operator Core Networks) Strategies in O-RAN
- 3.3.3. MIMO
- 3.3.4. Network Slicing Optimisation
- 3.3.5. Traffic Steering
- 3.3.6. Private Networks
- Figure 3.6: Key Market Verticals for Private Networks
- 3.3.1. Intelligent Electromagnetic Environments With RIS
4. Country Readiness Index
- 4.1. Introduction to Country Readiness Index
- Figure 4.1: O-RAN Country Readiness Index Regional Definitions
- Table 4.2: Juniper Research Country Readiness Index Scoring Criteria: O-RAN
- Figure 4.3: Juniper Research Country Readiness Index: O-RAN
- Table 4.4: O-RAN Country Readiness Index: Market Segments
- 4.2. Focus Markets
- i. vRAN and Telecommunications Cloud Development Paves the Way for O-RAN Deployments
- ii. Huawei Ban Promotes O-RAN to Increase Competition
- 4.2.2. The US
- Figure 4.5: Total Operator Revenue from User Equipment in the US ($m), 2024-2029
- Figure 4.6: Cumulative Operator Investment in O-RAN in the US ($m), 2024-2029
- 4.3. Growth Markets
- i. China
- Figure 4.7:Total Operator Revenue From User Equipment in China ($m), 2024-2029
- Figure 4.8:Total Operator Investment in O-RAN in China ($m), 2024-2029
- i. China
- 4.4. Developing Markets
- Table 4.9: Juniper Research's Country Readiness Index Heatmap: North America
- Table 4.10: Juniper Research's Country Readiness Index Heatmap: Latin America
- Table 4.11: Juniper Research's Country Readiness Index Heatmap: West Europe
- Table 4.12: Juniper Research's Country Readiness Index Heatmap: Central & East Europe
- Table 4.13: Juniper Research's Country Readiness Index Heatmap: Far East & China
- Table 4.14: Juniper Research's Country Readiness Index Heatmap: Indian Subcontinent
- Table 4.15: Juniper Research's Country Readiness Index Heatmap: Rest of Asia Pacific
- Table 4.16: Juniper Research's Country Readiness Index Heatmap: Africa & Middle East
Competitor Leaderboard
1. Competitor Leaderboard
- 1.1. Why Read This Report
- Figure 1.1: Juniper Research Competitor Leaderboard Vendors and Product Portfolios
- Figure 1.2: Juniper Research Competitor Leaderboard: O-RAN Vendors
- Source: Juniper ResearchTable 1.3:Juniper Research Competitor Leaderboard: RAN Vendors & Positioning
- Table 1.4: Juniper Research Competitor Leaderboard Heatmap: O-RAN Vendors
2. Vendor Profiles
- 2.1. Vendor Profiles
- 2.1.1. Airspan Networks
- i. Corporate Information
- ii. Geographical Spread
- iii. Key Clients & Strategic Partnerships
- iv. High-level View of Offerings
- Figure 2.1: Airspan OpenRANGE Deployment
- v. Juniper Research's View: Key Strengths & Strategic Development Opportunities
- 2.1.2. Ericsson
- i. Corporate Information
- Table 2.2: Ericsson's Financial Information ($m), 2020-2023
- ii. Geographical Spread
- iii. Key Clients & Strategic Partnerships
- iv. High-level View of Offerings
- Figure 2.3: Ericsson's Intelligent Automation Platform Components and Interfaces
- v. Juniper Research's View: Key Strengths & Strategic Development Opportunities
- i. Corporate Information
- 2.1.3. Fujitsu
- i. Corporate Information
- ii. Geographical Spread
- iii. Key Clients & Strategic Partnerships
- iv. High-level View of Offerings
- v. Juniper Research's View: Key Strengths & Strategic Development Opportunities
- 2.1.4. Juniper Networks
- i. Corporate Information
- ii. Geographical Spread
- iii. Key Clients & Strategic Partnerships
- iv. High-level View of Offerings
- Figure 2.4: Juniper Networks' RIC
- v. Juniper Research's View: Key Strengths & Strategic Development Opportunities
- 2.1.5. Mavenir
- i. Corporate Information
- ii. Geographical Spread
- iii. Key Clients & Strategic Partnerships
- iv. High-level View of Offerings
- v. Juniper Research's View: Key Strengths & Strategic Development Opportunities
- 2.1.6. NEC
- i. Corporate Information
- ii. Geographical Spread
- iii. Key Clients & Strategic Partnerships
- v. Juniper Research's View: Key Strengths & Strategic Development Opportunities
- 2.1.3. Fujitsu
- i. Corporate Information
- ii. Geographical Spread
- iii. Key Clients & Strategic Partnerships
- iv. High-level View of Offerings
- v. Juniper Research's View: Key Strengths & Strategic Development Opportunities
- 2.1.4. Juniper Networks
- i. Corporate Information
- ii. Geographical Spread
- iii. Key Clients & Strategic Partnerships
- iv. High-level View of Offerings
- Figure 2.4: Juniper Networks' RIC
- v. Juniper Research's View: Key Strengths & Strategic Development Opportunities
- 2.1.5. Mavenir
- i. Corporate Information
- ii. Geographical Spread
- iii. Key Clients & Strategic Partnerships
- iv. High-level View of Offerings
- v. Juniper Research's View: Key Strengths & Strategic Development Opportunities
- 2.1.6. NEC
- i. Corporate Information
- ii. Geographical Spread
- iii. Key Clients & Strategic Partnerships
- iv. High-level View of Offerings
- Figure 2.5: NEC Open vRAN
- v. Juniper Research's View: Key Strengths & Strategic Development Opportunities
- 2.1.7. Nokia
- i. Corporate Information
- Table 2.6: Nokia Select Financial Information ($m), 2020-2023
- ii. Geographical Spread
- iii. Key Clients & Strategic Partnerships
- iv. High-level View of Offerings
- Figure 2.7: Nokia 5G AirScale Radio Product Offerings
- Figure 2.8: Nokia anyRAN
- v. Juniper Research's View: Key Strengths & Strategic Development Opportunities
- i. Corporate Information
- 2.1.8. Parallel Wireless
- i. Corporate Information
- ii. Geographical Spread
- iii. Key Clients & Strategic Partnerships
- iv. High-level View of Offerings
- Figure 2.9: Parallel Wireless O-RAN Solution
- Figure 2.10: Parallel Wireless Service Orchestration and Management
- v. Juniper Research's View: Key Strengths & Strategic Development Opportunities
- 2.1.9. Radisys
- i. Corporate Information
- ii. Geographical Spread
- iii. Key Clients & Strategic Partnerships
- iv. High-level View of Offerings
- v. Juniper Research's View: Key Strengths & Strategic Development Opportunities
- 2.1.10. Rakuten Symphony
- i. Corporate Information
- ii. Geographical Spread
- iii. Key Clients & Strategic Partnerships
- iv. High-level View of Offerings
- v. Juniper Research's View: Key Strengths & Strategic Development Opportunities
- 2.1.11. Samsung
- i. Corporate Information
- Table 2.11: Samsung's Financial Information ($b), 2019-2022
- ii. Geographical Spread
- iii. Key Clients & Strategic Partnerships
- iv. High-level View of Offerings
- Figure 2.12: Samsung vRAN Roadmap
- Figure 2.13: Samsung Network Radios
- v. Juniper Research's View: Key Strengths & Strategic Development Opportunities
- i. Corporate Information
- 2.1.12. SynaXG
- i. Corporate Information
- ii. Geographical Spread
- iii. Key Clients & Strategic Partnerships
- iv. High-Level View of Offerings
- Figure 2.14: SynaXG O-RAN Software
- Figure 2.15: SynaXG's RAN Offerings
- v. Juniper Research's View: Key Strengths & Strategic Development Opportunities
- 2.1.13. VMware
- i. Corporate Information
- ii. Geographical Spread
- iii. Key Clients & Strategic Partnerships
- iv. High-level View of Offerings
- Figure 2.16: VMware Telco Cloud Platform
- Figure 2.17: VMware Centralised RIC and Decentralised RIC
- v. Juniper Research's View: Key Strengths & Strategic Development Opportunities
- 2.1.1. Airspan Networks
- 2.2. Juniper Research Leaderboard Assessment Methodology
- 2.3. Limitations & Interpretations
- Table 2.18: Juniper Research Competitor Leaderboard: O-RAN
Data & Forecasting
1. Introduction and Methodology
- 1.1. Introduction to O-RAN
- Figure 1.1: Total Investment in O-RAN by Operators per year ($m), 2024-2029
- 1.2. Methodology
- Figure 1.2:O-RAN Market Methodology
2. Forecast Summary
- 2.1. Total Number of Consumer Subscriptions
- Figure & Table 2.1: Total Number of Consumer Subscriptions (), Split By 8 Key Regions, 2024-2029
- 2.2. Total Cellular Data Generated by Consumer Subscriptions
- Figure & Table 2.2: Total Cellular Data Generated by Consumer Subscriptions, Split By 8 Key Regions, 2024-2029
- 2.3. Total Operator Revenue From Consumer Subscriptions
- Figure & Table 2.3: Total Operator Revenue From Consumer Subscriptions ($m), Split by 8 Key Regions, 2024-2029
- 2.4. Total Number of Cellular IoT Devices
- Figure & Table 2.4:Total Number of Cellular IoT Devices (m), Split By 8 Key Regions, 2024-2029
- 2.5. Total Cellular Data Generated by Cellular IoT Devices
- Figure & Table 2.5: Total Cellular Data Generated by Cellular IoT Devices (PB), Split by 8 Key Regions, 2024-2029
- 2.6. Total Operator Revenue from Cellular IoT Devices
- Figure & Table 2.6: Total Operator Revenue from Cellular IoT Devices ($m), Split by 8 Key Regions, 2024-2029
- 2.7. Total Number of Base Stations
- Figure & Table 2.7: Total Number of Base Stations, Split by 8 Key Regions, 2024-2029
- 2.8. Total Number of O-RAN Compliant Base Stations
- Figure & Table 2.8: Total Number of O-RAN Compliant Base Stations, Split By 8 Key Regions, 2024-2029
- 2.9. Total Operator Investment in O-RAN
- Figure & Table 2.9: Total Operator Investment in O-RAN ($m), Split By 8 Key Regions, 2024-2029
- 2.10. Total Operator Savings From O-RAN
- Figure & Table 2.10: Total Operator Savings From O-RAN ($m), Split By 8 Key Regions, 2024-2029
 欧洲电信业者在「最环保电信业者」排名中占主导地位:从全球前十的七家欧洲公司汲取经验——如何应对川普政府的亲化石燃料战略
 开放式无线接取网路(O-RAN) 市场分析及至 2035 年预测:按类型、产品类型、服务、技术、组件、应用、部署类型、最终用户和功能划分
 2025-2029年全球人工智慧与无线接取网路流量优化市场
 开放式无线存取网市场规模、份额和趋势分析报告:按组件、单元、部署类型、网路、频率、地区和细分市场预测(2026-2033 年)
 O-RAN 近即时无线存取网智慧控制器市场 - 全球产业规模、份额、趋势、机会和预测,按组件、部署方式、地区和竞争格局划分,2020-2030 年预测开放式无线存取网市场-全球产业规模、份额、趋势、机会和预测,依部署方式、网路类型、元件、频率、最终用途、地区和竞争格局划分,2020-2030年预测
 开放式无线接取网路市场:依组件、网路功能、网路世代、频率、部署模式、最终用途及部署阶段划分-2025-2032年全球预测虚拟化无线接取网路市场规模、份额和趋势分析报告:按组件、部署类型、网路类型、最终用途、地区和细分市场预测,2025 年至 2033 年
 O-RAN近实时RAN智慧控制器的全球市场全球Open RAN市场