


 |
市场调查报告书
商品编码
1754849
共享移动市场:2025-2030年Shared Mobility Market: 2025-2030 |
||||||
共享移动服务,2028年之前世界人口的4分之一引进
| 主要统计 | |
|---|---|
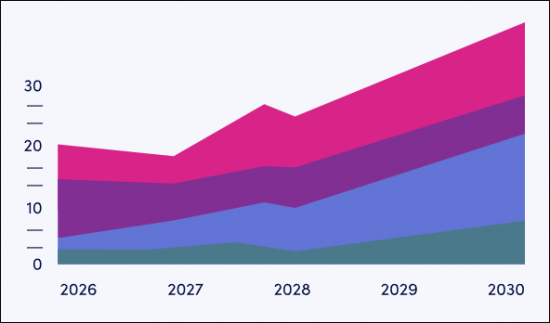
| 2025年的全球共享移动的市场规模 | 1,040亿美元 |
| 2030年的全球共享移动的市场规模 | 2,050亿美元 |
| 2025年~2030年的共享移动市场整体成长率 | 98% |
| 预测期间 | 2025-2030年 |
本研究资料包对快速变化的共享旅游市场进行了详细分析。共享旅游服务提供者可以透过本研究了解主要的出行趋势和课题、潜在的成长机会以及竞争格局。
我们的研究套组包含描绘共享旅游市场未来成长的数据。这项详细的研究揭示了市场中的最新机会和趋势,并透过对15家共享旅游服务提供者的广泛分析提供了深刻的见解。报告探讨了公众认知、多式联运规划能力以及无障碍出行课题等。
主要特点
- 市场动态:我们深入了解共享出行市场的主要出行趋势和市场扩张课题。我们探讨了公私部门之间的分歧、监管的复杂性、持续的营运成本以及无障碍出行问题带来的课题,并分析了采用共享出行的多种用例。该研究进一步展望了共享出行的未来。
- 关键要点和策略建议:详细分析了主要的市场机会和研究结果,并为共享旅游服务提供者提供了关于新兴趋势和未来市场发展的策略建议。
- 基准产业预测:此预测涵盖共享出行数据,细分为叫车、汽车共享、电动滑板车和自行车共享。预测内容包括每个细分市场的行程次数和行驶距离等指标。此外,该预测还涵盖了 MaaS(旅游即服务)和公共交通的数据,细分为消费者用户和企业用户,以及收入和节省金额。
- Juniper Research 竞争力排行榜:此排行榜评估了 15 家共享旅游供应商的能力,重点在于共享旅游产业的关键参与者。
样品view
市场资料·预测报告
样品
市场趋势·策略报告
市场资料&预测报告
研究套组包含一整套预测数据,包含 132 个表格和超过 60,000 个数据点。此研究套组包含以下指标:
- 共享移动和MaaS的整体用户数
- 共享移动和MaaS服务的总支出额
- 共享移动和MaaS的行车距离
研究套组的共享移动部分中,包含以下指标:
- 共享移动的用户数
- 共享移动服务的总支出额
- 共享移动的行车数
- 共享移动的行车距离
以下指标由市场提供:
- 召车
- 汽车共享
- EScooter
- 摩托车共享
调查的MaaS部分中包含以下指标:
- MaaS及MaaS支援大众运输的用户数
- 来自MaaS及MaaS支援大众交通工具使用者的收益
- MaaS及MaaS支援大众运输的行车数
以下指标由市场提供:
- 消费者 MaaS 用户及收入
- 企业 MaaS 用户及收入
- 消费者 MaaS 节省的费用
- 企业 MaaS 节省的费用
- 公车和铁路服务
Juniper Research 的互动式预测 (Excel) 包含以下功能:
- 统计分析:您可以搜寻资料期间所有地区和国家显示的特定指标。图表可以轻鬆修改并汇出到剪贴簿。
- 国家/地区资料工具:此工具可让使用者查看预测期间内所有地区和国家的指标。使用者可以使用搜寻栏缩小显示指标的范围。
- 国家比较工具:可以选择每个国家进行比较。此工具包含汇出图表的功能。
- 假设分析:使用者可以在此将预测指标与自己的假设进行比较。
竞争排行榜报告
竞争排行榜报告对共享出行解决方案领域的 15 家领先供应商进行了详细的评估和市场定位。根据供应商的产能和能力评估、他们提供的共享出行模式以及他们拥有的与竞争对手不同的技术,这些供应商被定位为既定领导者、领先的课题者或颠覆者和课题者。
目录
市场趋势与策略
第1章 重要点和策略性建议
- 重要点
- 策略性建议
第2章 市场形势
- 共享移动的历史
- 共享移动为何必要?
- 共享移动的种类
- 调配车辆服务
- 微行动
- 电动滑板车
- 自行车共享
- 共乘
- 微型公车和接驳车服务
- 微转运
- 接驳车服务
- 城市空中交通 (UAM)
- 大众运输
- 巴士
- 巴士高速运输系统(BRT)
- 电车
- 有轨电车
- 地铁系统
- 渡轮
- Mobility-as-a-Service
第3章 市场区隔分析
- 调配车辆服务
- 目前情形
- 最近的趋势
- 课题
- 未来预测
- 共享微出行
- 目前情形
- 最近的趋势
- 课题
- 未来预测
- 共乘
- 目前情形
- 最近的趋势
- 课题
- 未来预测
- 城市空中交通 (UAM)
- 目前情形
- 最近的趋势
- 课题
- 未来预测
- 大众运输
- 目前情形
- 最近的趋势
- 课题
- 未来预测
- Mobility-as-a-Service
- 目前情形
- 最近的趋势
- 课题
- 未来预测
第4章 各国准备指数
- 各国准备指数:简介
- 焦点市场
- 成长市场
- 饱和市场
- 新兴国家市场
竞争排行榜
第1章 Juniper Research的竞争排行榜
第2章 企业简介
- 业者简介
- Bird Global
- BlaBlaCar
- Bolt
- Cabify
- DiDi Chuxing
- Ford Smart Mobility
- Grab
- Hertz
- Lime
- Lyft
- Ola
- Siemens Mobility
- Uber Technologies
- Zipcar
- Zoomcar
- 相关调查
资料与预测
第1章 简介与调查手法
第2章 市场摘要
- 共享移动
- 共享移动的用户数
- 共享移动的利用回数
- 共享移动的服务支出额
第3章 市场区隔分割
- 调配车辆服务
- 用户数
- 服务支出额
- 汽车共享
- 用户数
- 服务支出额
- 电动滑板车
- 用户数
- 服务支出额
- 自行车共享
- 用户数
- 服务支出额
- MaaS和大众运输
- 用户数
- 服务支出额
'Shared Mobility Services to be Adopted by One Quarter of Global Population by 2028'
| KEY STATISTICS | |
|---|---|
| Shared mobility market value globally in 2025: | $104bn |
| Shared mobility market value globally in 2030: | $205bn |
| Total shared mobility market value growth between 2025 & 2030: | 98% |
| Forecast period: | 2025-2030 |
Overview
Our "Shared Mobility" Market research suite provides detailed analysis of this rapidly changing market; allowing shared mobility service providers to gain an understanding of key mobility trends and challenges, potential growth opportunities, and the competitive environment.
Providing multiple options which can be purchased separately, the research suite includes access to data mapping the future growth of the shared mobility market. The detailed study reveals the latest opportunities and trends within the market, and an insightful document containing an extensive analysis of 15 shared mobility service providers within the space. Aspects such as public attitudes, multimodal planning capabilities, and challenges to accessibility are explored throughout the report. The coverage can also be purchased as a Full Research Suite, which contains all these elements and includes a substantial discount.
Collectively, these elements provide an effective tool for understanding this rapidly evolving market; allowing shared mobility vendors to set out their future strategies to provide effective and efficient mobility services to their customers. Its unparalleled coverage makes this research suite an incredibly useful resource for gauging the future of this complex market.
Key Features
- Market Dynamics: Insights into key mobility trends and market expansion challenges within the shared mobility market. It addresses the challenges posed by fragmentation between public and private sectors, regulatory complexity, maintaining operational costs, and accessibility problems, and also analyses multiple use cases where shared mobility is employed. Furthermore, the research provides a future outlook on the landscape of shared mobility.
- Key Takeaways & Strategic Recommendations: In-depth analysis of key development opportunities and findings within the market, accompanied by key strategic recommendations for shared mobility service providers on emerging trends and how the market is expected to evolve.
- Benchmark Industry Forecasts: The forecasts include data on shared mobility, split by ride-hailing, car sharing, e-scooter, and bike sharing. This includes metrics such as the number of journeys and distance covered for each segment. The forecast also includes data on Mobility-as-a-Service (MaaS) and public transport, split into consumer and corporate users, revenue, and savings.
- Juniper Research Competitor Leaderboard: Key player capability and capacity assessment for 15 shared mobility vendors, via the Juniper Research Competitor Leaderboard; featuring analysis around major players in the shared mobility industry.
SAMPLE VIEW
Market Data & Forecasting Report
The numbers tell you what's happening, but our written report details why, alongside the methodologies.
SAMPLE VIEW
Market Trends & Strategies Report
A comprehensive analysis of the current market landscape, alongside strategic recommendations.
Market Data & Forecasting Report
The market-leading research suite for the "shared mobility" market includes access to the full set of forecast data, consisting of 132 tables and over 60,000 datapoints. Metrics in the research suite include:
- Total Volume of Shared Mobility & MaaS Users
- Total Spend on Shared Mobility & MaaS Services
- Total Number of Shared Mobility & MaaS Journeys
The shared mobility portion of the research suite includes the following metrics:
- Total Volume of Shared Mobility Users
- Total Spend on Shared Mobility Services
- Total Number of Shared Mobility Journeys
- Total Distance Covered by Shared Mobility Journeys
These metrics are provided for the following key market verticals:
- Ride-hailing
- Car sharing
- E-scooters
- Bike sharing
The MaaS portion of the research suite includes the following metrics:
- Total Number of MaaS & MaaS-enabled Public Transport Users
- Total Revenue From MaaS & MaaS-enabled Public Transport Users
- Total Number of MaaS & MaaS-enabled Public Transport Journeys
These metrics are provided for the following market verticals:
- Consumer MaaS Users & Revenue
- Corporate MaaS Users & Revenue
- Consumer MaaS Savings
- Corporate MaaS Savings
- Bus & Train Services
The Juniper Research Interactive Forecast Excel contains the following functionality:
- Statistics Analysis: Users benefit from the ability to search for specific metrics, displayed for all regions and countries across the data period. Graphs are easily modified and can be exported to the clipboard.
- Country Data Tool: This tool allows the user to review metrics for all regions and countries in the forecast period. Users can refine the metrics displayed via the search bar.
- Country Comparison Tool: Users can select and compare each of the countries. The ability to export graphs is included in this tool.
- What-if Analysis: Here, users can compare forecast metrics against their own assumptions. 5 interactive scenarios.
Market Trends & Strategies Report
This report examines the "shared mobility" market landscape in detail. It assesses different market trends and factors that are shaping the evolution of this diverse market, such as collaboration between public services and private shared mobility providers, the trialling of autonomy in specific markets, and methods of first- and last-mile journey coverage; addressing key vertical and developing challenges, and how vendors should navigate these. As well as looking into shared mobility use cases, it also includes evaluation of the different methods of shared mobility with the highest usage rates, and those which some vendors are experimenting with; in order to assess their viability in this market.
Competitor Leaderboard Report
The Competitor Leaderboard report provides a detailed evaluation and market positioning for 15 leading vendors in the shared mobility solution space. These vendors are positioned as an established leader, leading challenger, or disruptor and challenger based on capacity and capability assessments, which modes of shared mobility they offer, and any technologies which set them apart from their competitors. The 15 vendors consist of:
|
|
|
This document is centred around the Juniper Research Competitor Leaderboard; a vendor positioning tool that provides an at-a-glance view of the competitive landscape, backed by a robust methodology.
Table of Contents
Market Trends & Strategies
1. Key Takeaways & Strategic Recommendations
- 1.1. Key Takeaways
- 1.2. Strategic Recommendations
2. Market Landscape
- 2.1. Introduction
- 2.2. Shared Mobility History
- 2.3. Why Do We Need Shared Mobility?
- 2.4. Types of Shared Mobility
- 2.4.1. Ride-hailing
- 2.4.2. Micromobility
- i. E-scooters
- Figure 2.1: Example of Dockless E-scooter Parking Zone
- ii. Bike Sharing
- Figure 2.2: Example of Docked Bike Sharing Bikes
- i. E-scooters
- 2.4.3. Ride Sharing
- 2.4.4. Microtransit & Shuttle Services
- i. Microtransit
- ii. Shuttle Services
- 2.4.5. Urban Aerial Mobility
- Figure 2.3: An Electric Air Taxi Taking Off
- 2.5. Public Transport
- i. Buses
- ii. Bus Rapid Transit (BRT)
- iii. Trains
- iv. Trams
- v. Metro Systems
- vi. Ferries
- 2.6. Mobility-as-a-Service
3. Segment Analysis
- 3.1. Ride-hailing
- 3.1.1. Current Status
- 3.1.2. Recent Developments
- 3.1.3. Challenges
- 3.1.4. Future Outlook
- Figure 3.1: Total Number of Ride-hailing Service Users (m), Globally, Split by 8 Key Regions, 2025-2030
- 3.2. Shared Micromobility
- 3.2.1. Current Status
- 3.2.2. Recent Developments
- 3.2.3. Challenges
- 3.2.4. Future Outlook
- Figure 3.2: Total Number of Shared Micromobility Users (m), Globally, Split by Key Regions, 2025-2030
- 3.3. Ride Sharing
- 3.3.1. Current Status
- 3.3.2. Recent Developments
- 3.3.3. Challenges
- 3.3.4. Future Outlook
- 3.4. Urban Aerial Mobility
- 3.4.1. Current Status
- 3.4.2. Recent Developments
- 3.4.3. Challenges
- 3.4.4. Future Outlook
- 3.5. Public Transport
- 3.5.1. Current Status
- 3.5.2. Recent Developments
- 3.5.3. Challenges
- 3.5.4. Future Outlook
- 3.6. Mobility-as-a-Service
- 3.6.1. Current Status
- Figure 3.3: Total Number of MaaS Users (m), Globally, Split by 8 Key Regions, 2025-2030
- 3.6.2. Recent Developments
- 3.6.3. Challenges
- 3.6.4. Future Outlook
- Figure 3.4: Total Number of MaaS & MaaS-enabled Public Transport Users (m), Globally, Split by 8 Key Regions, 2025-2030
- 3.6.1. Current Status
4. Country Readiness Index
- 4.1. Introduction to Country Readiness Index
- Figure 4.1: Shared Mobility Country Readiness Index: Regional Definitions
- Table 4.2: Juniper Research's Country Readiness Index Scoring Criteria: Shared Mobility
- Figure 4.3: Juniper Research's Country Readiness Index: Shared Mobility
- Figure 4.4: Shared Mobility Country Readiness Index: Market Segments
- 4.1.1. Focus Markets
- i. Youth-driven Adoption
- Figure 4.5: Total Spend on Bike Sharing Services ($m), Split by 8 Key Regions, 2025-2030
- ii. Increasing Accessibility to Public Transportation
- i. Youth-driven Adoption
- 4.1.2. Growth Markets
- i. Potential to Introduce Emerging Forms of Shared Mobility
- Figure 4.6: Total Number of Shared Mobility Users (m), Split by Six Growth Markets, 2025-2030
- ii. Strong Investment Opportunities
- Figure 4.7: Total Spend on Shared Mobility ($m), Split by Six Growth Markets, 2025-2030
- i. Potential to Introduce Emerging Forms of Shared Mobility
- 4.1.3. Saturated Markets
- Figure 4.8: Total Volume of Ride-hailing Users (m), Split by Four Saturated Markets, 2025-2030
- 4.1.4. Developing Markets
- Figure 4.9: Total Spend on Shared Mobility Services ($m), Split by Top Eight Developing Markets, 2025-2030
Competitor Leaderboard
1. Juniper Research Competitor Leaderboard
- 1.1. Why Read This Report
- Figure 1.1: Juniper Research's Competitor Leaderboard: Shared Mobility Vendors Included & Product Portfolios
- Figure 1.2: Juniper Research's Competitor Leaderboard for the Shared Mobility Market
- Table 1.3: Shared Mobility Market: Vendors & Positioning
- Table 1.4: Juniper Research's Competitor Leaderboard Heatmap for Shared Mobility Vendors
2. Company Profiles
- 2.1. Vendor Profiles
- 2.1.1. Bird Global
- i. Corporate
- Table 2.1: Bird Global's Funding Rounds ($m), 2018-2022
- ii. Geographical Spread
- iii. Key Clients & Strategic Partnerships
- iv. High-level View of Offerings
- v. Juniper Research's View: Key Strengths & Strategic Development Opportunities
- i. Corporate
- 2.1.2. BlaBlaCar
- i. Corporate
- Table 2.2: BlaBlaCar's Funding Rounds ($m), 2010-2024
- ii. Geographical Spread
- iii. Key Clients & Strategic Partnerships
- iv. High-level View of Offerings
- Figure 2.3: BlaBlaCar App
- v. Juniper Research's View: Key Strengths & Strategic Development Opportunities
- i. Corporate
- 2.1.3. Bolt
- i. Corporate
- Figure 2.4: Bolt's Funding Rounds ($m), 2020-2024
- ii. Geographical Spread
- iii. Key Clients & Strategic Partnerships
- iv. High-level View of Offerings
- v. Juniper Research's View: Key Strengths & Strategic Development Opportunities
- i. Corporate
- 2.1.4. Cabify
- i. Corporate
- Table 2.5: Cabify's Funding Rounds ($m), 2015-2024
- ii. Geographical Spread
- iii. Key Clients & Strategic Partnerships
- iv. High-level View of Offerings
- v. Juniper Research's View: Key Strengths & Strategic Development Opportunities
- i. Corporate
- 2.1.5. DiDi Chuxing
- i. Corporate
- Table 2.6: DiDi Chuxing's Financial Snapshot ($m), 2023-2024
- ii. Geographical Spread
- iii. Key Clients & Strategic Partnerships
- iv. High-level View of Offerings
- v. Juniper Research's View: Key Strengths & Strategic Development Opportunities
- i. Corporate
- 2.1.6. Ford Smart Mobility
- i. Corporate
- Table 2.7: Ford Smart Mobility's Funding Rounds ($m), 2016-2018
- ii. Geographical Spread
- iii. Key Clients & Strategic Opportunities
- iv. High-level View of Offerings
- v. Juniper Research's View: Key Strengths & Strategic Development Opportunities
- i. Corporate
- 2.1.7. Grab
- i. Corporate
- Figure 2.8: Grab's Financial Snapshot ($m), 2023-2024
- ii. Geographical Spread
- iii. Key Clients & Strategic Partnerships
- iv. High-level View of Offerings
- v. Juniper Research's View: Key Strengths & Strategic Devlopment Opportunities
- i. Corporate
- 2.1.8. Hertz
- i. Corporate
- Figure 2.9: Hertz's Financial Snapshot ($m), 2023-2024
- ii. Geographical Spread
- iii. Key Clients & Strategic Partnerships
- iv. High-level View of Offerings
- v. Juniper Research's View: Key Strengths & Strategic Development Opportunities
- i. Corporate
- 2.1.9. Lime
- i. Corporate
- Figure 2.10: Lime's Funding Rounds ($m), 2018-2021
- ii. Geographical Spread
- iii. Key Clients & Strategic Partnerships
- iv. High-level View of Offerings
- Figure 2.11: Lime's Gen 4 E-scooter
- v. Juniper Research's View: Key Strengths & Strategic Development Opportunities
- i. Corporate
- 2.1.10. Lyft
- i. Corporate
- Figure 2.12: Lyft's Financial Snapshot ($m), 2023-2024
- ii. Geographical Spread
- iii. Key Clients & Strategic Partnerships
- iv. High-level View of Offerings
- v. Juniper Research's View: Key Strengths & Strategic Development Opportunities
- i. Corporate
- 2.1.11. Ola
- i. Corporate
- Table 2.13: Ola's Funding Rounds ($m), 2019-2022
- ii. Geographical Spread
- iii. Key Clients & Strategic Partnerships
- iv. High-level View of Offerings
- v. Juniper Research's View: Key Strengths & Strategic Opportunities
- i. Corporate
- 2.1.12. Siemens Mobility
- i. Corporate
- Figure 2.14: Siemens Mobility Financial Snapshot ($m), 2023-2024
- ii. Geographical Spread
- iii. Key Clients & Strategic Partnerships
- iv. High-level View of Offerings
- v. Juniper Research's View: Key Strengths & Strategic Opportunities
- i. Corporate
- 2.1.13. Uber Technologies
- i. Corporate
- Figure 2.15: Uber Technologies Financial Snapshot ($m), 2023-2024
- ii. Geographical Spread
- iii. Key Clients & Strategic Partnerships
- iv. High-level View of Offerings
- Figure 2.16: How UberX Share Looks in the Uber App
- v. Juniper Research's View: Key Strengths & Strategic Opportunities
- i. Corporate
- 2.1.14. Zipcar
- i. Corporate
- ii. Geographical Spread
- iii. Key Clients & Strategic Partnerships
- iv. High-level View of Offerings
- v. Juniper Research's View: Key Strengths & Strategic Opportunities
- 2.1.15. Zoomcar
- i. Corporate
- Figure 2.17: Zoomcar Financial Snapshot ($m), 2023-2024
- ii. Geographical Spread
- iii. Key Clients & Strategic Partnerships
- iv. High-level View of Offerings
- v. Juniper Research's View: Key Strengths & Strategic Opportunities
- i. Corporate
- 2.1.1. Bird Global
- 2.2. Related Research
Data & Forecasting
1. Introduction & Methodology
- 1.1. Introduction
- 1.2. Methodology & Assumptions
- Figure 1.1: Ride-hailing Forecast Methodology
- Figure 1.2: Car Sharing Forecast Methodology
- Figure 1.3: E-scooter Forecast Methodology
- Figure 1.4: Bike Sharing Forecast Methodology
- Figure 1.5: MaaS & MaaS-enabled Public Transport Forecast Methodology
2. Market Summary
- 2.1. Shared Mobility
- 2.1.1. Total Volume of Shared Mobility Users
- Figure & Table 2.1: Total Volume of Shared Mobility Users (m), Globally, Split by 8 Key Regions, 2025-2030
- 2.1.2. Total Number of Shared Mobility Journeys
- Figure & Table 2.2: Total Number of Shared Mobility Journeys (m), Globally, Split by 8 Key Regions, 2025-2030
- 2.1.3. Total Spend on Shared Mobility Services
- Figure & Table 2.3: Total Spend on Shared Mobility Services ($m), Globally, Split by 8 Key Regions, 2025-2030
- 2.1.1. Total Volume of Shared Mobility Users
3. Segment Splits
- 3.1. Ride-hailing
- 3.1.1. Total Number of Ride-hailing Users
- Figure & Table 3.1: Total Number of Ride-hailing Users (m), Globally, Split by 8 Key Regions, 2025-2030
- 3.1.2. Total Spend on Ride-hailing Services
- Figure & Table 3.2: Total Spend on Ride-hailing Services ($m), Globally, Split by 8 Key Regions, 2025-2030
- 3.1.1. Total Number of Ride-hailing Users
- 3.2. Car Sharing
- 3.2.1. Total Number of Car Sharing Users
- Figure & Table 3.3: Total Number of Car Sharing Users (m), Globally, Split by 8 Key Regions, 2025-2030
- 3.2.2. Total Spend on Car Sharing Services
- Figure & Table 3.4: Total Spend on Car Sharing Services ($m), Split by 8 Key Regions, 2025-2030
- 3.2.1. Total Number of Car Sharing Users
- 3.3. E-scooters
- 3.3.1. Total Number of E-scooter Users
- Figure & Table 3.5: Total Number of E-scooter Users (m), Split by 8 Key Regions, 2025-2030
- 3.3.2. Total Spend on E-scooter Services
- Figure & Table 3.6: Total Spend on E-scooter Services ($m), Split by 8 Key Regions, 2025-2030
- 3.3.1. Total Number of E-scooter Users
- 3.4. Bike Sharing
- 3.4.1. Total Number of Bike Sharing Users
- Figure & Table 3.7: Total Number of Bike Sharing Users (m), Split by 8 Key Regions, 2025-2030
- 3.4.2. Total Spend on Bike Sharing Services
- Figure & Table 3.8: Total Spend on Bike Sharing Services ($m), Split by 8 Key Regions, 2025-2030
- 3.4.1. Total Number of Bike Sharing Users
- 3.5. MaaS & Public Transport
- 3.5.1. Total Number of MaaS & MaaS-enabled Public Transport Users
- Figure & Table 3.9: Total Number of MaaS & MaaS-enabled Public Transport Users (m), Globally, Split by 8 Key Regions, 2025-2030
- 3.5.2. Total Spend on MaaS & MaaS-enabled Public Transport Services
- Figure & Table 3.10: Total Spend on MaaS & MaaS-enabled Public Transport Services ($m), Globally, Split by 8 Key Regions, 2025-2030
- 3.5.1. Total Number of MaaS & MaaS-enabled Public Transport Users
 共享出行市场:依服务类型、经营模式、驱动系统、车辆类型和使用者类型划分-2026-2032年全球市场预测
 2026年全球共享旅游市场报告
 2034年农村和郊区共用出行市场预测:按交通方式、用户层、营运商类型、定价模式、服务类型和区域分類的全球分析共用旅游和共乘平台市场预测:至 2034 年—按服务类型、车辆类型、技术属性、经营模式、最终用户和地区分類的全球分析
 共享出行市场规模、份额、成长及全球产业分析:按类型、应用和地区分類的洞察,2026-2034 年预测全球共用出行市场规模、份额、趋势和成长分析报告(2026-2034)
 摩托车共享旅游市场-全球产业规模、份额、趋势、机会、预测:按动力方式、旅游类型、地区和竞争格局划分,2021-2031年乘用车共享出行市场-全球产业规模、份额、趋势、机会及预测,依动力类型(内燃机、电动)、旅游类型(共享旅游、车辆租赁、私家车)、地区及竞争格局划分。 2021-2031年预测城市共用服务市场预测至2032年:按服务、经营模式、组织规模、技术、最终用户和地区分類的全球分析消费者之声:印度 CNG 汽车购买趋势