


 |
市场调查报告书
商品编码
1683931
亚太室内 LED 照明:市场占有率分析、产业趋势与统计、成长预测(2025-2030 年)Asia Pacific Indoor LED Lighting - Market Share Analysis, Industry Trends & Statistics, Growth Forecasts (2025 - 2030) |
||||||
※ 本网页内容可能与最新版本有所差异。详细情况请与我们联繫。
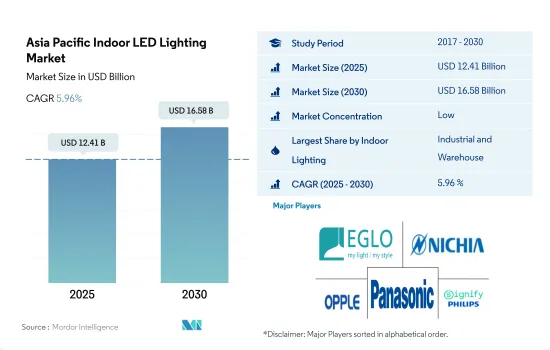
亚太室内 LED 照明市场规模预计在 2025 年为 124.1 亿美元,预计到 2030 年将达到 165.8 亿美元,预测期内(2025-2030 年)的复合年增长率为 5.96%。
工业和住宅领域的不断发展推动着市场的成长
- 从金额份额来看,2023年工业和仓储将占据大部分市场份额。截至2022年,中国是世界第二大经济体。新冠疫情前,中国仓库空间成本平均为每平方公尺每月 44.3 元人民币(6.15 美元)。中国对仓库的需求稳定成长,推高了疫情后的仓库租金成本。未来五年中国仓储产业收益预计以每年4.3%的速度成长。
- 同样,在印度,製造业在疫情之前创造了印度GDP的16-17%,预计将成为成长最快的产业之一。印度工业和仓储业报告强劲吸收量,约 1,100 万平方英尺,一线城市占 77% 的需求。由于这些因素,预计 LED 的广泛需求将会成长。
- 从成交量份额来看,2023年住宅将占大部分市场。过去三十年,亚洲经历了较高的都市化。快速都市化推动了经济成长,但也带来了巨大的住宅需求,导致住宅飙升。在日本,由于政府为因应人口减少而推出的住宅政策,到2023年,很有可能出现1000万套的供应过剩。 2023年,家庭数量将达到5,419万的峰值。这些因素正在推动对LED的需求。
- 政府补贴在引进新住宅发挥了重要作用。在印度,政府已经推出了多项节能计划。例如,中央政府雄心勃勃的 PMAY(Pradhan Mantri Awas Yojana)计划旨在到 2022 年在全国范围内建造 2000 万套经济适用住宅。这些因素可能会导致未来一段时间内 LED 的销售强劲和需求增加。
工业生产和可支配收入的提高推动市场需求
- 以金额份额和数量份额来看,2023年中国将占据室内LED照明的大部分份额。以金额份额来看,2023年,工业和仓储(I&W)将占据中国大部分份额。 2021年中国工业生产维持稳定。 2021年,中国总产出为48,658亿美元,比2020年成长26.04%。 2022年,工业生产成长3.6%。 2023年3月份中国工业生产与前一年同期比较增3.9%。因此,疫情过后工业产量的成长将在未来几年创造对室内照明的需求。
- 此外,该公司在2021年投资者日上宣布,计划在未来五年内将物流网络扩展到45至50个物流中心。 2022年,全国出口总额创历史新高,达42.7兆元(6.3兆美元),比2021年成长7.7%。同时,进口成长了1.1%。随着物流中心需求的增加,LED照明的需求也预计会增加。
- 印度在金额和数量份额上均位居第二。从出货量份额来看,2022年住宅照明将占最大份额。 2022年全国平均家庭规模(包括登记在册的人)为4.4人,单人家庭和自住房屋数量增加。印度的可支配所得正在增加。 2022 年 3 月,印度的人均收入为 2,301.4 美元,而 2021 年 3 月为 1,971.6 美元。这显示印度人民的购买力可能低于这些国家。因此,人们将会购买更多的住宅,并且 LED 照明的使用也会增加。
亚太室内 LED 照明市场趋势
人口成长、人均收入提高和政府补贴推动 LED 市场
- 亚太地区人口约 47 亿,占全球总人口的 59.7%,其中包括中国、印度等世界人口最多的国家,其中 46.3% 的人口居住在城市(2019 年为 21.4 亿)。该全部区域生育率接近每名妇女2.1个孩子。东亚地区的家庭规模已降至每名妇女抚养 1.7 人,但南亚地区的家庭规模仍高达每位妇女抚养 2.5 人。此外,该地区五分之二的人口目前居住在都市区。随着数以百万计的人口为了寻找就业和更好的机会从农村迁移到城镇,这一比例在未来几年将大幅增加。因此,预计都市区家庭数量的增加将推动该地区采用 LED 来满足照明需求。
- 该地区包括几个新兴国家,儘管受到疫情影响,发展中国家的可支配收入仍在成长。 2022 年 12 月,中国的人均收入达到 12,732.5 美元,而 2021 年 12 月为 12,615.7 美元。 2022 年 3 月,印度的人均收入为 2,301.4 美元,而 2021 年 3 月为 1,971.6 美元。 2022 年 12 月,日本的人均收入达到 33,911.2 美元,而 2021 年 12 月为 39,916.1 美元。这将提高个人的消费能力,从而将更多资金投入新的住宅空间。对于家庭用户,2012年中国政府提供了22亿元人民币的补助用于使用节能灯泡和LED灯。日本政府于2010年4月推出生态积分计划,用户可依照2:1的生态积分比例使用其生态积分购买LED灯,预计将进一步增加LED照明的需求。
基础设施建设努力和节能照明的广泛采用将推动 LED 照明的成长
- 在亚太地区,工业部门预计将成为2021年最大的能源消费量,其次是住宅和商业部门。此外,亚太地区以其正在进行和即将推出的基础设施计划而闻名,尤其是智慧城市计划,这些计划可以产生对建筑运营的需求。工业和商业部门也在迅速扩张。东京和印度计划在 2022 年在全球范围内就基础设施开发计划展开合作。在尼泊尔等两国已有计划启动的国家,新德里和东京可以充分利用他们在计划计画规划、设计和实施方面的合作。由于这些发展,该地区对 LED 的需求预计会增加。
- 商业部门的电力需求往往在11至13小时左右。工业部门的用电量在一天和一年中往往更加稳定。住宅领域的电力需求通常在晚上亮灯时最高,平均照明时间约为六到八小时。此外,科钦智能使命有限公司(CSML)正在准备一个价值 4 亿印度卢比的计划,于 2022 年在印度科钦安装 LED 照明,确保车辆和行人的安全。这些项目正在刺激LED产业的扩张。
- 亚太国家正在透过使用LED来推动节能。例如,2018年1月,澳洲政府决定在澳洲和纽西兰引进符合欧盟要求的LED灯泡最低标准,以进一步完善照明能源效率法规,逐步淘汰低效率的滷素灯。此举将减少该国的电力使用并推广使用 LED 照明。
亚太室内 LED 照明产业概况
亚太室内LED照明市场较为分散,五大主要企业占了26.26%的市场。市场的主要企业是:EGLO Leuchten GmbH、Nichia Corporation、OPPLE Lighting、Panasonic Holdings Corporation和Signify(飞利浦)(按字母顺序排列)。
其他福利
- Excel 格式的市场预测 (ME) 表
- 3 个月的分析师支持
目录
第 1 章执行摘要和主要发现
第二章 报告要约
第 3 章 简介
- 研究假设和市场定义
- 研究范围
- 调查方法
第四章 产业主要趋势
- 人口
- 人均收入
- LED进口总量
- 照明电力消耗量
- 家庭数量
- LED渗透率
- 园艺区
- 法律规范
- 中国
- 印度
- 日本
- 价值链与通路分析
第五章 市场区隔
- 室内照明
- 农业照明
- 商业照明
- 办公室
- 零售
- 其他的
- 工业/仓库
- 住宅
- 国家
- 中国
- 印度
- 日本
- 其他亚太地区
第六章 竞争格局
- 主要策略趋势
- 市场占有率分析
- 业务状况
- 公司简介(包括全球概况、市场层级概况、主要业务部门、财务状况、员工人数、关键资讯、市场排名、市场占有率、产品和服务、最新发展分析)
- ACUITY BRANDS, INC.
- ams-OSRAM AG
- EGLO Leuchten GmbH
- Endo Lighting Corporation
- Guangdong PAK Corporation Co.,Ltd.
- Nichia Corporation
- OPPLE Lighting Co., Ltd
- Panasonic Holdings Corporation
- Signify(Philips)
- Toshiba Corporation
第七章:执行长的关键策略问题
第 8 章 附录
- 世界概况
- 概述
- 五力分析框架
- 全球价值链分析
- 市场动态(DRO)
- 资讯来源和进一步阅读
- 图片列表
- 关键见解
- 资料包
- 词彙表
The Asia Pacific Indoor LED Lighting Market size is estimated at 12.41 billion USD in 2025, and is expected to reach 16.58 billion USD by 2030, growing at a CAGR of 5.96% during the forecast period (2025-2030).
Increasing development in the industrial sector and residential sector drives the market growth
- In terms of value share, in 2023, industrial and warehouse accounts for most of the share. China is the second-largest economy in the world as of 2022. Warehouse space in China cost an average of CNY 44.3 (USD 6.15) per square meter per month during pre-COVID-19. In China, there has been a steady rise in the demand for warehouses, raising the cost of renting them post-pandemic. Revenue for the storage industry in China is expected to increase at an annualized 4.3% over the five years.
- Similarly, in India, manufacturing generated 16-17% of India's GDP before the pandemic and is expected to be one of the fastest-growing sectors. India's industrial and warehousing sector reported a nearly 11 million square feet robust absorption, with tier-I cities driving 77% of the demand. Such factors are expected to increase the LED penetration demand.
- In terms of volume share, in 2023, residential accounts for most of the share. Over the past three decades, Asia experienced a high urbanization rate. While rapid urbanization helped to fuel economic growth, it has led to major demand for housing, resulting in high housing prices. Japan will likely see an excess supply of 10 million dwelling units in 2023, partly due to government housing policy with a shrinking population. The number of households will peak at 54.19 million in 2023. Such a factor caters to a major LED demand.
- Government subsidy plays a major role in the adoption of new housing. In India, the government has introduced several energy-saving programs. For example, the central government's ambitious Pradhan Mantri Awas Yojana (PMAY) program aims to build 20 million affordable metropolitan housing units nationwide by 2022. Such factors might lead to major sales, leading to more LED demand in the coming period.
Growing number of industrial production and disposable income drive the demand for market
- In terms of value and volume share, China stood with the majority of the share in indoor LED lighting in 2023. In terms of value share, in 2023, industrial and warehouse (I&W) accounted for the majority of the share in China. China sustained its industrial production in 2021. In 2021, China produced a total of USD 4865.8 billion, an increase of 26.04% compared to 2020. In 2022, industrial production grew by 3.6%. China's industrial production increased by 3.9% year-on-year in March 2023. Thus, the growing industrial production post-pandemic is creating demand for indoor lighting in the coming years.
- In addition, during its Investor Day in 2021, the company announced that it intends to expand its logistics network over the following five years to 45 to 50 distribution centers. The country's total exports hit an all-time high in 2022, accounting for CNY 42.07 trillion (USD 6.3 trillion), up 7.7% from 2021. On the other hand, imports increased by 1.1%. With the increasing demand for distribution centers, the LED demand is expected to rise.
- India stands at the second spot in terms of value and volume share. Regarding volume share, residential lighting had the largest share in 2022. In 2022, the average household size, including all registrants nationwide, was 4.4, leading to an increase in private households and homeowners. In India, disposable income is increasing. India's per capita income reached USD 2301.4 in March 2022, compared to USD 1971.6 in March 2021. This suggests that people in India may have lower purchasing power than those countries. As a result, more homes will be purchased and the use of LED lighting will increase.
Asia Pacific Indoor LED Lighting Market Trends
The LED market is driven by increasing population, rising per capita income, and government subsidies
- Asia-Pacific is home to 59.7% of the world's population, which is around 4.7 billion people, and includes the world's most populous countries, such as China and India, and 46.3 % of the population is urban (2.14 billion people in 2019). The region's overall fertility rate is close to 2.1 births per woman. Family size has decreased to 1.7 children per woman in East Asia while maintaining a high of 2.5 children per woman in South Asia. Further, two out of every five people in the region currently live in urban areas. This ratio will increase significantly in the coming as millions move from the countryside to towns and cities in search of employment and better opportunities. Thus, the increase in the number of households in urban areas is expected to create more LED penetration for the need for illumination in the region.
- This region includes several developing nations, and despite the pandemic, disposable income is growing in developing countries. China's per capita income reached USD 12,732.5 in December 2022, compared to USD 12,615.7 in December 2021. India's per capita income reached USD 2301.4 in March 2022, compared to USD 1971.6 in March 2021. Japan's per capita income reached USD 33,911.2 in December 2022, compared to USD 39,916.1 in December 2021. Such instances result in the rising spending power of individuals and affording more money for new residential spaces. For households, in 2012, the Chinese government offered a subsidy of CNY 2.2 billion for the use of energy-conserving light bulbs and LEDs. The Japanese government introduced a consumer rebate program known as the "Eco-Point" program in April 2010. Users may use their Eco-Points to purchase LED lamps at a 2 to 1 Eco-point ratio, which is further expected to surge the demand for LED lighting.
Initiatives related to infrastructure development and increasing use of energy-efficient lighting to drive the growth of LED lights
- The industrial sector in the Asia-Pacific had planned to have the biggest energy consumption in 2021, followed by the residential and commercial sectors. Additionally, Asia-Pacific is known for its ongoing and future infrastructure initiatives, notably smart city projects, which could generate demand for building operations. The industrial and commercial sector is also expanding quickly. Tokyo and India will collaborate on global infrastructure development projects in 2022. In countries like Nepal, where both countries are already working on projects, joint planning, design, and implementation of infrastructure projects might help New Delhi and Tokyo maximize their impact. The demand for LED in the area is anticipated to rise as a result of these developments.
- Electricity demand in the commercial sector tends to be around 11-13 hours. Electricity use in the industrial sector tends not to fluctuate through the day or year. Electricity demand in the residential sector tends to be highest in the evenings, when lights are turned on, and the average lighting time varies for about 6 to 8 hours. Additionally, Cochin Smart Mission Limited (CSML) is preparing an INR 40 crore project to install LED lighting in Kochi, India, to guarantee the security of vehicles and pedestrians in 2022. These programs fuel the expansion of the LED sector.
- Countries in Asia-Pacific have expedited energy savings through the use of LEDs. For instance, the Australian Government decided in January 2018 to introduce minimum LED bulb standards in Australia and New Zealand that comply with EU requirements and phase out inefficient halogen lamps as a way to improve lighting energy efficiency regulation further. The effort will reduce the nation's electricity use and encourage the usage of LED lighting.
Asia Pacific Indoor LED Lighting Industry Overview
The Asia Pacific Indoor LED Lighting Market is fragmented, with the top five companies occupying 26.26%. The major players in this market are EGLO Leuchten GmbH, Nichia Corporation, OPPLE Lighting Co., Ltd, Panasonic Holdings Corporation and Signify (Philips) (sorted alphabetically).
Additional Benefits:
- The market estimate (ME) sheet in Excel format
- 3 months of analyst support
TABLE OF CONTENTS
1 EXECUTIVE SUMMARY & KEY FINDINGS
2 REPORT OFFERS
3 INTRODUCTION
- 3.1 Study Assumptions & Market Definition
- 3.2 Scope of the Study
- 3.3 Research Methodology
4 KEY INDUSTRY TRENDS
- 4.1 Population
- 4.2 Per Capita Income
- 4.3 Total Import Of Leds
- 4.4 Lighting Electricity Consumption
- 4.5 # Of Households
- 4.6 Led Penetration
- 4.7 Horticulture Area
- 4.8 Regulatory Framework
- 4.8.1 China
- 4.8.2 India
- 4.8.3 Japan
- 4.9 Value Chain & Distribution Channel Analysis
5 MARKET SEGMENTATION (includes market size in Value in USD and Volume, Forecasts up to 2030 and analysis of growth prospects)
- 5.1 Indoor Lighting
- 5.1.1 Agricultural Lighting
- 5.1.2 Commercial
- 5.1.2.1 Office
- 5.1.2.2 Retail
- 5.1.2.3 Others
- 5.1.3 Industrial and Warehouse
- 5.1.4 Residential
- 5.2 Country
- 5.2.1 China
- 5.2.2 India
- 5.2.3 Japan
- 5.2.4 Rest of Asia-Pacific
6 COMPETITIVE LANDSCAPE
- 6.1 Key Strategic Moves
- 6.2 Market Share Analysis
- 6.3 Company Landscape
- 6.4 Company Profiles (includes Global level Overview, Market level overview, Core Business Segments, Financials, Headcount, Key Information, Market Rank, Market Share, Products and Services, and analysis of Recent Developments)
- 6.4.1 ACUITY BRANDS, INC.
- 6.4.2 ams-OSRAM AG
- 6.4.3 EGLO Leuchten GmbH
- 6.4.4 Endo Lighting Corporation
- 6.4.5 Guangdong PAK Corporation Co.,Ltd.
- 6.4.6 Nichia Corporation
- 6.4.7 OPPLE Lighting Co., Ltd
- 6.4.8 Panasonic Holdings Corporation
- 6.4.9 Signify (Philips)
- 6.4.10 Toshiba Corporation
7 KEY STRATEGIC QUESTIONS FOR LED CEOS
8 APPENDIX
- 8.1 Global Overview
- 8.1.1 Overview
- 8.1.2 Porter's Five Forces Framework
- 8.1.3 Global Value Chain Analysis
- 8.1.4 Market Dynamics (DROs)
- 8.2 Sources & References
- 8.3 List of Tables & Figures
- 8.4 Primary Insights
- 8.5 Data Pack
- 8.6 Glossary of Terms
 可调光LED轨道灯具市场按类型、光源、安装方式、功率、应用和最终用户划分-全球预测,2026-2032年
 中东和非洲室内 LED 照明:市场占有率分析、行业趋势和统计、成长预测(2025-2030 年)中国室内 LED 照明:市场占有率分析、产业趋势与统计、成长预测(2025-2030 年)北美室内 LED 照明:市场占有率分析、行业趋势和统计、成长预测(2025-2030 年)南美室内 LED 照明:市场占有率分析、行业趋势和统计、成长预测(2025-2030 年)印度室内 LED 照明:市场占有率分析、行业趋势和统计、成长预测(2025-2030 年)室内 LED 照明:市场占有率分析、行业趋势和统计、成长预测(2025-2030 年)德国室内 LED 照明:市场占有率分析、行业趋势和统计、成长预测(2025-2030 年)日本室内 LED 照明:市场占有率分析、行业趋势和统计、成长预测(2025-2030 年)欧洲室内 LED 照明:市场占有率分析、行业趋势和统计、成长预测(2025-2030 年)