


 |
市场调查报告书
商品编码
1685747
资料中心 -市场占有率分析、产业趋势与统计、成长预测(2025-2030)Data Center - Market Share Analysis, Industry Trends & Statistics, Growth Forecasts (2025 - 2030) |
||||||
※ 本网页内容可能与最新版本有所差异。详细情况请与我们联繫。
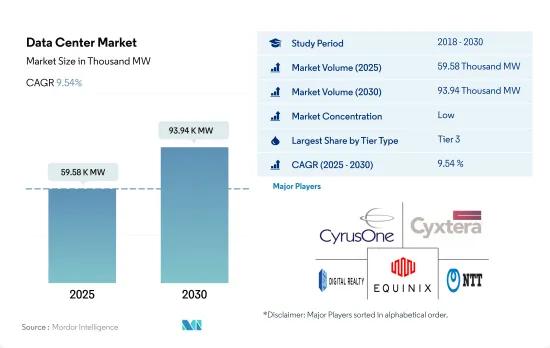
预计 2025 年资料中心市场规模为 59,580 兆瓦,到 2030 年将达到 93,940 兆瓦,复合年增长率为 9.54%。
此外,预计 2025 年主机託管收益将达到 696.325 亿美元,2030 年将达到 1326.607 亿美元,预测期内(2025-2030 年)的复合年增长率为 13.76%。
2023 年, 层级 3资料中心将占据大部分市场占有率,而层级 4 资料中心预计在预测期内成长最快
- 目前,层级市场占了大部分。这些层的运转率约为 99.982%,每年停机时间为 1.6 小时。由于边缘和云端连接的日益普及,预计未来层级 3 部分将进一步成长。
- 预计2022年IT负载容量为6,857.78MW,其中欧洲占比最大。英国拥有最多的层级 3资料中心,其中斯劳和大伦敦占据了最大份额。都柏林是爱尔兰唯一一个拥有超过 98% 的层级 3 设施的地区,其中北都柏林和南都柏林占据了最大份额。预计欧洲层级 3 部分将从 2023 年的 7,979.69 兆瓦成长到 2029 年的 12,110.18 兆瓦,复合年增长率为 7.20%。
- 在预计预测期内, 层级 4 部分的复合年增长率将达到 16.2%。各个已开发国家都致力于采用层级 4 认证,以获得所有组件完全容错和冗余的好处。因此,许多开发区也采用了层级区域。在美国,可再生占能源结构的20%以上,预计2030年将达到50%。大多数正在开发的资料中心设施都在增加其IT能力。
- 层级 1 和 Tier 2 部分的成长最少,因为超过 70% 的流量都在伺服器之间移动。现代应用程式需要更多的资料在资料中心内以更快的速度传输,并且对延迟更加敏感。预计层级和二级资料中心的成长将非常小,因此这种成长可能来自为 IT 负载层级的中小型企业提供服务的设施。
北美将占很大份额,预计亚太地区在研究期间成长最快
- 资料中心市场主要集中在北美、欧洲和亚太地区。北维吉尼亚是美国最大的资料中心热点地区,2022年占全美装置容量资料中心容量的13.07%以上。然而,由于市场已经成熟,预计到2029年其市场占有率将会下降。维吉尼亚对符合法定投资和就业要求的资料中心购买的合格电脑设备提供零售销售税和使用税豁免。维吉尼亚州是第一个允许主机託管资料中心租户享受销售税豁免的州。维吉尼亚也受益于密集部署的光纤主干网路。维吉尼亚海滩是四条新的跨洋光纤互连电缆的登陆点。
- 在欧洲,市场集中在法兰克福、伦敦/斯隆、阿姆斯特丹、巴黎和都柏林等FLAP-D大都会市场。伦敦的土地价格约为每平方英尺 150 美元。预计伦敦的高地价将推动投资流向其他地价较低的城市。例如,阿姆斯特丹在 FLAP资料中心市场建设设施的土地价格较低,为每平方英尺 38 美元。
- 在亚太地区,澳洲是资料中心成长显着的国家之一。该国高度重视可再生能源,并且是资料中心的主要枢纽。雪梨目前 100% 使用可再生能源,这些能源来自新南威尔斯州的风能和太阳能发电场。在墨尔本,维多利亚州政府已拨出9,500万美元,用于支持该地区人工智慧Start-Ups的发展。随着技术开发基地的增加,资料中心的需求预计将大幅增加。
全球资料中心市场趋势
资料消费量的增加、智慧服务、社交网路、无现金付款和智慧家庭自动化服务等数位化应用数量的增加正在推动市场成长。
- 全球资料消费量将从2016年的1.8GB/月成长至2022年的7.6GB/月,预计2029年将达到26GB/月。智慧服务、社交网路、无现金付款、智慧家庭自动化服务等新兴数位化应用正在推动全球资料消费。中国和美国等一些国家已经推出了6G,而其他一些国家仍处于5G阶段。
- 然而,非洲的部署速度较慢,计划先加强 4G 服务,然后再推出 5G。 Netflix、Disney+ 和 Amazon Prime 等线上串流服务的需求不断增长,正在推高用户资料消耗。每部智慧型手机的资料消费量将从 2016 年的每月 1.8GB 成长到 2023 年的每月 9.1GB,到 2029 年可能达到每月 26GB。
- 预计预测期内全球资料消费量将进一步成长,达19.2%。资料消费量的主要地区为非洲、北美和中东,分别占25.8%、24.6%和23.9%。由于频宽更快、数位化服务和物联网平台的日益普及而导致的资料消耗不断增加,可能会推动全球对资料中心的需求。
网路购物、社交网路、计程车预订、数位交易、食品订购等数位化服务的扩展预计将推动市场需求。
- 预计2022年世界人口将达79.1亿,其中网路用户49.5亿,活跃社群媒体用户46.2亿。平均而言,全球用户每天上网时间约六小时。预计预测期内(2023-2029 年)使用者数量的复合年增长率将达到 4.6%。网路购物、社交网路、计程车预订、数位交易和食品订购等数位化服务的扩展预计将导致资料消费量的增加。预测期内资料消费量预计将成长 18.6%。网路使用者占比超过90%的地区包括北美、北欧、西欧。
- 然而,亚太地区在智慧型手机用户数量方面领先全球。预计 2022 年智慧型手机用户数量将达到 26.47 亿,到 2029 年可能达到 44.56 亿。预测期内,该地区智慧型手机用户数量的复合年增长率预计将达到 7.5%。 5G的引入使该地区的用户能够存取多种数位化服务。
- 阿拉伯联合大公国、韩国、中国和荷兰在全球处于领先地位,网路速度分别为 136.4 Mbps、106.9 Mbps、96.3 Mbps 和 94.9 Mbps。预计未来通讯和智慧型设备领域先进技术的引入以及使用数位化服务的人数增加将推动全球资料中心市场的成长。
资料中心产业概览
资料中心市场较为分散,前五大公司占19.69%的市占率。市场的主要企业有:CyrusOne Inc.、Cyxtera Technologies、Digital Realty Trust Inc.、Equinix Inc. 和 NTT Ltd.。
其他福利
- Excel 格式的市场预测 (ME) 表
- 3个月的分析师支持
目录
第一章执行摘要和主要发现
第二章 报告要约
第三章 引言
- 研究假设和市场定义
- 研究范围
- 调查方法
第四章 市场展望
- 负载能力
- 占地面积
- 主机代管收入
- 安装的机架数量
- 机架空间利用率
- 海底电缆
第五章 产业主要趋势
- 智慧型手机用户数量
- 每部智慧型手机的资料流量
- 行动资料速度
- 宽频资料速度
- 光纤连接网路
- 法律规范
- 澳洲
- 奥地利
- 比利时
- 巴西
- 加拿大
- 智利
- 中国
- 丹麦
- 法国
- 德国
- 香港
- 印度
- 印尼
- 爱尔兰
- 以色列
- 义大利
- 日本
- 马来西亚
- 墨西哥
- 荷兰
- 纽西兰
- 奈及利亚
- 挪威
- 菲律宾
- 波兰
- 俄罗斯
- 沙乌地阿拉伯
- 新加坡
- 南非
- 韩国
- 西班牙
- 瑞典
- 瑞士
- 台湾
- 泰国
- 阿拉伯聯合大公国
- 英国
- 美国
- 越南
- 价值炼和通路分析
第六章市场区隔
- 资料中心规模
- 大规模
- 大规模
- 中等规模
- 百万
- 小规模
- 层级类型
- 1层级和2级
- 层级
- 层级
- 吸收量
- 未使用
- 使用
- 按主机託管类型
- 超大规模
- 零售
- 批发的
- 按最终用户
- BFSI
- 云
- 电子商务
- 政府
- 製造业
- 媒体与娱乐
- 电信
- 其他最终用户
- 地区
- APAC
- 非洲
- 欧洲
- 中东
- 北美洲
- 南美洲
第七章竞争格局
- 市场占有率分析
- 商业状况
- 公司简介.
- AirTrunk Operating Pty Ltd
- Chindata Group Holdings Ltd
- CyrusOne Inc.
- Cyxtera Technologies
- Digital Realty Trust Inc.
- Equinix Inc.
- Flexential Corp.
- NTT Ltd
- Quality Technology Services
- Space DC Pte Ltd
- Switch
- Vantage Data Centers LLC
- LIST OF COMPANIES STUDIED
第八章:CEO面临的关键策略问题
第九章 附录
- 世界概况
- 概述
- 五力分析框架
- 全球价值链分析
- 全球市场规模和DRO
- 资讯来源及延伸阅读
- 图表清单
- 关键见解
- 资料包
- 词彙表
The Data Center Market size is estimated at 59.58 thousand MW in 2025, and is expected to reach 93.94 thousand MW by 2030, growing at a CAGR of 9.54%. Further, the market is expected to generate colocation revenue of USD 69,632.5 Million in 2025 and is projected to reach USD 132,660.7 Million by 2030, growing at a CAGR of 13.76% during the forecast period (2025-2030).
Tier 3 data centers accounted for majority market share in 2023, and the Tier 4 segment is expected to be the fastest growing during the forecast period
- The tier 3 segment currently holds a major share of the market. These tiers have an uptime of around 99.982%, translating into a downtime of 1.6 hours per year. With the increasing adoption of edge and cloud connectivity, the tier 3 segment is expected to grow further in the future.
- Europe held a leading market share, with a 6,857.78 MW IT load capacity in 2022. The United Kingdom hosts the maximum number of tier 3 data centers, with Slough and Greater London holding a major share. In Ireland, Dublin is the only region that hosts more than 98% of the tier 3 facilities, with North and South Dublin holding a major share. The tier 3 segment in Europe is expected to grow from 7,979.69 MW in 2023 to 12,110.18 MW in 2029, at a CAGR of 7.20%.
- The tier 4 segment is expected to record a CAGR of 16.2% during the forecast period. Various developed countries are focusing on adopting a Tier 4 certification to get the advantage of complete fault tolerance and redundancy for every component. Therefore, many developing regions are also adopting the tier 4 zone. In the United States, over 20% of the energy mix is contributed by renewable energy, which is expected to reach 50% by 2030. The majority of data center facilities under development are adding more IT power.
- The tier 1 & 2 segment had the least growth as more than 70% of all traffic moves from server to server. Modern applications require significantly more data to travel within a data center at faster speeds and are more particular about latency. Since tier 1 & 2 data centers are projected to witness minimal growth, such growth is only expected from facilities that cater to SMEs with a minimal IT load.
North America holds the major share and APAC is expected to be the fastest growing during the study period
- The data center market has been largely concentrated in North America, Europe, and Asia-Pacific. Northern Virginia is the largest data center hotspot in the United States, accounting for over 13.07% of the data center installed capacity in 2022. However, the future market share is expected to reflect a decreasing trend until 2029, as the market has already reached maturity. Virginia offers an exemption from retail sales and uses tax for qualifying computer equipment purchased by data centers that meet statutory investment and employment requirements. Virginia was the first state to allow the tenants of colocation data centers to receive the benefits of sales tax exemption. Virginia also benefits from densely packed fiber backbones. Virginia Beach is the landing point for four new transoceanic fiber connection cables.
- In Europe, the market is concentrated in FLAP-D metro markets, including Frankfurt, London/Slough, Amsterdam, Paris, and Dublin. The land price in London is around USD 150 per sq. ft. Higher land costs in London are expected to shift investments to other cities with lower land prices. For instance, Amsterdam has a lower land price for building facilities in the FLAP data center market, which is USD 38 per sq. ft.
- In Asia-Pacific, Australia is one of the prominent countries in terms of the growth of data centers. The country is a major hub for data centers due to its focus on renewable energy. Sydney is now powered using 100% renewable electricity generated from wind and solar farms in regional NSW. In Melbourne, the Victorian government has also set aside USD 95 million to support AI startup development in the region. With increasing technology development hubs, the demand for data centers is expected to increase significantly.
Global Data Center Market Trends
Rising data consumption, growing number of digitalization applications, such as smart services, social networking, cashless payments, smart home automation services, and other applications drive the market's growth
- Global data consumption increased from 1.8 GB/month in 2016 to 7.6 GB/month in 2022. It is estimated to reach 26 GB/month by 2029. The growing number of digitalization applications, such as smart services, social networking, cashless payments, smart home automation services, and others, has boosted data consumption globally. A few countries, such as China and the United States, have already implemented 6G, while multiple countries are still implementing phases of 5G.
- However, in Africa, the deployment has been slow as the region plans to strengthen its 4G services first and then roll out 5G. The growing demand for online streaming services such as Netflix, Disney+, and Amazon Prime is boosting the consumption of data among users. The data consumed per smartphone increased from 1.8 GB/month in 2016 to 9.1 GB/month in 2023, which may reach 26 GB/month by 2029.
- Global data consumption is expected to grow further during the forecast period, reaching 19.2%. The leading regions in terms of data consumption are Africa, North America, and the Middle East, with 25.8%, 24.6%, and 23.9%, respectively. The increasing data consumption due to high bandwidth speeds and the growing adoption of digitalization services and IoT platforms may boost the demand for data centers globally.
Growing digitalization services such as online shopping, social networking, cab booking, digital transactions, food orders, and other services are expected to drive the market demand
- The global population was estimated at 7.91 billion in 2022, with 4.95 billion internet users and 4.62 billion active social media users. On average, global users spend around 6 hours using the internet daily. The number of users is expected to record a CAGR of 4.6% during the forecast period (2023-2029). Growing digitalization services such as online shopping, social networking, cab booking, digital transactions, food orders, and other services are expected to increase data consumption. The data consumption is expected to grow by 18.6% during the forecast period. The regions with more than 90% internet users include North America and Northern and Western Europe.
- However, Asia-Pacific leads globally in terms of the number of smartphone users. The number of smartphone users was estimated at 2,647 million in 2022, which may reach 4,456 million by 2029. The region is estimated to record a CAGR of 7.5% in terms of the number of smartphone users during the forecast period. The deployment of 5G has helped users gain access to multiple digitalization services in the region.
- The United Arab Emirates, South Korea, China, and the Netherlands are the leading countries globally, with internet speeds of 136.4 Mbps, 106.9 Mbps, 96.3 Mbps, and 94.9 Mbps, respectively. The implementation of advanced technologies in telecommunication and smart devices and the growing number of people using digitalization services are expected to drive the growth of the global data center market in the future.
Data Center Industry Overview
The Data Center Market is fragmented, with the top five companies occupying 19.69%. The major players in this market are CyrusOne Inc., Cyxtera Technologies, Digital Realty Trust Inc., Equinix Inc. and NTT Ltd (sorted alphabetically).
Additional Benefits:
- The market estimate (ME) sheet in Excel format
- 3 months of analyst support
TABLE OF CONTENTS
1 EXECUTIVE SUMMARY & KEY FINDINGS
2 REPORT OFFERS
3 INTRODUCTION
- 3.1 Study Assumptions & Market Definition
- 3.2 Scope of the Study
- 3.3 Research Methodology
4 MARKET OUTLOOK
- 4.1 It Load Capacity
- 4.2 Raised Floor Space
- 4.3 Colocation Revenue
- 4.4 Installed Racks
- 4.5 Rack Space Utilization
- 4.6 Submarine Cable
5 Key Industry Trends
- 5.1 Smartphone Users
- 5.2 Data Traffic Per Smartphone
- 5.3 Mobile Data Speed
- 5.4 Broadband Data Speed
- 5.5 Fiber Connectivity Network
- 5.6 Regulatory Framework
- 5.6.1 Australia
- 5.6.2 Austria
- 5.6.3 Belgium
- 5.6.4 Brazil
- 5.6.5 Canada
- 5.6.6 Chile
- 5.6.7 China
- 5.6.8 Denmark
- 5.6.9 France
- 5.6.10 Germany
- 5.6.11 Hong Kong
- 5.6.12 India
- 5.6.13 Indonesia
- 5.6.14 Ireland
- 5.6.15 Israel
- 5.6.16 Italy
- 5.6.17 Japan
- 5.6.18 Malaysia
- 5.6.19 Mexico
- 5.6.20 Netherlands
- 5.6.21 New Zealand
- 5.6.22 Nigeria
- 5.6.23 Norway
- 5.6.24 Philippines
- 5.6.25 Poland
- 5.6.26 Russia
- 5.6.27 Saudi Arabia
- 5.6.28 Singapore
- 5.6.29 South Africa
- 5.6.30 South Korea
- 5.6.31 Spain
- 5.6.32 Sweden
- 5.6.33 Switzerland
- 5.6.34 Taiwan
- 5.6.35 Thailand
- 5.6.36 United Arab Emirates
- 5.6.37 United Kingdom
- 5.6.38 United States
- 5.6.39 Vietnam
- 5.7 Value Chain & Distribution Channel Analysis
6 MARKET SEGMENTATION (INCLUDES MARKET SIZE IN VOLUME, FORECASTS UP TO 2030 AND ANALYSIS OF GROWTH PROSPECTS)
- 6.1 Data Center Size
- 6.1.1 Large
- 6.1.2 Massive
- 6.1.3 Medium
- 6.1.4 Mega
- 6.1.5 Small
- 6.2 Tier Type
- 6.2.1 Tier 1 and 2
- 6.2.2 Tier 3
- 6.2.3 Tier 4
- 6.3 Absorption
- 6.3.1 Non-Utilized
- 6.3.2 Utilized
- 6.3.2.1 By Colocation Type
- 6.3.2.1.1 Hyperscale
- 6.3.2.1.2 Retail
- 6.3.2.1.3 Wholesale
- 6.3.2.2 By End User
- 6.3.2.2.1 BFSI
- 6.3.2.2.2 Cloud
- 6.3.2.2.3 E-Commerce
- 6.3.2.2.4 Government
- 6.3.2.2.5 Manufacturing
- 6.3.2.2.6 Media & Entertainment
- 6.3.2.2.7 Telecom
- 6.3.2.2.8 Other End User
- 6.4 Region
- 6.4.1 APAC
- 6.4.2 Africa
- 6.4.3 Europe
- 6.4.4 Middle East
- 6.4.5 North America
- 6.4.6 South America
7 COMPETITIVE LANDSCAPE
- 7.1 Market Share Analysis
- 7.2 Company Landscape
- 7.3 Company Profiles (includes Global Level Overview, Market Level Overview, Core Business Segments, Financials, Headcount, Key Information, Market Rank, Market Share, Products and Services, and Analysis of Recent Developments).
- 7.3.1 AirTrunk Operating Pty Ltd
- 7.3.2 Chindata Group Holdings Ltd
- 7.3.3 CyrusOne Inc.
- 7.3.4 Cyxtera Technologies
- 7.3.5 Digital Realty Trust Inc.
- 7.3.6 Equinix Inc.
- 7.3.7 Flexential Corp.
- 7.3.8 NTT Ltd
- 7.3.9 Quality Technology Services
- 7.3.10 Space DC Pte Ltd
- 7.3.11 Switch
- 7.3.12 Vantage Data Centers LLC
- 7.4 LIST OF COMPANIES STUDIED
8 KEY STRATEGIC QUESTIONS FOR DATA CENTER CEOS
9 APPENDIX
- 9.1 Global Overview
- 9.1.1 Overview
- 9.1.2 Porter's Five Forces Framework
- 9.1.3 Global Value Chain Analysis
- 9.1.4 Global Market Size and DROs
- 9.2 Sources & References
- 9.3 List of Tables & Figures
- 9.4 Primary Insights
- 9.5 Data Pack
- 9.6 Glossary of Terms
 资料中心能源概况 - Oracle:自 2019 年以来,能源使用量以 24% 的复合年增长率成长,由于可再生能源的使用,排放保持稳定,但 Stargate 专案可能会大幅增加碳足迹。
 氢动力资料中心市场分析及预测(至2035年):类型、产品类型、服务、技术、组件、应用、部署模式、最终用户、功能、安装模式资料中心市场分析及预测(至2035年):类型、产品类型、服务、技术、组件、应用、部署模式、最终用户、解决方案
 2026年全球配置自动化市场报告2026年全球资料中心市场报告
 在轨资料中心:趋势与分析太空资料中心:趋势与分析
 资料中心市场报告:按组件、类型、企业规模、最终用户和地区划分(2026-2034 年)
 2026-2030年全球资料中心维护与支援服务市场小型资料中心市场分析及预测(至2035年):依类型、产品类型、服务、技术、元件、应用、部署类型、最终使用者、模组及功能划分