


 |
市场调查报告书
商品编码
1686626
生物肥料:市场占有率分析、产业趋势与统计、成长预测(2025-2030)Biofertilizer - Market Share Analysis, Industry Trends & Statistics, Growth Forecasts (2025 - 2030) |
||||||
※ 本网页内容可能与最新版本有所差异。详细情况请与我们联繫。
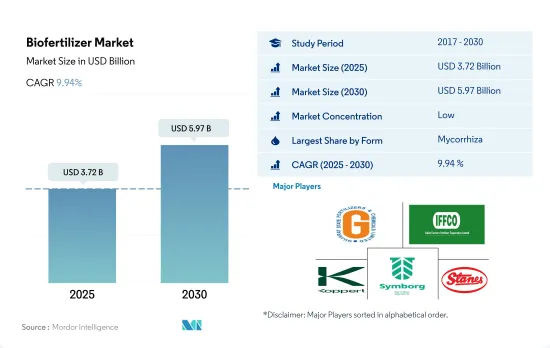
生物肥料市场规模预计在 2025 年将达到 37.2 亿美元,预计到 2030 年将达到 59.7 亿美元,预测期内(2025-2030 年)的复合年增长率为 9.94%。
- 生物肥料是活的微生物,可以透过调动或增加土壤中的养分供应来增强植物营养。农业中用作生物肥料最常见的微生物是菌根真菌、固氮螺菌、固氮菌、根瘤菌和解磷细菌。
- 其中,菌根真菌是世界上消耗量最大的生物肥料。 2022 年,它占据生物肥料领域的 36.7%,市值为 10.4 亿美元,产量为 170,600 吨。菌根真菌增加植物根部的表面积,增强养分的吸收。
- 根瘤菌是世界上消费量第二大的生物肥料。 2022年,它占生物肥料领域的24.2%。北美在根瘤菌子区隔中占据主导地位,当年的市场占有率为 52.1%。耕地作物在北美根瘤菌子区隔占主导地位,2022 年占 62.4%。根瘤菌与作物(一种连续作物)具有共生关係。因此,在根瘤菌子区隔中,连作作物占主导地位。在北美,也有大面积的土地种植连续作物。预计北美连续作物市场中的根瘤菌子区隔在预测期内的复合年增长率将达到 10.5%。
- 固氮螺菌占生物肥料领域的16.3%。北美在固氮螺菌子区隔中占据主导地位,2022 年占 45.7%。
- 因此,随着越来越多的农民寻求永续和环保的解决方案来提高作物产量和土壤健康,全球农业生物製药市场中的生物肥料部分预计将在未来几年内增长。
- 生物肥料是活的微生物,能够透过调动或增加土壤中的养分来增强植物营养。北美和欧洲是全球生物肥料的主要消费地区。
- 2022 年,北美占全球生物肥料市场的 34.5%。该地区有机作物种植面积在过去一段时间增加了 13.5%,从 2017 年的 140 万公顷增加到 2021 年的 160 万公顷。该地区对有机食品的需求正在迅速增长,2021 年北美人均有机食品支出为 109.7 美元。
- 2022年欧洲地区将占30.7%,成为第二大生物肥料消费国。欧洲是世界上有机农业面积最大的地区,2021年达650万公顷。欧盟委员会宣布了一项行动计划,到2030年将成员国的有机农业面积提高到该地区农业用地面积的25.0%。预计这将进一步推动该地区的生物肥料市场。
- 亚太地区是水稻、甘蔗、水果和蔬菜等有机作物的主要生产地。中国和印度是新的领导者,但有机农业仅占农业总面积的一小部分。 2017年至2021年,该地区的有机农业面积正在增加,预计这一趋势将推动生物肥料市场的成长。
- 全球有机作物作物面积的增加,尤其是欧洲和北美等地区,以及对有机商品的需求的增加,可能会在预测期内推动对生物肥料的需求。
全球生物肥料市场趋势
在北美和欧洲,由于人们意识的增强和政府的推动,有机生产达到了历史最高水准。
- 有机农业已成为永续粮食系统的主要贡献者,并在全球 187 个国家/地区实践。截至2021年,全球有机农地面积为7,230万公顷,2018年至2021年间各地区平均成长2.9%。有机耕地面积为1,440万公顷,占有机农地总面积的19.9%。
- 有机农业最强大的市场是北美和欧洲,这两个地区占世界有机耕地面积的41.0%。至2022年,欧洲有机耕地面积将达到650万公顷,相当于全球有机耕地总面积的44.1%。北美和欧洲最重要的有机种植作物是苹果、草莓、谷物和橄榄。
- 亚太地区的新兴国家也加入了有机农业运动,并在生产和供应新鲜有机农产品方面实现自给自足,以满足国内需求。有机农业趋势在亚太地区日益兴起,2017年至2022年间,该地区有机土地面积将增加18.8%。该地区政府的主要措施也在有机农业扩张趋势中发挥了关键作用。例如,日本的《食品、农业和农村基本计画》的目标是到2030年将有机农场和有机农地的数量增加两倍。
- 有机农业的成长得益于人们对其益处的认识不断提高,例如促进土壤健康、减少环境影响和生产更健康的食品。
人均有机食品支出的成长主要出现在美国和德国,这是由消费者对更健康、更永续食品的需求所推动的。
- 过去几年,有机食品市场经历了显着成长,全球销售额预计将从 2012 年的 708 亿美元成长到 2020 年的 1,206 亿美元。有机食品的流行趋势受到多种因素的推动,包括消费者对更健康、更永续的食品选择的需求不断增长,以及对传统农业对环境影响的认识不断提高。预计未来几年全球有机食品市场将持续维持成长趋势。
- 根据有机贸易协会 2021 年的一项调查,当年有机水果和蔬菜的销售量成长了约 4.5%,占有机产品总销量的 15%。北美在有机产品平均支出方面占据市场主导地位,2021年美国的人均有机产品支出达到186.7美元,是北美国家中最高的。预计欧洲有机食品市场也将强劲成长,其中德国 2021 年人均有机食品支出最高,为 75.6 美元。
- 有机食品市场仍由消费者可支配收入较高的已开发国家主导,但预计新兴国家的有机食品市场也将成长。例如,亚太地区的工人阶级不断壮大,这使得有机食品更容易取得且更便宜,有助于扩大市场。
生物肥料产业概况
生物肥料市场较为分散,前五大公司占21.14%。市场的主要企业有:古吉拉特邦化肥与化学品有限公司、印度农民化肥合作社有限公司、Koppert Biological Systems Inc.、Symborg Inc. 和 T. Stanes and Company Limited(按字母顺序排列)。
其他福利
- Excel 格式的市场预测 (ME) 表
- 3个月的分析师支持
目录
第一章执行摘要和主要发现
第二章 报告要约
第三章 引言
- 研究假设和市场定义
- 研究范围
- 调查方法
第四章 产业主要趋势
- 有机种植区
- 有机产品人均支出
- 法律规范
- 阿根廷
- 澳洲
- 巴西
- 加拿大
- 中国
- 埃及
- 法国
- 德国
- 印度
- 印尼
- 伊朗
- 义大利
- 日本
- 墨西哥
- 荷兰
- 奈及利亚
- 菲律宾
- 俄罗斯
- 南非
- 西班牙
- 泰国
- 土耳其
- 英国
- 美国
- 越南
- 价值炼和通路分析
第五章市场区隔
- 形式
- 固氮螺菌
- 固氮菌
- 菌根真菌
- 解磷细菌
- 根瘤菌
- 其他生物肥料
- 作物类型
- 经济作物
- 园艺作物
- 田间作物
- 地区
- 非洲
- 按国家
- 埃及
- 奈及利亚
- 南非
- 其他非洲国家
- 亚太地区
- 按国家
- 澳洲
- 中国
- 印度
- 印尼
- 日本
- 菲律宾
- 泰国
- 越南
- 其他亚太地区
- 欧洲
- 按国家
- 法国
- 德国
- 义大利
- 荷兰
- 俄罗斯
- 西班牙
- 土耳其
- 英国
- 其他欧洲国家
- 中东
- 按国家
- 伊朗
- 沙乌地阿拉伯
- 其他中东地区
- 北美洲
- 按国家
- 加拿大
- 墨西哥
- 美国
- 北美其他地区
- 南美洲
- 按国家
- 阿根廷
- 巴西
- 南美洲其他地区
- 非洲
第六章 竞争格局
- 关键策略趋势
- 市场占有率分析
- 商业状况
- 公司简介.
- Andermatt Group AG
- Atlantica Agricola
- Binzhou Jingyang Biological Fertilizer Co. Ltd
- Biostadt India Limited
- Ficosterra
- Gujarat State Fertilizers & Chemicals Ltd
- Indian Farmers Fertiliser Cooperative Limited
- Indogulf BioAg LLC(Biotech Division of Indogulf Company)
- IPL Biologicals Limited
- Kiwa Bio-Tech
- Koppert Biological Systems Inc.
- Microbial Biological Fertilizers International
- Sustane Natural Fertilizer Inc.
- Symborg Inc.
- T.Stanes and Company Limited
第七章:CEO面临的关键策略问题
第 8 章 附录
- 世界概况
- 概述
- 五力分析框架
- 全球价值链分析
- 市场动态(DRO)
- 资讯来源及延伸阅读
- 图片列表
- 关键见解
- 资料包
- 词彙表
The Biofertilizer Market size is estimated at 3.72 billion USD in 2025, and is expected to reach 5.97 billion USD by 2030, growing at a CAGR of 9.94% during the forecast period (2025-2030).
- Biofertilizers are living microorganisms that can enhance plant nutrition by either mobilizing or increasing nutrient availability in soils. The most common microorganisms used as biofertilizers in agriculture include mycorrhiza, Azospirillum, Azotobacter, Rhizobium, and phosphate-solubilizing bacteria.
- Among these, mycorrhiza is the most consumed biofertilizer globally. It accounted for 36.7% of the biofertilizer segment in 2022, with a market value of USD 1.04 billion and a volume of 170.6 thousand metric tons. Mycorrhiza increases the root surface area of plants, thus enhancing their nutrient uptake.
- Rhizobium is the second most consumed biofertilizer globally. It accounted for 24.2% of the biofertilizer segment in 2022. North America dominated the rhizobium sub-segment with a market share of 52.1% in the same year. Row crops dominated the rhizobium sub-segment in North America, accounting for 62.4% in 2022. Rhizobium has a symbiotic association with leguminous crops, a category of row crops. Thus, row crops dominated the rhizobium sub-segment. North America also has a large cultivation area of row crops. The rhizobium sub-segment in the North American row crops market is anticipated to record a CAGR of 10.5% during the forecast period.
- Azospirillum accounted for 16.3% of the biofertilizer segment. North America dominated the Azospirillum sub-segment, accounting for 45.7% in 2022.
- Thus, the biofertilizer segment of the global agricultural biologicals market is expected to grow in the coming years as more farmers seek sustainable and eco-friendly solutions to improve crop yields and soil health.
- Biofertilizers are living microorganisms that have the ability to enhance plant nutrition by either mobilizing or increasing nutrient availability in soils. North America and Europe are the major consumers of biofertilizers in the world.
- North America accounted for 34.5% of the global biofertilizer market in 2022. The area under cultivation of organic crops in the region increased by 13.5% during the historical period, from 1.4 million hectares in 2017 to 1.6 million hectares in 2021. The demand for organic food in the region is growing rapidly, with an average per capita spending on organic food products in North America at USD 109.7 in 2021.
- The European region accounted for 30.7% in 2022 and stood as the second-largest consumer of biofertilizers. Europe had the largest area under organic farming in the world, with 6.5 million hectares in 2021. The European Commission has unveiled an action plan to increase the organic area in the member countries to occupy 25.0% of the region's agricultural land area by 2030. This factor is further expected to drive the market for biofertilizers in the region.
- The Asia-Pacific region is a leading producer of organic crops such as rice, sugarcane, and fruits and vegetables. China and India are emerging leaders, although organic farming only accounts for a small portion of their total agricultural area. The organic farming area in the region grew from 2017 to 2021, and this trend is expected to drive growth in the biofertilizer market.
- The increasing organic crop area and increasing demand for organic commodities across the world, particularly in regions like Europe and North America, may drive the demand for biofertilizers during the forecast period.
Global Biofertilizer Market Trends
Organic production is at an all-time high in North America and Europe, due to the increasing awareness and Government initiatives.
- Organic agriculture has emerged as a significant contributor to sustainable food systems, with 187 countries practicing it globally. As of 2021, there was 72.3 million ha of organic agricultural land worldwide, with an average increase of 2.9% across all regions from 2018 to 2021. Organic arable land accounted for 14.4 million ha, representing 19.9% of the total organic agricultural land.
- The strongest markets for organic farming are North America and Europe, accounting for 41.0% of the global organic arable land. In 2022, Europe had 6.5 million ha of organic arable land, equivalent to 44.1% of the overall organic arable agricultural area. The most significant crops grown organically in North America and Europe are apples, strawberries, cereals, and olives.
- Developing countries in Asia-Pacific are also joining the organic agriculture movement and becoming self-sufficient in producing and providing fresh organic produce to meet their domestic demand. The trend of organic farming is gaining momentum in Asia-Pacific, with the region recording an 18.8% increase in organic arable land from 2017 to 2022. The major initiatives by governments in the region also play a vital role in the growing trend of organic farming. For example, Japan's Basic Plan for Food, Agriculture, and Rural Areas aims to triple the number of organic farmers and lands by 2030.
- The growth of organic agriculture is driven by the rising awareness of the benefits of organic farming, such as promoting soil health, reducing environmental impacts, and producing healthier food.
Per capita spending of organic food majorly observed in United States and Germany, attributed to the consumer demand for healthier and sustainable food
- The organic food market experienced significant growth in the past few years, with global sales reaching USD 120.6 billion in 2020, up from USD 70.8 billion in 2012. The trend toward organic food is being driven by several factors, such as increasing consumer demand for healthier, more sustainable food options and a growing awareness of the environmental impact of conventional agriculture. The global organic food market is expected to continue its growth trend over the coming years.
- According to a survey conducted by the Organic Trade Association in 2021, sales of organic fruits and vegetables increased by around 4.5% in the same year, accounting for 15% of the overall organic sales. North America dominates the market in terms of average spending on organic products, with per capita spending in the United States reaching USD 186.7 in 2021, the highest among all North American countries. Europe is also expected to experience significant growth in the organic food market, with Germany accounting for the highest per capita spending of USD 75.6 in 2021.
- While the organic food market is still dominated by developed countries with high consumer disposable incomes, it is also expected to grow in developing nations. For example, the increasing number of working-class people in the Asia-Pacific region may contribute to the market's expansion due to the growing availability and affordability of organic food products.
Biofertilizer Industry Overview
The Biofertilizer Market is fragmented, with the top five companies occupying 21.14%. The major players in this market are Gujarat State Fertilizers & Chemicals Ltd, Indian Farmers Fertiliser Cooperative Limited, Koppert Biological Systems Inc., Symborg Inc. and T.Stanes and Company Limited (sorted alphabetically).
Additional Benefits:
- The market estimate (ME) sheet in Excel format
- 3 months of analyst support
TABLE OF CONTENTS
1 EXECUTIVE SUMMARY & KEY FINDINGS
2 REPORT OFFERS
3 INTRODUCTION
- 3.1 Study Assumptions & Market Definition
- 3.2 Scope of the Study
- 3.3 Research Methodology
4 KEY INDUSTRY TRENDS
- 4.1 Area Under Organic Cultivation
- 4.2 Per Capita Spending On Organic Products
- 4.3 Regulatory Framework
- 4.3.1 Argentina
- 4.3.2 Australia
- 4.3.3 Brazil
- 4.3.4 Canada
- 4.3.5 China
- 4.3.6 Egypt
- 4.3.7 France
- 4.3.8 Germany
- 4.3.9 India
- 4.3.10 Indonesia
- 4.3.11 Iran
- 4.3.12 Italy
- 4.3.13 Japan
- 4.3.14 Mexico
- 4.3.15 Netherlands
- 4.3.16 Nigeria
- 4.3.17 Philippines
- 4.3.18 Russia
- 4.3.19 South Africa
- 4.3.20 Spain
- 4.3.21 Thailand
- 4.3.22 Turkey
- 4.3.23 United Kingdom
- 4.3.24 United States
- 4.3.25 Vietnam
- 4.4 Value Chain & Distribution Channel Analysis
5 MARKET SEGMENTATION (includes market size in Value in USD and Volume, Forecasts up to 2030 and analysis of growth prospects)
- 5.1 Form
- 5.1.1 Azospirillum
- 5.1.2 Azotobacter
- 5.1.3 Mycorrhiza
- 5.1.4 Phosphate Solubilizing Bacteria
- 5.1.5 Rhizobium
- 5.1.6 Other Biofertilizers
- 5.2 Crop Type
- 5.2.1 Cash Crops
- 5.2.2 Horticultural Crops
- 5.2.3 Row Crops
- 5.3 Region
- 5.3.1 Africa
- 5.3.1.1 By Country
- 5.3.1.1.1 Egypt
- 5.3.1.1.2 Nigeria
- 5.3.1.1.3 South Africa
- 5.3.1.1.4 Rest of Africa
- 5.3.2 Asia-Pacific
- 5.3.2.1 By Country
- 5.3.2.1.1 Australia
- 5.3.2.1.2 China
- 5.3.2.1.3 India
- 5.3.2.1.4 Indonesia
- 5.3.2.1.5 Japan
- 5.3.2.1.6 Philippines
- 5.3.2.1.7 Thailand
- 5.3.2.1.8 Vietnam
- 5.3.2.1.9 Rest of Asia-Pacific
- 5.3.3 Europe
- 5.3.3.1 By Country
- 5.3.3.1.1 France
- 5.3.3.1.2 Germany
- 5.3.3.1.3 Italy
- 5.3.3.1.4 Netherlands
- 5.3.3.1.5 Russia
- 5.3.3.1.6 Spain
- 5.3.3.1.7 Turkey
- 5.3.3.1.8 United Kingdom
- 5.3.3.1.9 Rest of Europe
- 5.3.4 Middle East
- 5.3.4.1 By Country
- 5.3.4.1.1 Iran
- 5.3.4.1.2 Saudi Arabia
- 5.3.4.1.3 Rest of Middle East
- 5.3.5 North America
- 5.3.5.1 By Country
- 5.3.5.1.1 Canada
- 5.3.5.1.2 Mexico
- 5.3.5.1.3 United States
- 5.3.5.1.4 Rest of North America
- 5.3.6 South America
- 5.3.6.1 By Country
- 5.3.6.1.1 Argentina
- 5.3.6.1.2 Brazil
- 5.3.6.1.3 Rest of South America
- 5.3.1 Africa
6 COMPETITIVE LANDSCAPE
- 6.1 Key Strategic Moves
- 6.2 Market Share Analysis
- 6.3 Company Landscape
- 6.4 Company Profiles (includes Global Level Overview, Market Level Overview, Core Business Segments, Financials, Headcount, Key Information, Market Rank, Market Share, Products and Services, and Analysis of Recent Developments).
- 6.4.1 Andermatt Group AG
- 6.4.2 Atlantica Agricola
- 6.4.3 Binzhou Jingyang Biological Fertilizer Co. Ltd
- 6.4.4 Biostadt India Limited
- 6.4.5 Ficosterra
- 6.4.6 Gujarat State Fertilizers & Chemicals Ltd
- 6.4.7 Indian Farmers Fertiliser Cooperative Limited
- 6.4.8 Indogulf BioAg LLC (Biotech Division of Indogulf Company)
- 6.4.9 IPL Biologicals Limited
- 6.4.10 Kiwa Bio-Tech
- 6.4.11 Koppert Biological Systems Inc.
- 6.4.12 Microbial Biological Fertilizers International
- 6.4.13 Sustane Natural Fertilizer Inc.
- 6.4.14 Symborg Inc.
- 6.4.15 T.Stanes and Company Limited
7 KEY STRATEGIC QUESTIONS FOR AGRICULTURAL BIOLOGICALS CEOS
8 APPENDIX
- 8.1 Global Overview
- 8.1.1 Overview
- 8.1.2 Porter's Five Forces Framework
- 8.1.3 Global Value Chain Analysis
- 8.1.4 Market Dynamics (DROs)
- 8.2 Sources & References
- 8.3 List of Tables & Figures
- 8.4 Primary Insights
- 8.5 Data Pack
- 8.6 Glossary of Terms
 生物肥料市场-全球产业规模、份额、趋势、机会和预测,按类型、形态、作物类型、应用、微生物类型、地区和竞争格局划分,2020-2030年预测
 基于固氮菌的生物肥料市场—按产品类型、作物类型、应用方法、分销管道、最终用户和配方类型划分—2025-2032年全球预测生物肥料市场按类型、形态、应用方法、作物类型和分销管道划分-2025-2032年全球预测
 2032年生物肥料市场预测:按产品类型、微生物、作物类型、形态、应用和地区进行的全球分析
 2025年全球生物肥料市场报告
 生物肥料市场机会、成长动力、产业趋势分析及2025-2034年预测固氮菌生物肥料市场机会、成长动力、产业趋势分析及2025-2034年预测
 全球固氮菌生物肥料市场2025年全球根瘤菌肥料市场报告
 日本生物肥料市场报告(按类型、作物、微生物、应用方式和地区)2025-2033