


 |
市场调查报告书
商品编码
1687724
根瘤菌:市场占有率分析、产业趋势与统计、成长预测(2025-2030 年)Rhizobium - Market Share Analysis, Industry Trends & Statistics, Growth Forecasts (2025 - 2030) |
||||||
价格
※ 本网页内容可能与最新版本有所差异。详细情况请与我们联繫。
简介目录
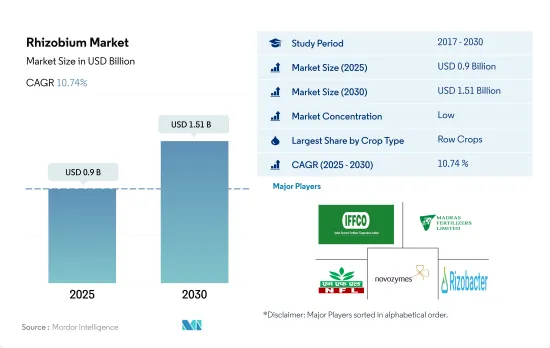
根瘤菌市场规模预计在 2025 年为 9 亿美元,预计到 2030 年将达到 15.1 亿美元,预测期内(2025-2030 年)的复合年增长率为 10.74%。
- 根瘤菌和豆科植物根部之间的特异性相互作用产生一种高度受调控的过程,称为调节,将大气中的氮转化为可吸收的植物营养物质。这种能力是细菌接种剂在田间作物生产中使用的基础。 2022年的菌根真菌市场以连续作物为主,约占金额的69.7%。世界上最重要的连续作物是大麦、玉米、小麦、油菜籽、黑麦、向日葵、大豆和稻米。
- 预计 2022 年园艺作物根瘤菌生物肥料市场规模将达到 1.372 亿美元,使用量为 4,900 吨。根瘤菌菌株附着在番茄和辣椒的根部,促进生产各阶段的生长,提高幼苗和果实的产量和品质。它也用于番茄、辣椒和其他园艺水果的温室栽培。
- 咖啡、茶叶、可可、棉花、甘蔗、油菜籽、向日葵和烟草是世界主要的经济作物。 2022 年,经济作物占根瘤菌生物肥料市场价值的 6,870 万美元。北美占据经济作物市场的主导地位,2022 年约为 5,220 万美元。
- 根瘤菌接种可以为植物提供所需的氮,同时减少无机氮肥的需求。有效的根瘤菌接种剂可以提供提高产量所需的总氮量的50-70%。根瘤菌也会产生维生素、胺基酸、铁载体、生长素和固氮。
- 由于上述特性和根瘤菌肥料应用的不断增加,预计市场将在 2023 年至 2029 年间成长。
- 根瘤菌是共生植物,是栖息于豆科植物根瘤中的最重要的固氮细菌。根瘤菌是全球消费量第二大的生物肥料,到2022年将占25.4%的市占率。
- 据估计,根瘤菌的微生物活动在各种豆科作物中每公顷每年固定40至250公斤的氮。欧盟计画透过扩大豆类作物种植面积,实现向永续植物蛋白生产的转变。
- 北美在全球根瘤菌市场占据主导地位,2022 年的市场占有率为 52.7%。北美根瘤菌生物肥料市场以连续作物为主,约占 2022 年市场金额的 62.4%。连续作物的主导地位是由于根瘤菌与连续作物中包含的作物共生。由于该地区连续作物种植的普及,其市场价值预计将增加,2023 年至 2029 年的复合年增长率为 13.0%。
- 非制度作物需要额外施用氮肥来提高作物的产量潜力。利用生物固氮菌可以增加谷物、水果和蔬菜等非反刍作物的产量。根瘤菌生物肥料市场以耕作作物为主,田间作物占据了大面积的种植面积,约占2022年金额的69.8%。已知将根瘤菌生物肥料施用于果蔬作物可以增加养分的利用率并产生必要的植物激素。
全球根瘤菌市场趋势
在北美和欧洲,由于人们认识的不断提高和政府的倡议,有机产量达到了历史最高水准。
- 有机农业已成为永续粮食系统的主要贡献者,并已在全球 187 个国家实践。截至2021年,全球有机农地面积为7,230万公顷,2018年至2021年间各地区平均成长2.9%。有机种植面积为1,440万公顷,占有机农地总面积的19.9%。
- 有机农业最强大的市场是北美和欧洲,这两个地区占世界有机种植面积的 41.0%。 2022年,欧洲将拥有650万公顷有机耕地,占总有机耕地面积的44.1%。北美和欧洲最重要的有机种植作物是苹果、草莓、谷物和橄榄。
- 亚太地区的新兴国家也正在加入有机农业运动,并在生产和供应新鲜有机农产品方面实现自给自足,以满足国内需求。有机农业趋势在亚太地区日益兴起,2017 年至 2022 年间,该地区的有机土地面积将增加 18.8%。该地区政府的主要措施也在有机农业扩张趋势中发挥了关键作用。例如,日本的食品、农业和农村基本计画旨在2030年将有机农场和有机农地的数量增加两倍。
- 有机农业的成长源于人们对其益处的认识不断提高,例如促进土壤健康、减少环境影响和生产更健康的食品。
人均有机食品支出的成长主要出现在美国和德国,这是由消费者对更健康、更永续食品的需求所推动的。
- 过去几年,有机食品市场经历了显着成长,全球销售额预计将从 2012 年的 708 亿美元成长到 2020 年的 1,206 亿美元。有机食品的趋势受到多种因素的推动,包括消费者对更健康、更永续的食品选择的需求不断增长,以及对传统农业对环境影响的认识不断提高。预计未来几年全球有机食品市场将持续维持成长趋势。
- 根据有机贸易协会 2021 年的一项调查,当年有机水果和蔬菜的销售额成长了约 4.5%,占有机产品总销售额的 15%。北美在有机产品平均支出方面占据市场主导地位,2021年美国的人均支出达到186.7美元,是北美国家中最高的。欧洲有机食品市场预计也将强劲成长,其中德国 2021 年的人均有机食品支出最高,达到 75.6 美元。
- 有机食品市场仍由消费者可支配收入较高的已开发国家主导,但有机食品市场在新兴国家预计也将成长。例如,亚太地区的工人阶级不断壮大,这使得有机食品更容易取得且价格更便宜,有助于扩大市场。
根瘤菌产业概况
根瘤菌市场较为分散,前五大公司的市占率为28.14%。市场的主要企业是:印度农民化肥合作社有限公司、马德拉斯化肥有限公司、国家化肥有限公司、诺维信和 Rizobacter(按字母顺序排列)。
其他福利
- Excel 格式的市场预测 (ME) 表
- 3 个月的分析师支持
目录
第 1 章执行摘要和主要发现
第二章 报告要约
第 3 章 简介
- 研究假设和市场定义
- 研究范围
- 调查方法
第四章 产业主要趋势
- 有机栽培面积
- 有机产品人均支出
- 法律规范
- 阿根廷
- 澳洲
- 巴西
- 加拿大
- 中国
- 埃及
- 法国
- 德国
- 印度
- 印尼
- 义大利
- 日本
- 墨西哥
- 荷兰
- 奈及利亚
- 菲律宾
- 俄罗斯
- 南非
- 西班牙
- 泰国
- 土耳其
- 英国
- 美国
- 越南
- 价值链与通路分析
第五章 市场区隔
- 作物类型
- 经济作物
- 园艺作物
- 耕作作物
- 地区
- 非洲
- 按国家
- 埃及
- 奈及利亚
- 南非
- 非洲其他地区
- 亚太地区
- 按国家
- 澳洲
- 中国
- 印度
- 印尼
- 日本
- 菲律宾
- 泰国
- 越南
- 其他亚太地区
- 欧洲
- 按国家
- 法国
- 德国
- 义大利
- 荷兰
- 俄罗斯
- 西班牙
- 土耳其
- 英国
- 其他欧洲国家
- 中东
- 按国家
- 伊朗
- 沙乌地阿拉伯
- 其他中东地区
- 北美洲
- 按国家
- 加拿大
- 墨西哥
- 美国
- 北美其他地区
- 南美洲
- 按国家
- 阿根廷
- 巴西
- 南美洲其他地区
- 非洲
第六章 竞争格局
- 主要策略趋势
- 市场占有率分析
- 业务状况
- 公司简介.
- Indian Farmers Fertiliser Cooperative Limited
- Indogulf BioAg LLC(Biotech Division of Indogulf Company)
- IPL Biologicals Limited
- Lallemand Inc.
- Madras Fertilizers Limited
- National Fertilizers Limited
- Novozymes
- Rizobacter
- T Stanes and Company Limited
- Vittia Group
第七章:执行长的关键策略问题
第 8 章 附录
- 世界概况
- 概述
- 五力分析框架
- 全球价值链分析
- 市场动态(DRO)
- 资讯来源和进一步阅读
- 图片列表
- 关键见解
- 资料包
- 词彙表
简介目录
Product Code: 64662
The Rhizobium Market size is estimated at 0.9 billion USD in 2025, and is expected to reach 1.51 billion USD by 2030, growing at a CAGR of 10.74% during the forecast period (2025-2030).
- The specific interaction between rhizobia and legume roots results in the formation of a highly regulated process termed modulation, which converts atmospheric nitrogen into an assimilable plant nutrient. This ability provides the basis for the use of bacterial inoculants in field crop production. Row crops dominated the mycorrhiza market in 2022, accounting for around 69.7% of market value. Globally, the most important row crops are barley, maize, wheat, rapeseed, rye, sunflower, soybean, and rice.
- The market for rhizobium-based biofertilizers in horticultural crops is expected to be worth USD 137.2 million, with 4.9 thousand metric tons used in 2022. Rhizobium strains colonize the roots of tomato and pepper plants to encourage growth at various stages of production, increasing seedling and fruit yield and quality. It is also utilized in greenhouse culture, such as tomato and capsicum farming, as well as other horticultural fruit growing.
- Coffee, tea, cocoa, cotton, sugarcane, rapeseed, sunflower, and tobacco are some of the major cash crops grown globally. Cash crops accounted for USD 68.7 million in the market value of rhizobium-based biofertilizers in 2022. North America dominated the market for cash crops and accounted for about USD 52.2 million in 2022.
- Rhizobium inoculation can provide plant nitrogen requirements while decreasing the demand for inorganic nitrogen fertilizer. Effective rhizobium inoculation can deliver up to 50-70% of the total nitrogen required to boost yields. Rhizobium also generates vitamins, amino acids, siderophores, auxins, and nitrogen fixation.
- Owing to the above-mentioned characteristics and the increase in the application of rhizobium-based fertilizers, the market is anticipated to grow between 2023 and 2029.
- Rhizobium is the most important nitrogen-fixing bacterium that exists in a symbiotic relationship with plants and lives in the root nodules of leguminous plants. Rhizobium is the second most consumed among biofertilizers globally and accounted for a share of 25.4% in the year 2022.
- It has been estimated that 40-250 kg of nitrogen per hectare per year is fixed by different legume crops by the microbial activities of rhizobium. The European Union is planning to make the transition toward sustainable plant protein production through the expansion of the area under leguminous crop cultivation.
- North America dominated the global rhizobium market with a market share of 52.7% in 2022. Row crops dominate the rhizobium biofertilizer market in North America, and they accounted for about 62.4% of the market value in 2022. The dominance of row crops is due to rhizobium's symbiotic association with leguminous crops, which come under row crops. Due to the large cultivation of row crops in the region, their market value is anticipated to increase, registering a CAGR of 13.0% between 2023 and 2029.
- The requirement for additional application of nitrogen in non-leguminous crops is high in order to enhance the yield potential of the crops. The usage of biological nitrogen-fixing bacteria can increase the production of non-leguminous crops like cereals, fruits, and vegetables. Row crops dominate the rhizobium biofertilizer market and accounted for about 69.8% of the market value in 2022, owing to the large area under the cultivation of field crops. The application of rhizobium biofertilizers in fruit and vegetable crops is known to increase nutrient availability and produce required plant hormones.
Global Rhizobium Market Trends
Organic production is at an all-time high in North America and Europe, due to the increasing awareness and Government initiatives.
- Organic agriculture has emerged as a significant contributor to sustainable food systems, with 187 countries practicing it globally. As of 2021, there was 72.3 million ha of organic agricultural land worldwide, with an average increase of 2.9% across all regions from 2018 to 2021. Organic arable land accounted for 14.4 million ha, representing 19.9% of the total organic agricultural land.
- The strongest markets for organic farming are North America and Europe, accounting for 41.0% of the global organic arable land. In 2022, Europe had 6.5 million ha of organic arable land, equivalent to 44.1% of the overall organic arable agricultural area. The most significant crops grown organically in North America and Europe are apples, strawberries, cereals, and olives.
- Developing countries in Asia-Pacific are also joining the organic agriculture movement and becoming self-sufficient in producing and providing fresh organic produce to meet their domestic demand. The trend of organic farming is gaining momentum in Asia-Pacific, with the region recording an 18.8% increase in organic arable land from 2017 to 2022. The major initiatives by governments in the region also play a vital role in the growing trend of organic farming. For example, Japan's Basic Plan for Food, Agriculture, and Rural Areas aims to triple the number of organic farmers and lands by 2030.
- The growth of organic agriculture is driven by the rising awareness of the benefits of organic farming, such as promoting soil health, reducing environmental impacts, and producing healthier food.
Per capita spending of organic food majorly observed in United States and Germany, attributed to the consumer demand for healthier and sustainable food
- The organic food market experienced significant growth in the past few years, with global sales reaching USD 120.6 billion in 2020, up from USD 70.8 billion in 2012. The trend toward organic food is being driven by several factors, such as increasing consumer demand for healthier, more sustainable food options and a growing awareness of the environmental impact of conventional agriculture. The global organic food market is expected to continue its growth trend over the coming years.
- According to a survey conducted by the Organic Trade Association in 2021, sales of organic fruits and vegetables increased by around 4.5% in the same year, accounting for 15% of the overall organic sales. North America dominates the market in terms of average spending on organic products, with per capita spending in the United States reaching USD 186.7 in 2021, the highest among all North American countries. Europe is also expected to experience significant growth in the organic food market, with Germany accounting for the highest per capita spending of USD 75.6 in 2021.
- While the organic food market is still dominated by developed countries with high consumer disposable incomes, it is also expected to grow in developing nations. For example, the increasing number of working-class people in the Asia-Pacific region may contribute to the market's expansion due to the growing availability and affordability of organic food products.
Rhizobium Industry Overview
The Rhizobium Market is fragmented, with the top five companies occupying 28.14%. The major players in this market are Indian Farmers Fertiliser Cooperative Limited, Madras Fertilizers Limited, National Fertilizers Limited, Novozymes and Rizobacter (sorted alphabetically).
Additional Benefits:
- The market estimate (ME) sheet in Excel format
- 3 months of analyst support
TABLE OF CONTENTS
1 EXECUTIVE SUMMARY & KEY FINDINGS
2 REPORT OFFERS
3 INTRODUCTION
- 3.1 Study Assumptions & Market Definition
- 3.2 Scope of the Study
- 3.3 Research Methodology
4 KEY INDUSTRY TRENDS
- 4.1 Area Under Organic Cultivation
- 4.2 Per Capita Spending On Organic Products
- 4.3 Regulatory Framework
- 4.3.1 Argentina
- 4.3.2 Australia
- 4.3.3 Brazil
- 4.3.4 Canada
- 4.3.5 China
- 4.3.6 Egypt
- 4.3.7 France
- 4.3.8 Germany
- 4.3.9 India
- 4.3.10 Indonesia
- 4.3.11 Italy
- 4.3.12 Japan
- 4.3.13 Mexico
- 4.3.14 Netherlands
- 4.3.15 Nigeria
- 4.3.16 Philippines
- 4.3.17 Russia
- 4.3.18 South Africa
- 4.3.19 Spain
- 4.3.20 Thailand
- 4.3.21 Turkey
- 4.3.22 United Kingdom
- 4.3.23 United States
- 4.3.24 Vietnam
- 4.4 Value Chain & Distribution Channel Analysis
5 MARKET SEGMENTATION (includes market size in Value in USD and Volume, Forecasts up to 2030 and analysis of growth prospects)
- 5.1 Crop Type
- 5.1.1 Cash Crops
- 5.1.2 Horticultural Crops
- 5.1.3 Row Crops
- 5.2 Region
- 5.2.1 Africa
- 5.2.1.1 By Country
- 5.2.1.1.1 Egypt
- 5.2.1.1.2 Nigeria
- 5.2.1.1.3 South Africa
- 5.2.1.1.4 Rest of Africa
- 5.2.2 Asia-Pacific
- 5.2.2.1 By Country
- 5.2.2.1.1 Australia
- 5.2.2.1.2 China
- 5.2.2.1.3 India
- 5.2.2.1.4 Indonesia
- 5.2.2.1.5 Japan
- 5.2.2.1.6 Philippines
- 5.2.2.1.7 Thailand
- 5.2.2.1.8 Vietnam
- 5.2.2.1.9 Rest of Asia-Pacific
- 5.2.3 Europe
- 5.2.3.1 By Country
- 5.2.3.1.1 France
- 5.2.3.1.2 Germany
- 5.2.3.1.3 Italy
- 5.2.3.1.4 Netherlands
- 5.2.3.1.5 Russia
- 5.2.3.1.6 Spain
- 5.2.3.1.7 Turkey
- 5.2.3.1.8 United Kingdom
- 5.2.3.1.9 Rest of Europe
- 5.2.4 Middle East
- 5.2.4.1 By Country
- 5.2.4.1.1 Iran
- 5.2.4.1.2 Saudi Arabia
- 5.2.4.1.3 Rest of Middle East
- 5.2.5 North America
- 5.2.5.1 By Country
- 5.2.5.1.1 Canada
- 5.2.5.1.2 Mexico
- 5.2.5.1.3 United States
- 5.2.5.1.4 Rest of North America
- 5.2.6 South America
- 5.2.6.1 By Country
- 5.2.6.1.1 Argentina
- 5.2.6.1.2 Brazil
- 5.2.6.1.3 Rest of South America
- 5.2.1 Africa
6 COMPETITIVE LANDSCAPE
- 6.1 Key Strategic Moves
- 6.2 Market Share Analysis
- 6.3 Company Landscape
- 6.4 Company Profiles (includes Global Level Overview, Market Level Overview, Core Business Segments, Financials, Headcount, Key Information, Market Rank, Market Share, Products and Services, and Analysis of Recent Developments).
- 6.4.1 Indian Farmers Fertiliser Cooperative Limited
- 6.4.2 Indogulf BioAg LLC (Biotech Division of Indogulf Company)
- 6.4.3 IPL Biologicals Limited
- 6.4.4 Lallemand Inc.
- 6.4.5 Madras Fertilizers Limited
- 6.4.6 National Fertilizers Limited
- 6.4.7 Novozymes
- 6.4.8 Rizobacter
- 6.4.9 T Stanes and Company Limited
- 6.4.10 Vittia Group
7 KEY STRATEGIC QUESTIONS FOR AGRICULTURAL BIOLOGICALS CEOS
8 APPENDIX
- 8.1 Global Overview
- 8.1.1 Overview
- 8.1.2 Porter's Five Forces Framework
- 8.1.3 Global Value Chain Analysis
- 8.1.4 Market Dynamics (DROs)
- 8.2 Sources & References
- 8.3 List of Tables & Figures
- 8.4 Primary Insights
- 8.5 Data Pack
- 8.6 Glossary of Terms
02-2729-4219
+886-2-2729-4219
 全球固氮菌生物肥料市场
 2025年全球根瘤菌肥料市场报告
 日本生物肥料市场报告(按类型、作物、微生物、应用方式和地区)2025-2033
 全球生物肥料市场需求及预测分析(2018-2034)
 生物肥料市场规模、份额及成长分析(按类型、作物类型、应用类型、形态、微生物及地区)-产业预测,2025-2032
 中国生物肥料市场占有率分析、产业趋势与统计、成长预测(2025-2030 年)亚太生物肥料市场占有率分析、产业趋势与成长预测(2025-2030)北美生物肥料市场占有率分析、产业趋势和成长预测(2025-2030)南美洲生物肥料市场占有率分析、产业趋势与成长预测(2025-2030)印度生物肥料:市场占有率分析、行业趋势和统计数据、成长预测(2025-2030 年)
▼