


 |
市场调查报告书
商品编码
1693766
亚太生物肥料市场占有率分析、产业趋势与成长预测(2025-2030)Asia-Pacific Biofertilizer - Market Share Analysis, Industry Trends & Statistics, Growth Forecasts (2025 - 2030) |
||||||
※ 本网页内容可能与最新版本有所差异。详细情况请与我们联繫。
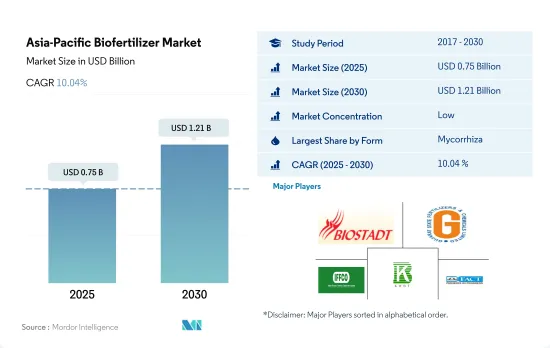
亚太生物肥料市场规模预计在 2025 年为 7.5 亿美元,预计到 2030 年将达到 12.1 亿美元,预测期内(2025-2030 年)的复合年增长率为 10.04%。
- 生物肥料是活的微生物,透过调动或增加土壤中的养分供应来促进植物营养。菌根真菌、固氮螺菌、固氮菌、根瘤菌和解磷细菌是农业中最常使用的生物肥料微生物。该地区的生物肥料市场以金额为准预计在 2017 年至 2022 年期间以 2.4% 的复合年增长率增长。然而,预计在 2023 年至 2029 年期间,生物肥料市场规模将以约 9.9%(复合年增长率)成长。
- 在这些生物肥料中,固氮菌是亚太地区使用第二广泛的生物肥料,2022 年占 24.6% 的市场份额,价值 1.418 亿美元。固氮菌是一种固氮细菌,不需要共生关係,可以固定大气中的氮,供植物利用。固氮菌可用作水稻、棉花和蔬菜等所有非反刍植物的生物肥料。
- 生物肥料消费将以连续作物为主,2022 年的价值约为 4.791 亿美元。该地区种植的主要作物包括水稻、小麦、大麦、玉米和大豆。连续作物占主导地位的主要原因是有机种植面积大,2022 年有机种植面积约占该地区作物种植面积的 67.5%。
- 随着有机作物生产的扩大以及国内外市场对有机产品的需求不断增长,该地区各国政府加强了推广有机和永续农业的力度。这些因素可能会在整个预测期内影响市场。预计 2023 年至 2029 年期间亚太地区生物肥料市场的复合年增长率约为 9.9%。
- 2017年至2022年,亚太地区的有机种植面积将大幅扩大,分别从310万公顷增加到380万公顷。这是因为许多亚太国家对有机食品的需求不断增加。因此,2017-2022年期间亚太生物肥料市场的复合年增长率为2.4%。
- 亚太地区第二受欢迎的生物肥料是固体氮菌,2022 年占市占率的 24.6%,价值 1.418 亿美元。由于细菌具有固氮和溶解能力,固氮菌可用作农业生物肥料,使作物生产更永续76。
- 研究表明,固氮菌作为一种生物接种剂,可以合成大量生物活性化合物,如烟碱酸、生物素、异固氮菌、维生素B和吉贝素,以支持根系发育和矿物质吸收,从而使农业生产力提高10-12%。大多数非草作物,包括水稻、小麦、小米、棉花、番茄、高丽菜、芥菜和红花,都建议与固氮菌一起使用。
- 到2022年,中国将占据生物肥料市场总量的93.5%,成为该地区的主导国家。 2022年中国生物肥料市场以行作物为主,占82.3%。至2022年,有机种植面积将达210万公顷。
- 消费者对有机产品的兴趣日益浓厚,使农民意识到依赖农药投入的弊端,从而增加了有机种植面积。预计 2023 年至 2029 年期间亚太地区对生物肥料的需求将以 8.6% 的复合年增长率成长。
亚太生物肥料市场趋势
中国、印度、印尼和澳洲等国家扩大政府支持,以促进该地区的有机农业
- 根据FiBL统计,2021年亚太地区有机农地面积超过370万公顷,占全球有机农地面积的26.4%。 2017年至2022年间,有机种植面积增加了19.3%。截至 2020 年,该地区共有 183 万家有机生产者,其中印度以 130 万家位居榜首。中国、印度、印尼和澳洲是该地区有机种植面积最大的国家。中国和印度等国家的政府部门正在不断推广有机农业,以减少作物种植对化学物质的依赖。例如,印度实施了「Paramparagat Krishi Vikas Yojana」和「全印度有机农业网路计画」(AI-NPOF)等计画。
- 2021年,中国以250万公顷的面积占最大份额,为66.1%,其次是印度,为19.3%,印尼,为1.5%,澳大利亚,为1.4%。所有有机农地分为三种作物类型:连续作物、园艺作物和经济作物。连作作物占该地区有机土地的最大份额,2021 年为 67.5%,即 250 万公顷。该地区种植的主要连作作物包括水稻、小麦、豆类、大豆和小米。
- 经济作物将占第二大份额,到2021年将达到70万公顷,占有机农地的18.5%。全球对糖和有机茶等有机经济作物的需求正在增加。中国和印度分别是有机绿茶和有机红茶的最大生产国。由于国际需求不断增长,该地区有机种植面积预计会增加。
澳洲人均有机产品支出最高,而中国有机食品市场成长迅速
- 2021年该地区人均有机产品支出为85.1美元。同年澳洲人均有机产品支出较高,为34.49美元。根据全球有机贸易的数据,2021 年澳洲有机包装食品和饮料市场价值 8.852 亿美元。
- 预计2021年中国有机食品市场将成长13.3%,并将持续维持正成长模式,2023年至2029年的复合年增长率为7.1%。预计到2025年,有机市场规模将达到64亿美元,这得益于年轻一代越来越重视有机产品,以及由于职业母亲数量的增加和健康保健趋势的普及,对有机婴儿食品的需求不断增长。
- 印度的有机产品远远落后于全球需求的 1.0%,2021 年的人均支出仅 0.08 美元。然而,印度市场在未来几年可能会继续成长,到 2025 年将达到 1.533 亿美元。目前,该地区的有机市场高度分散,只有少数超级市场和专卖店销售有机产品。增加消费者知识和改变购买模式可能会让人们更了解该地区有机食品的永续性。人均收入的增加和消费者对有机食品重要性的认识的提高可能会推动亚太地区人均有机食品支出的增加。
亚太生物肥料产业概况
亚太生物肥料市场细分化,前五大公司占30.04%。市场的主要企业有 Biostadt India Limited、Gujarat State Fertilizers & Chemicals Ltd、Indian Farmers Fertiliser Cooperative Limited、Kiwa Bio-Tech、The Fertilizers、Chemicals Travancore Limited 等。
其他福利
- Excel 格式的市场预测 (ME) 表
- 3个月的分析师支持
目录
第一章执行摘要和主要发现
第二章 报告要约
第三章 引言
- 研究假设和市场定义
- 研究范围
- 调查方法
第四章 产业主要趋势
- 有机种植区
- 有机产品人均支出
- 法律规范
- 澳洲
- 中国
- 印度
- 印尼
- 日本
- 菲律宾
- 泰国
- 越南
- 价值炼和通路分析
第五章市场区隔
- 形式
- 固氮螺菌
- 固氮菌
- 菌根真菌
- 解磷细菌
- 根瘤菌
- 其他生物肥料
- 作物类型
- 经济作物
- 园艺作物
- 田间作物
- 原产地
- 澳洲
- 中国
- 印度
- 印尼
- 日本
- 菲律宾
- 泰国
- 越南
- 其他亚太地区
第六章竞争格局
- 关键策略趋势
- 市场占有率分析
- 商业状况
- 公司简介
- Atlantica Agricola
- Biolchim SpA
- Biostadt India Limited
- Gujarat State Fertilizers & Chemicals Ltd
- Indian Farmers Fertiliser Cooperative Limited
- IPL Biologicals Limited
- Kiwa Bio-Tech
- Sustane Natural Fertilizer Inc.
- Symborg Inc.
- The Fertilizers and Chemicals Travancore Limited
第七章:CEO面临的关键策略问题
第 8 章 附录
- 世界概况
- 概述
- 五力分析框架
- 全球价值链分析
- 市场动态(DRO)
- 资讯来源及延伸阅读
- 图片列表
- 关键见解
- 数据包
- 词彙表
The Asia-Pacific Biofertilizer Market size is estimated at 0.75 billion USD in 2025, and is expected to reach 1.21 billion USD by 2030, growing at a CAGR of 10.04% during the forecast period (2025-2030).
- Biofertilizers are live microorganisms that promote plant nutrition by mobilizing or increasing nutrient availability in soils. Mycorrhiza, Azospirillum, Azotobacter, Rhizobium, and phosphate-solubilizing bacteria are the microorganisms most commonly utilized as biofertilizers in agriculture. The biofertilizer market in the region grew by 2.4% (CAGR) between 2017 and 2022 by value. However, the market value of biofertilizers is anticipated to increase by about 9.9% (CAGR) between 2023 and 2029.
- Among these biofertilizers, Azotobacter is the second most widely utilized in the Asia Pacific region, accounting for 24.6% of the market in 2022, with a value of USD 141.8 million. Azotobacter is a nitrogen-fixing bacterium that does not require symbiotic relationships to fix atmospheric nitrogen and make it available to plants. It is used as a biofertilizer for all non-leguminous plants, including rice, cotton, and vegetables.
- The consumption of biofertilizers is dominant in row crops, valued at about USD 479.1 million in 2022. The major row crops cultivated in the region include rice, wheat, barley, corn, and soybeans. The dominance of row crops is mainly due to their large organic cultivation area, which accounted for about 67.5% of the region's organic crop cultivation area in 2022.
- Government initiatives in various regional countries to promote organic or sustainable farming have increased in response to growing organic crop production and the rising demand for organic products in both domestic and international markets. These factors may have an impact on the market throughout the forecast period. The value of the Asia-Pacific biofertilizer market is anticipated to grow by about 9.9% (CAGR) between 2023 and 2029,.
- The organic area under cultivation in Asia-Pacific expanded significantly from 2017 to 2022, going from 3.1 million hectares to 3.8 million hectares, respectively. Owing to the growing demand for organically cultivated food in many Asia-Pacific countries. As a result, the Asia-Pacific biofertilizer market grew by 2.4% (CAGR) between 2017 and 2022.
- The second most popular biofertilizer in Asia-Pacific is Azotobacter, which accounted for 24.6% of the market in 2022, valued at USD 141.8 million. It can be used as a biofertilizer in agriculture to make crop production more sustainable through its ability to fix nitrogen and solubilize bacteria76
- Azotobacter as bioinoculants have been demonstrated to increase agricultural productivity by 10-12%, leading to the synthesis of significant amounts of biologically active compounds, including nicotinic acid, biotin, heteroauxins, vitamin B, and gibberellins, which support root development and mineral absorption. The majority of non-leguminous crops, including rice, wheat, millets, cotton, tomato, cabbage, mustard, and safflower, are recommended for Azotobacter use.
- China held 93.5% of the total biofertilizer market value in 2022, making it the dominant country in the region. Row crops dominated the Chinese biofertilizer market in 2022, accounting for 82.3%. Row crops held a major organic acreage in the country, which was 2.1 million hectares in 2022.
- Due to rising consumer interest in organic products, farmers have become more aware of the disadvantages of relying on agricultural chemical inputs and rising organic acreage. The demand for biofertilizers in Asia-Pacific is anticipated to increase between 2023 and 2029, with a CAGR of 8.6%.
Asia-Pacific Biofertilizer Market Trends
Growing government support in countries like China, India, Indonesia, and Australia, boosts organic farming in the region
- The area of organic agricultural land in Asia-Pacific was over 3.7 million ha in 2021, representing 26.4% of the global organic area, as per FiBL statistics. The organic area under cultivation grew by 19.3% between 2017-2022. As of 2020, the region had 1.83 million organic producers, with India topping the list with 1.3 million organic producers. China, India, Indonesia, and Australia are the major countries with large organic cultivation areas in the region. Government authorities in countries like China and India are constantly promoting organic agriculture to reduce reliance on chemical inputs for crop cultivation. For instance, India has implemented schemes like Paramparagat Krishi Vikas Yojana and the All India Network Programme on Organic Farming (AI-NPOF).
- In 2021, China accounted for a maximum share of 66.1%, with 2.5 million ha, followed by India, Indonesia, and Australia, with 19.3%, 1.5%, and 1.4%, respectively. The total organic land is divided into three crop types, namely row crops, horticultural crops, and cash crops. Row crops occupy a major share of organic agricultural land in the region, accounting for 67.5% share, i.e., 2.5 million ha in 2021. The major row crops grown in the region include paddy, wheat, pulses, soybeans, and millets.
- Cash crops held the second largest share, with 0.7 million ha in 2021, accounting for an 18.5% share of organic cropland. The demand for organic cash crops like sugar and organic tea is increasing worldwide. China and India are the largest organic green and black tea producers, respectively. The growing international demand is expected to increase the organic acreages in the region.
Per capita spending on organic product predominant in Australia and China's organic food market growing significantly
- The per capita spending on organic products in the region was recorded at USD 85.1 in 2021. Australia witnessed a higher per capita spending on organic products, with USD 34.49 in the same year, attributed to the higher demand due to consumers' perception of organic food as healthy. As per the Global Organic Trade data, the organic packaged food and beverage market in Australia was valued at USD 885.2 million in 2021.
- China's organic food market grew by 13.3% in 2021, and the positive growth pattern is expected to continue, with a CAGR of 7.1% between 2023 and 2029. With an increasing emphasis on the importance of organic products among the younger generation and the rising demand for organic baby food due to the growing number of mothers in the workforce and the increasing adoption of the health and wellness trend, organic products are expected to reach a value of USD 6.4 billion by 2025.
- Organic products in India represent far less than 1.0% of global demand, with a per capita expenditure of just USD 0.08 in 2021. However, the Indian market may grow over the coming years, reaching a value of USD 153.3 million by 2025. Currently, the region's organic goods market is highly fragmented, with just a few supermarkets and specialty stores selling them, as people from higher-income families are the only potential customers. Growing consumer knowledge and changing buying patterns may lead to a better understanding of organic food sustainability in the region. Increasing per capita income and increased consumer awareness of the importance of organic food can raise per capita expenditure on organic food items in the Asia-Pacific region.
Asia-Pacific Biofertilizer Industry Overview
The Asia-Pacific Biofertilizer Market is fragmented, with the top five companies occupying 30.04%. The major players in this market are Biostadt India Limited, Gujarat State Fertilizers & Chemicals Ltd, Indian Farmers Fertiliser Cooperative Limited, Kiwa Bio-Tech and The Fertilizers and Chemicals Travancore Limited (sorted alphabetically).
Additional Benefits:
- The market estimate (ME) sheet in Excel format
- 3 months of analyst support
TABLE OF CONTENTS
1 EXECUTIVE SUMMARY & KEY FINDINGS
2 REPORT OFFERS
3 INTRODUCTION
- 3.1 Study Assumptions & Market Definition
- 3.2 Scope of the Study
- 3.3 Research Methodology
4 KEY INDUSTRY TRENDS
- 4.1 Area Under Organic Cultivation
- 4.2 Per Capita Spending On Organic Products
- 4.3 Regulatory Framework
- 4.3.1 Australia
- 4.3.2 China
- 4.3.3 India
- 4.3.4 Indonesia
- 4.3.5 Japan
- 4.3.6 Philippines
- 4.3.7 Thailand
- 4.3.8 Vietnam
- 4.4 Value Chain & Distribution Channel Analysis
5 MARKET SEGMENTATION (includes market size in Value in USD and Volume, Forecasts up to 2030 and analysis of growth prospects)
- 5.1 Form
- 5.1.1 Azospirillum
- 5.1.2 Azotobacter
- 5.1.3 Mycorrhiza
- 5.1.4 Phosphate Solubilizing Bacteria
- 5.1.5 Rhizobium
- 5.1.6 Other Biofertilizers
- 5.2 Crop Type
- 5.2.1 Cash Crops
- 5.2.2 Horticultural Crops
- 5.2.3 Row Crops
- 5.3 Country
- 5.3.1 Australia
- 5.3.2 China
- 5.3.3 India
- 5.3.4 Indonesia
- 5.3.5 Japan
- 5.3.6 Philippines
- 5.3.7 Thailand
- 5.3.8 Vietnam
- 5.3.9 Rest of Asia-Pacific
6 COMPETITIVE LANDSCAPE
- 6.1 Key Strategic Moves
- 6.2 Market Share Analysis
- 6.3 Company Landscape
- 6.4 Company Profiles (includes Global Level Overview, Market Level Overview, Core Business Segments, Financials, Headcount, Key Information, Market Rank, Market Share, Products and Services, and Analysis of Recent Developments).
- 6.4.1 Atlantica Agricola
- 6.4.2 Biolchim SpA
- 6.4.3 Biostadt India Limited
- 6.4.4 Gujarat State Fertilizers & Chemicals Ltd
- 6.4.5 Indian Farmers Fertiliser Cooperative Limited
- 6.4.6 IPL Biologicals Limited
- 6.4.7 Kiwa Bio-Tech
- 6.4.8 Sustane Natural Fertilizer Inc.
- 6.4.9 Symborg Inc.
- 6.4.10 The Fertilizers and Chemicals Travancore Limited
7 KEY STRATEGIC QUESTIONS FOR AGRICULTURAL BIOLOGICALS CEOS
8 APPENDIX
- 8.1 Global Overview
- 8.1.1 Overview
- 8.1.2 Porter's Five Forces Framework
- 8.1.3 Global Value Chain Analysis
- 8.1.4 Market Dynamics (DROs)
- 8.2 Sources & References
- 8.3 List of Tables & Figures
- 8.4 Primary Insights
- 8.5 Data Pack
- 8.6 Glossary of Terms
 生物肥料市场-全球产业规模、份额、趋势、机会和预测,按类型、形态、作物类型、应用、微生物类型、地区和竞争格局划分,2020-2030年预测
 基于固氮菌的生物肥料市场—按产品类型、作物类型、应用方法、分销管道、最终用户和配方类型划分—2025-2032年全球预测生物肥料市场按类型、形态、应用方法、作物类型和分销管道划分-2025-2032年全球预测
 2032年生物肥料市场预测:按产品类型、微生物、作物类型、形态、应用和地区进行的全球分析
 2025年全球生物肥料市场报告
 生物肥料市场机会、成长动力、产业趋势分析及2025-2034年预测固氮菌生物肥料市场机会、成长动力、产业趋势分析及2025-2034年预测
 全球固氮菌生物肥料市场2025年全球根瘤菌肥料市场报告
 日本生物肥料市场报告(按类型、作物、微生物、应用方式和地区)2025-2033