


 |
市场调查报告书
商品编码
1687729
非洲生物肥料市场占有率分析、产业趋势与统计、成长预测(2025-2030)Africa Biofertilizer - Market Share Analysis, Industry Trends & Statistics, Growth Forecasts (2025 - 2030) |
||||||
※ 本网页内容可能与最新版本有所差异。详细情况请与我们联繫。
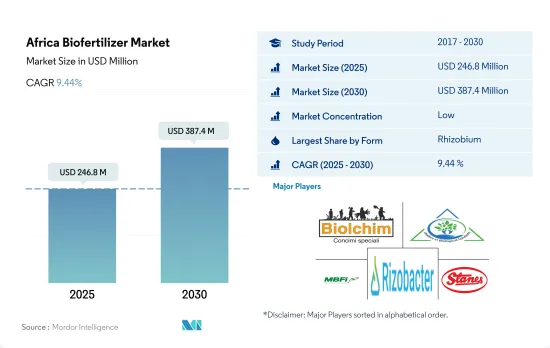
预计 2025 年非洲生物肥料市场规模为 2.468 亿美元,到 2030 年将达到 3.874 亿美元,预测期内(2025-2030 年)的复合年增长率为 9.44%。
- 生物肥料是活的微生物,透过调动或增加土壤中养分的可用性来改善植物的营养状况。菌根真菌、固氮螺菌、固氮菌、根瘤菌和解磷细菌是农业中最常用作生物肥料的微生物。
- 在这些生物肥料中,根瘤菌在非洲应用最为广泛,2022 年占 45.6% 的市场份额,价值 8,750 万美元。根瘤菌是最突出的固氮细菌,生活在豆科植物的根瘤中并与植物形成共生关係。
- 固氮螺菌占据第二大市场占有率,2022 年价值 4,380 万美元。基于固氮螺菌的生物肥料可取代植物所需 25-30% 的氮,从而促进植物生长。
- 耕地作物将主导生物肥料市场,占消费份额的 76.5%,到 2022 年约为 1.468 亿美元,其次是园艺作物,为 3,050 万美元。重茬作物生物肥料的市场规模不断扩大。 2017年至2021年间,成长了约17.8%。预计到预测期结束时将成长约 69.6%,达到 2.7 亿美元。
- 施用生物肥料可以减少化学氮肥的使用,降低整体种植成本。国内外市场对有机产品的需求不断增长,推动了该地区对生物肥料的需求。
- 随着埃及、奈及利亚和南非等许多非洲国家对有机食品的需求不断增长,非洲已成为生物肥料的重要市场。在过去一段时间(2017-2022年),该地区的有机种植面积略有增加,从2017年的110万公顷增加到2022年的130万公顷。同期,非洲生物肥料市场成长了6.9%。该地区主要生产玉米、小麦和玉米等谷物。
- 根瘤菌是非洲国家最常使用的生物肥料,2022 年占 45.6% 的市场份额,价值 8,760 万美元。根瘤菌是最着名的固氮细菌,存在于豆科植物的根瘤中,与植物有共生关係。
- 在其他非洲国家中,以面积计算,突尼斯是 2021 年该地区最大的有机生产国。在突尼斯种植的 250产品类型中,约有 60 种用于出口,其中大部分是橄榄油,但也有椰枣、芳香草本和药草,以及一些蔬菜和水果。突尼斯虽然国土面积不大,但其有机农业认证面积排名世界第30位,非洲第一。
- 有机农业面积领先的国家为埃及和南非,分别为4.51万公顷和1.26万公顷,合计占5.0%。然而,非洲其他地区的有机农业面积为 120 万公顷,占非洲有机农业总面积的 95.0%。
- 由于消费者对有机产品的兴趣日益浓厚,预测期内对生物肥料的需求预计会增加。农民开始意识到依赖化学投入农业的弊端,并正在增加有机种植面积,这也可能推动市场发展。
非洲生物肥料市场趋势
该地区的有机农业部门拥有 834,000 名有机生产者,其中突尼斯拥有更多的有机土地。
- 非洲的有机农业有两种形式:认证和非认证。在非洲,只有 0.2% 的农地获得有机认证。然而,大多数有机农民并未获得认证。许多获得认证的农民都希望出口,其中大部分产品销往非洲最大的农业市场—欧盟。另一方面,未经认证的有机农民则希望在自己的国家销售产品。 2022年,非洲有机农地面积超过120万公顷,占全球有机农地面积的9.0%。
- 非洲地区主要的有机作物包括坚果、橄榄、咖啡、可可、油籽和棉花。经济作物占有机农地的大部分,2022 年为 817,400 公顷,占 63.2%。连作作物占有机农地面积的比例则位居第二,约25.6%,同年覆盖面积为33.12万公顷。 2022 年园艺作物占有机种植面积的 11.2%,达到 144,900 公顷。
- 2020年,非洲将有近834,000家有机生产者。有机生产者数量最多的国家是衣索比亚(约 22 万人)、坦尚尼亚(约 149,000 人)和乌干达(超过 139,000 人)。
- 从面积来看,突尼斯的有机种植面积最大(2020年超过29万公顷)。岛国圣多美和普林西比是该地区有机农业用地比例最高的国家,达 20.7%。
埃及、南非和奈及利亚的人均有机产品支出最高。
- 非洲的人均收入一直在增加,导致人们在营养食品上的支出增加。有机食品和饮料越来越多地出现在该地区的货架上。
- 在非洲,有机产品的消费量大幅增加,尤其是在埃及、南非和奈及利亚。 2021年,埃及人均有机产品消费量为55.5美元,其次是南非7.1美元。在非洲,乌干达是最早采用有机农业的国家之一,并已成功发展成为有机产品的重要生产国和出口国。
- 非洲地区普遍消费的有机产品是新鲜蔬菜和水果。人们做出了巨大努力,将有机农业纳入政策、国家推广体系、行销、价值链发展和消费者关注的主流。
- 由于人均饮料消费量(尤其是果汁)的增加、健康意识的增强以及消费者转向无化学成分的有机食品和饮料,预计 2023 年至 2029 年间对有机食品的需求将会增长。
- 目前,有机食品在食品产业中所占比例较小,但它在非洲消费者中越来越受欢迎。然而,较低的收入水平、缺乏有机标准和其他当地市场认证基础设施可能会抑制该地区有机食品市场的成长。
非洲生物肥料产业概况
非洲生物肥料市场细分,前五大公司占2.49%。该市场的主要企业有 Biolchim SPA、IPL Biologicals Limited、Microbial Biological Fertilizers International、Rizobacter、T. Stanes and Company Limited 等。
其他福利
- Excel 格式的市场预测 (ME) 表
- 3个月的分析师支持
目录
第一章执行摘要和主要发现
第二章 报告要约
第三章 引言
- 研究假设和市场定义
- 研究范围
- 调查方法
第四章 产业主要趋势
- 有机种植区
- 有机产品人均支出
- 法律规范
- 埃及
- 伊朗
- 奈及利亚
- 南非
- 价值炼和通路分析
第五章市场区隔
- 形式
- 固氮螺菌
- 固氮菌
- 菌根真菌
- 解磷细菌
- 根瘤菌
- 其他生物肥料
- 作物类型
- 经济作物
- 园艺作物
- 田间作物
- 原产地
- 埃及
- 奈及利亚
- 南非
- 其他非洲国家
第六章 竞争格局
- 关键策略趋势
- 市场占有率分析
- 商业状况
- 公司简介.
- Atlantica Agricola
- Biolchim SPA
- IPL Biologicals Limited
- Mapleton Agri BIoTec Pt. Ltd
- Microbial Biological Fertilizers International
- Rizobacter
- T. Stanes and Company Limited
- Valent Biosciences LLC
- Vegalab SA
第七章:CEO面临的关键策略问题
第 8 章 附录
- 世界概况
- 概述
- 五力分析框架
- 全球价值链分析
- 市场动态(DRO)
- 资讯来源及延伸阅读
- 图片列表
- 关键见解
- 资料包
- 词彙表
The Africa Biofertilizer Market size is estimated at 246.8 million USD in 2025, and is expected to reach 387.4 million USD by 2030, growing at a CAGR of 9.44% during the forecast period (2025-2030).
- Biofertilizers are living microorganisms that improve plant nutrition by mobilizing or increasing nutrient availability in soils. Mycorrhiza, Azospirillum, Azotobacter, Rhizobium, and phosphate-solubilizing bacteria are the most frequent microorganisms used as biofertilizers in agriculture.
- Among these biofertilizers, Rhizobium is most widely used in Africa, accounting for 45.6% of the market in 2022 and valued at USD 87.5 million. Rhizobium is the most prominent nitrogen-fixing bacteria that live in the root nodules of leguminous plants and has a symbiotic relationship with plants.
- Azospirillum accounted for the second-largest market share, valued at USD 43.8 million in 2022. Azospirillum-based biofertilizers promote plant vegetative growth by substituting 25-30% of plant nitrogen requirements.
- Row crops dominated the biofertilizer market, valued at about USD 146.8 million and accounting for 76.5% of the consumption share in 2022, followed by horticultural crops, valued at USD 30.5 million. The market value of biofertilizers in row crops is constantly expanding. It increased by about 17.8% between 2017 and 2021. It is anticipated to increase by about 69.6% by the end of the forecast period, reaching USD 270.0 million.
- The application of biofertilizers can reduce the use of chemical nitrogen fertilizers and the overall cost of cultivation. The demand for organic products in domestic and international markets is increasing, thus driving the demand for biofertilizers in the region.
- As the demand for organically cultivated food grows in many African countries such as Egypt, Nigeria, and South Africa, Africa is a significant market for biofertilizers. During the historical period (2017-2022), the region's organically cultivated area expanded slightly, from 1.1 million hectares in 2017 to 1.3 million hectares in 2022. During the same period, the African biofertilizer market grew by 6.9%. Major cereal crops are produced in the region, like maize, wheat, and corn.
- Rhizobium is the most often used biofertilizer in African countries, accounting for 45.6% of the market in 2022 and worth USD 87.6 million. Rhizobium is the most prominent nitrogen-fixing bacterium that resides in the root nodules of leguminous plants and has a symbiotic connection with plants.
- In the Rest of Africa, in terms of area, Tunisia was the region's largest organic producer in 2021. Around 60 of the 250 organic product categories cultivated in Tunisia are exported, mostly olive oil, but also dates, aromatic and medicinal herbs, and certain vegetables and fruits. Tunisia ranks 30th in the world and first in Africa in terms of organic farming area certification, despite its small size.
- The major countries with organic agricultural acreage include Egypt and South Africa accounting for 5.0% together, with 45.1 thousand hectares and 12.6 thousand hectares, respectively. However, the Rest of Africa accounted for 95.0% of total organic agricultural acreage in Africa, with 1.2 million hectares.
- The demand for biofertilizers is expected to rise during the forecast period owing to rising consumer interest in organic products. Farmers are becoming more aware of the disadvantages of relying on chemical inputs in agriculture and increasing organic acreage, which may also drive the market.
Africa Biofertilizer Market Trends
8,34,000 organic producers are in the region's organic sector with Tunisia is having more organic land
- Organic farming takes two forms in Africa: certified and uncertified. Only 0.2% of organic agricultural land may be certified in Africa. However, most organic farmers are not certified. Many certified farmers aim to export their products, with the majority being exported to the European Union, Africa's largest agricultural market. In contrast, non-certified organic farmers aim to sell their produce from home. In 2022, the area of organic agricultural land in Africa was over 1.2 million ha, representing 9.0% of the total organic agricultural area worldwide.
- In the African region, key organic crops include nuts, olives, coffee, cocoa, oilseeds, and cotton. Cash crops occupied a major share of organic agricultural land, accounting for 63.2% in 2022, with 817.4 thousand hectares. Row crops held the second-largest share of organic acreage, i.e., about 25.6%, accounting for 331.2 thousand hectares in the same year. Horticultural crops accounted for 11.2% of the organic acreage, with 144.9 thousand ha in 2022.
- In 2020, there were nearly 834,000 organic producers in Africa. The countries with the highest number of organic producers were Ethiopia (almost 220,000), Tanzania (nearly 149,000), and Uganda (over 139,000).
- In terms of area, Tunisia has the largest organic area under cultivation (more than 290,000 ha in 2020). The island state of Sao Tome and Principe has the region's highest percentage of land devoted to organic farming, i.e., 20.7%.
Per capita spending on organic product predominant in Egypt, South Africa, and Nigeria countries
- Africa's per capita income is consistently increasing, encouraging people to spend more on nutritious food. Organic foods and beverages are gaining more shelf space in the region.
- In Africa, consumption of organic products increased significantly, especially in Egypt, South Africa, and Nigeria. In 2021, the per capita consumption of organic products accounted for USD 55.5 in Egypt, followed by South Africa with USD 7.1. Within Africa, Uganda was an early adopter of organic farming and successfully established itself as a significant producer and exporter of organic products.
- In the African region, the commonly consumed organic products include fresh vegetables and fruits. Significant efforts have been made to mainstream organic agriculture into policy, national extension systems, marketing, and value chain development, thus gaining consumer attention.
- With the increasing per capita consumption of beverages, primarily fruit juices, growing health awareness, and consumers shifting toward organic food and drinks that do not contain chemical ingredients, the demand for organic food is expected to increase between 2023 and 2029.
- Though organic foods currently account for a small portion of the food industry, they are gaining popularity among African consumers. However, low income levels, lack of organic standards, and other infrastructure for local market certification may restrain the growth of the organic food market in the region.
Africa Biofertilizer Industry Overview
The Africa Biofertilizer Market is fragmented, with the top five companies occupying 2.49%. The major players in this market are Biolchim SPA, IPL Biologicals Limited, Microbial Biological Fertilizers International, Rizobacter and T. Stanes and Company Limited (sorted alphabetically).
Additional Benefits:
- The market estimate (ME) sheet in Excel format
- 3 months of analyst support
TABLE OF CONTENTS
1 EXECUTIVE SUMMARY & KEY FINDINGS
2 REPORT OFFERS
3 INTRODUCTION
- 3.1 Study Assumptions & Market Definition
- 3.2 Scope of the Study
- 3.3 Research Methodology
4 KEY INDUSTRY TRENDS
- 4.1 Area Under Organic Cultivation
- 4.2 Per Capita Spending On Organic Products
- 4.3 Regulatory Framework
- 4.3.1 Egypt
- 4.3.2 Iran
- 4.3.3 Nigeria
- 4.3.4 South Africa
- 4.4 Value Chain & Distribution Channel Analysis
5 MARKET SEGMENTATION (includes market size in Value in USD and Volume, Forecasts up to 2030 and analysis of growth prospects)
- 5.1 Form
- 5.1.1 Azospirillum
- 5.1.2 Azotobacter
- 5.1.3 Mycorrhiza
- 5.1.4 Phosphate Solubilizing Bacteria
- 5.1.5 Rhizobium
- 5.1.6 Other Biofertilizers
- 5.2 Crop Type
- 5.2.1 Cash Crops
- 5.2.2 Horticultural Crops
- 5.2.3 Row Crops
- 5.3 Country
- 5.3.1 Egypt
- 5.3.2 Nigeria
- 5.3.3 South Africa
- 5.3.4 Rest of Africa
6 COMPETITIVE LANDSCAPE
- 6.1 Key Strategic Moves
- 6.2 Market Share Analysis
- 6.3 Company Landscape
- 6.4 Company Profiles (includes Global Level Overview, Market Level Overview, Core Business Segments, Financials, Headcount, Key Information, Market Rank, Market Share, Products and Services, and Analysis of Recent Developments).
- 6.4.1 Atlantica Agricola
- 6.4.2 Biolchim SPA
- 6.4.3 IPL Biologicals Limited
- 6.4.4 Mapleton Agri Biotec Pt. Ltd
- 6.4.5 Microbial Biological Fertilizers International
- 6.4.6 Rizobacter
- 6.4.7 T. Stanes and Company Limited
- 6.4.8 Valent Biosciences LLC
- 6.4.9 Vegalab SA
7 KEY STRATEGIC QUESTIONS FOR AGRICULTURAL BIOLOGICALS CEOS
8 APPENDIX
- 8.1 Global Overview
- 8.1.1 Overview
- 8.1.2 Porter's Five Forces Framework
- 8.1.3 Global Value Chain Analysis
- 8.1.4 Market Dynamics (DROs)
- 8.2 Sources & References
- 8.3 List of Tables & Figures
- 8.4 Primary Insights
- 8.5 Data Pack
- 8.6 Glossary of Terms
 中东和非洲生物肥料市场份额分析、行业趋势、统计数据和成长预测(2026-2031 年)
 生物肥料市场-全球产业规模、份额、趋势、机会和预测,按类型、形态、作物类型、应用、微生物类型、地区和竞争格局划分,2020-2030年预测
 基于固氮菌的生物肥料市场—按产品类型、作物类型、应用方法、分销管道、最终用户和配方类型划分—2025-2032年全球预测生物肥料市场按类型、形态、应用方法、作物类型和分销管道划分-2025-2032年全球预测
 2032年生物肥料市场预测:按产品类型、微生物、作物类型、形态、应用和地区进行的全球分析
 2025年全球生物肥料市场报告
 生物肥料市场机会、成长动力、产业趋势分析及2025-2034年预测固氮菌生物肥料市场机会、成长动力、产业趋势分析及2025-2034年预测
 全球固氮菌生物肥料市场2025年全球根瘤菌肥料市场报告