


 |
市场调查报告书
商品编码
1690184
美国低温运输物流:市场占有率分析、产业趋势、统计数据、成长预测(2025-2030 年)US Cold Chain Logistics - Market Share Analysis, Industry Trends & Statistics, Growth Forecasts (2025 - 2030) |
||||||
※ 本网页内容可能与最新版本有所差异。详细情况请与我们联繫。
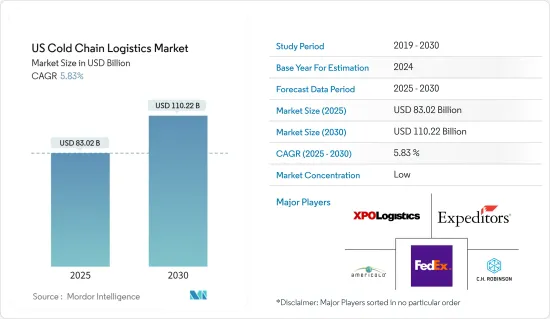
2025年美国低温运输物流市场规模预估为830.2亿美元,预估至2030年将达1,102.2亿美元,预测期间(2025-2030年)的复合年增长率为5.83%。
关键亮点
- 新冠疫情导致国内电子零售业和包装食品饮料消费大幅成长,刺激了对冷藏保管空间和物流的需求。网路杂货店的兴起,其中生鲜食品和冷冻食品的订单占很大比例,也支撑了市场需求。政府对温度敏感产品的生产和供应的严格监管也极大地促进了该市场的发展。
- 然而,运输和仓储行业的劳动力短缺、高能源需求以及低温运输物流业务对环境的负面影响是可能限制市场成长的一些挑战。为了应对与高能源需求和负面环境影响相关的挑战,一些公司正在实施增加运作低温运输基础设施所需能源的解决方案。
- 参与企业正在采用人工智慧 (AI)、机器学习、物联网 (IoT)、机器人、穿戴式装置和配送中心自动化等技术来提高业务效率、降低营运成本并提供更好的客户体验。
- 外包在更广泛的工业物流市场中呈现上升趋势,截至 2022 年 5 月,第三方物流 (3PL) 供应商占总租赁活动的 34%,高于 2021 年同期的 30%。由于成本和技术系统更复杂,这种趋势在冷藏行业尤其普遍。
- 根据美国农业部 (USDA) 的数据,目前美国72% 的冷藏容量委託给公共冷藏 (PRW) 公司,低于五年前的 75%。其余 28% 为内部低温运输营运商,高于五年前的 25%。
- 生鲜产品的进口、包括生技药品在内的製药业的成长、冷冻食品消费的成长以及药品温度监控的规定是推动美国低温运输物流市场需求的一些因素。
美国低温运输物流市场趋势
增加墨西哥进口的生鲜食品
- 美国每年从世界各地进口价值220亿美元的生鲜食品,并接收来自125多个国家的生鲜食品。该国32%的新鲜蔬菜和55%的新鲜水果都从其他国家进口。
- 拉丁美洲和北美之间空运的货物几乎70%都是生鲜产品。美国进口的新鲜水果和蔬菜77%来自墨西哥,另有11%来自加拿大。
- 墨西哥是美国最大的农业贸易伙伴,2022年进口总额(进口+出口)为719亿美元。其中,美国对墨西哥的农产品出口额为285亿美元,自墨西哥的进口额为434亿美元。从墨西哥进口的主要农产品是水果和蔬菜;事实上,美国进口的44%的水果和48%的蔬菜都来自墨西哥。
- 根据美国农业部(USDA)的数据,2022年,美国从墨西哥进口的农产品中有83.6%是蔬菜、水果、饮料和蒸馏酒。
- 2022年,美国从墨西哥进口了价值187亿美元的农产品,包括新鲜、冷冻和加工的水果、蔬菜和坚果。其中超过 98% 的进口产品透过墨西哥与德克萨斯、新墨西哥州、亚利桑那州和加利福尼亚州之间的陆路港口进入美国。如果只考虑新鲜水果和蔬菜,其占所有水果和蔬菜的近89%,总进口额将达到166亿美元。
- 这些进口货物由 590,906 辆 40,000 磅卡车运输。美国从墨西哥进口的新鲜水果和蔬菜约有 55% 透过德克萨斯州陆港抵达,共 325,467 卡车,价值 116 亿美元。
冷冻食品日益流行
- 根据美国冷冻食品协会 (AFFI) 的报告,2022 年冷冻食品销售额将成长 8.6%,达到 722 亿美元。在此期间,单位销售额有所下降,但仍比疫情前的水平高出 5%。
- 2018 年至 2022 年间,冷冻食品销售额成长了 194 亿美元,凸显了疫情对此类别成长的影响。虽然冷冻食品的美元销售额自 2018 年以来持续上升,但 2021 年和 2022 年的单位销售额分别下降了 3.2% 和 5.1%,凸显了通货膨胀对冷冻食品成本的潜在影响。
- 儘管销量有所下降,但与疫情前的水平相比仍然很高,显示对冷冻食品的需求持续存在。冷冻加工肉品、冷冻零食和冷冻鱼贝类尤其如此,与疫情前的水平相比,这些产品的销量均出现了两数的增长。
- AFFI 的最新研究表明,超过四分之一的消费者比三年前更多地购买冷冻水果和蔬菜,因为他们认识到这些食品的许多好处。冷冻水果和蔬菜使家庭和人群更容易增加农产品消费量并减少食物废弃物。美国冷冻蔬果整体普及率较高,94%的家庭购买冷冻蔬果。
- 截至 2022 年 6 月 26 日的 52 週内,美国冷冻水果和蔬菜销售额达到 71 亿美元,产品产量达到 39 亿磅,比疫情前水准高出 2.71 亿磅。该领域最畅销的产品是普通蔬菜、马铃薯、洋葱和水果,销售额分别为 29 亿美元、23 亿美元和 15 亿美元。
美国低温运输物流产业概况
美国低温运输物流市场高度分散,支持温度敏感货物的国内和国际运输。随着太阳能製冷装置、多温度卡车和货运优化软体的引入,发展正在进行中。联邦快递、XPO Logistics、Total Quality Logistics 和 Americold Logistics 等国际和本地公司都已进入该市场。
其他福利
- Excel 格式的市场预测 (ME) 表
- 3个月的分析师支持
目录
第一章 引言
- 调查结果
- 调查前提
- 研究范围
第二章调查方法
- 分析方法
- 研究阶段
第三章执行摘要
第四章 市场动态与洞察
- 当前市场状况
- 市场动态
- 驱动程式
- 製药业的成长
- 增加墨西哥进口的生鲜食品
- 冷冻食品越来越受欢迎
- 限制因素
- 低温运输作业所产生的排放
- 劳动力短缺
- 机会
- 采用节能解决方案
- 网路杂货业务的兴起
- 驱动程式
- 产业吸引力-波特五力分析
- 买家/消费者的议价能力
- 供应商的议价能力
- 新进入者的威胁
- 替代品的威胁
- 竞争对手之间的竞争
- 洞察技术趋势和自动化
- 深入了解政府法规和倡议
- 产业价值链/供应链分析
- 专注于气候和温度控制存储
- 排放标准和法规对低温运输产业的影响
- COVID-19对市场的影响
第五章市场区隔
- 按服务
- 贮存
- 运输
- 附加价值服务(速冻、贴标、库存管理等)
- 按温度类型
- 冷藏
- 《冷冻》
- 常温
- 按应用
- 水果和蔬菜
- 乳製品(牛奶、奶油、起司、冰淇淋等)
- 鱼、肉和水产品
- 加工食品
- 医疗药品
- 烘焙和糖果
- 其他的
第六章竞争格局
- 市场集中度概览
- 公司简介
- FedEx
- XPO Logistics
- CH Robinson Worldwide
- JB Hunt
- Expeditors
- Total Quality Logistics
- Americold Logistics
- Burris Logistics
- Prime Inc.
- Lineage Logistics
- Arc Best
- Stevens Transport
- DHL Supply Chain
- United States Cold Storage
- DB Schenker
- Covenant Transportation Services*
第七章:市场的未来
第 8 章 附录
The US Cold Chain Logistics Market size is estimated at USD 83.02 billion in 2025, and is expected to reach USD 110.22 billion by 2030, at a CAGR of 5.83% during the forecast period (2025-2030).
Key Highlights
- The COVID-19 pandemic significantly boosted the domestic e-retailing sector and the consumption of processed foods and beverages, pushing the demand for refrigerated storage spaces and logistics. The rise of online groceries, with a significant share of orders for perishables and frozen foods, is also supporting the market demand. The market has also benefitted significantly from the stringent government regulation toward the production and supply of temperature-sensitive products.
- However, the labor shortages in the transportation and warehousing sector, high energy requirements, and the negative environmental impact of the cold chain logistics operations are some of the challenges that may limit the market growth. To tackle the challenges regarding the high energy requirements and negative environmental impact, some companies are introducing solutions that increase the energy required to run the cold chain infrastructure.
- Technologies like Artificial Intelligence (AI), Machine Learning, Internet of Things (IoT), Robotics, Ware, and distribution center automation are being incorporated by players to increase the efficiency of their operations, reduce operational costs, and provide better customer experience.
- More outsourcing is occurring throughout the broader industrial logistics market, with third-party logistics (3PL) providers accounting for 34% of total leasing activity in 2022 through May, up from 30% in the same period of 2021. This trend is particularly common in the cold storage industry due to costs and more complex technology systems.
- According to the US Department of Agriculture (USDA), 72% of the refrigerated storage capacity in the US is outsourced to public refrigerated warehouse (PRW) companies, down from 75% five years ago. The remaining 28% includes in-house cold chain operators, up from 25% five years ago.
- The perishables imports, pharmaceutical industry growth, including the biologics sector, increasing consumption of frozen foods, pharmaceutical temperature monitoring regulations, etc., are the demand drivers for the cold chain logistics market in the United States.
US Cold Chain Logistics Market Trends
Rising fresh produce imports from Mexico
- The United States imports over USD 22 billion worth of fresh produce annually from all over the globe and receives fresh produce from over 125 countries. Thirty-two percent of the country's fresh vegetables and fifty-five percent of its fresh fruit are imported from other countries.
- Almost 70% of all goods shipped via air freight between Latin America and North America consist of perishable products. Seventy-seven percent of the fresh fruits and vegetables imported by the United S come from Mexico, with an additional 11% from Canada.
- Mexico is the largest agricultural trading partner for the United States, totaling USD 71.9 billion (imports plus exports) in 2022. US agricultural exports to Mexico totaled USD 28.5 billion, while imports from Mexico totaled USD 43.4 billion. The main agricultural products imported from Mexico are fruits and vegetables; in fact, 44% of the fruits and 48% of the vegetables imported by the US are from Mexico.
- In 2022, 83.6% of US agricultural imports from Mexico consisted of vegetables, fruit, beverages, or distilled spirits, according to the US Department of Agriculture (USDA).
- The United States imported USD 18.7 billion of produce from Mexico in 2022, including fresh, frozen, and processed fruits, vegetables, and nuts. Just over 98% of these imports entered the United States through land ports between Mexico and Texas, New Mexico, Arizona, and California. When considering only fresh fruits and vegetables, which constitute nearly 89% of the total produce, imports totaled USD 16.6 billion.
- These imports were shipped in 590,906 forty-thousand-pound truckloads. Approximately 55% of the US fresh fruit and vegetable imports from Mexico entered through Texas land ports, arriving in 325,467 truckloads worth USD 11.6 billion.
Increasing popularity of frozen foods
- The American Frozen Food Institute (AFFI) reported that frozen food sales increased 8.6% to USD 72.2 billion in 2022. Unit sales decreased during that time but remained 5% above pre-pandemic levels.
- Between 2018 and 2022, frozen food dollar sales increased a whopping USD 19.4 billion, underlining the impact of the pandemic on the category's growth. While frozen food dollar sales have consistently climbed since 2018, unit sales decreased in both 2021 and 2022 by 3.2% and 5.1%, respectively, highlighting the potential impact of inflation on frozen food costs.
- Despite the decreases, unit sales remain elevated compared to pre-pandemic levels, indicating continued demand for frozen foods. This is particularly true for frozen processed meat, frozen snacks, and seafood, which have seen double-digit increases in unit sales compared to pre-pandemic levels.
- A new survey from AFFI finds that more than a quarter of shoppers are buying more frozen fruits and vegetables than three years ago and identify many benefits with these foods. Frozen fruits and vegetables help make it easier for households and demographic groups to increase their produce consumption and reduce food waste. Overall, penetration in the United States is high, with 94% of American households buying frozen fruits and vegetables.
- The sales of frozen fruits and vegetables in the United States reached USD 7.1 billion over the 52 weeks ending June 26, 2022, and product volume were 271 million pounds above pre-pandemic levels at 3.9 billion pounds. The top products within the segment were plain vegetables, potatoes, onions, and fruit, with sales of USD 2.9 billion, USD 2.3 billion, and USD 1.5 billion, respectively.
US Cold Chain Logistics Industry Overview
The cold chain logistics market of the United States is highly fragmented, aiding the domestic as well as international transportation of temperature-sensitive goods. It is undergoing developments with the introduction of solar-powered refrigerated units, multi-temperature trucks, and freight optimization software. International and local players like FedEx, XPO Logistics, Total Quality Logistics, Americold Logistics and many such companies are operational in the market.
Additional Benefits:
- The market estimate (ME) sheet in Excel format
- 3 months of analyst support
TABLE OF CONTENTS
1 INTRODUCTION
- 1.1 Study Deliverables
- 1.2 Study Assumptions
- 1.3 Scope of the Study
2 RESEARCH METHODOLOGY
- 2.1 Analysis Methodology
- 2.2 Research Phases
3 EXECUTIVE SUMMARY
4 MARKET DYNAMICS AND INSIGHTS
- 4.1 Current Market Scenario
- 4.2 Market Dynamics
- 4.2.1 Drivers
- 4.2.1.1 PHARMACEUTICAL INDUSTRY GROWTH
- 4.2.1.2 RISING FRESH PRODUCE IMPORTS FROM MEXICO
- 4.2.1.3 INCREASING POPULARITY OF FROZEN FOODS
- 4.2.2 Restraints
- 4.2.2.1 EMISSIONS FROM COLD CHAIN OPERATIONS
- 4.2.2.2 LABOUR SHORTAGES
- 4.2.3 Opportunities
- 4.2.3.1 Adopting energy-efficient solutions
- 4.2.3.2 rise of online grocery business
- 4.2.1 Drivers
- 4.3 Industry Attractiveness - Porter's Five Forces Analysis
- 4.3.1 Bargaining Power of Buyers/Consumers
- 4.3.2 Bargaining Power of Suppliers
- 4.3.3 Threat of New Entrants
- 4.3.4 Threat of Substitute Products
- 4.3.5 Intensity of Competitive Rivalry
- 4.4 Insights on Technological Trends and Automation
- 4.5 Insights on Government Regulations and Initiatives
- 4.6 Industry Value Chain/Supply Chain Analysis
- 4.7 Spotlight on Ambient/Temperature-controlled Storage
- 4.8 Impact of Emission Standards and Regulations on Cold Chain Industry
- 4.9 Impact of Covid-19 on the Market
5 MARKET SEGMENTATION
- 5.1 By Services
- 5.1.1 Storage
- 5.1.2 Transportation
- 5.1.3 Value-added Services (Blast Freezing, Labeling, Inventory Management, etc.)
- 5.2 By Temperature Type
- 5.2.1 Chilled
- 5.2.2 Frozen
- 5.2.3 Ambient
- 5.3 By Application
- 5.3.1 Fruits and Vegetables
- 5.3.2 Dairy Products (Milk, Butter, Cheese, Ice Cream, Etc.)
- 5.3.3 Fish, Meat, and Seafood
- 5.3.4 Processed Food
- 5.3.5 Healthcare & Pharmaceuticals
- 5.3.6 Bakery and Confectionary
- 5.3.7 Other Applications
6 COMPETITIVE LANDSCAPE
- 6.1 Market Concentration Overview
- 6.2 Company Profiles
- 6.2.1 FedEx
- 6.2.2 XPO Logistics
- 6.2.3 CH Robinson Worldwide
- 6.2.4 JB Hunt
- 6.2.5 Expeditors
- 6.2.6 Total Quality Logistics
- 6.2.7 Americold Logistics
- 6.2.8 Burris Logistics
- 6.2.9 Prime Inc.
- 6.2.10 Lineage Logistics
- 6.2.11 Arc Best
- 6.2.12 Stevens Transport
- 6.2.13 DHL Supply Chain
- 6.2.14 United States Cold Storage
- 6.2.15 DB Schenker
- 6.2.16 Covenant Transportation Services*
7 FUTURE OF THE MARKET
8 APPENDIX
 农产品低温运输物流市场预测至2032年:按组件、温度范围、运输方式、储存基础设施、技术、最终用户和地区分類的全球分析
 全球冷链物流市场:依技术、温度类型、解决方案、产业和地区划分-市场规模、产业趋势、机会分析和预测(2025-2033 年)
 北美低温运输市场规模、份额和趋势分析报告:按类型、包装、设备、应用、国家和细分市场预测(2025-2033 年)
 冷链物流设备市场机会、成长驱动因素、产业趋势分析及预测(2025-2034年)
 低温运输市场按温度范围、设备类型、服务模式、最终用户和分销管道划分-2025-2032 年全球预测低温运输物流市场(按服务类型、温度范围和最终用途)-全球预测,2025-2032全球低温运输物流自动化市场:2032 年预测 - 按组件、温度范围、应用、最终用户和地区分析
 电动车、电气化与冷链运输:机会在哪里?
 2025年低温运输全球市场报告2032 年低温运输物流市场预测:按类型、温度类型、应用和地区进行的全球分析