


 |
市场调查报告书
商品编码
1693410
美国建筑胶合剂和密封剂:市场占有率分析、行业趋势和统计数据、成长预测(2025-2030 年)United States Construction Adhesives & Sealants - Market Share Analysis, Industry Trends & Statistics, Growth Forecasts (2025 - 2030) |
||||||
价格
※ 本网页内容可能与最新版本有所差异。详细情况请与我们联繫。
简介目录
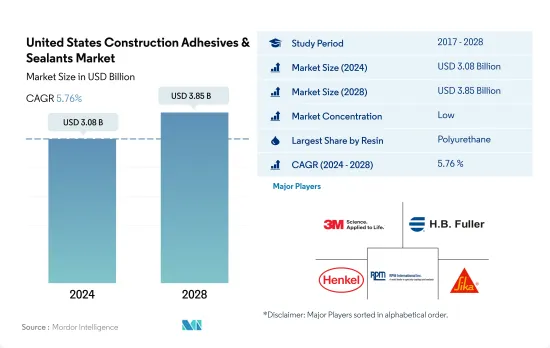
预计 2024 年美国建筑胶合剂和密封剂市场规模将达到 30.8 亿美元,到 2028 年将达到 38.5 亿美元,预测期内(2024-2028 年)的复合年增长率为 5.76%。
预计到 2028 年,新建筑面积将达到 71 亿平方英尺,未来几年对黏合剂和密封剂的需求将很高
- 树脂赋予黏合剂必要的物理和化学特性,例如抗紫外线、耐热性和抗拉强度,使其能够用于特定的用途。预计新建筑面积将从 2021 年的 56 亿平方英尺增加到 2022 年的 58 亿平方英尺。
- 受经济復苏、原料供应趋于正常化以及美国生产设施重启(2020 年受新冠疫情影响)的推动,2021 年建筑胶合剂和密封剂销量快速增长 5.12%。疫情期间,美国各地封锁,生产设施关闭,导致黏合剂消耗量下降。
- 这些黏合剂分为各种树脂,其中聚氨酯和丙烯酸树脂黏合剂广泛用于建筑应用。这些黏合剂被称为结构性黏着剂,具有 5-8 N/mm2 范围内的高抗拉强度。此黏合剂用于黏合装饰地板材料和瓷砖、将金属部件封装在混凝土中、将门框黏合到砖石上以及许多其他应用。
- 美国是建筑胶合剂和密封剂消费量最高的国家,由于住宅和非住宅建筑需求不断增长,2021 年占北美市场的近 70%。预计到 2028 年,该国的新建筑面积将达到 71 亿平方英尺,从而推动预测期内对建筑黏合剂和密封剂的需求。
美国建筑胶合剂和密封剂市场趋势
政府投资,例如「重组美国基础设施」(INFRA)计划,将在 2022 年至 2026 年期间提供 72.5 亿美元的资金,将促进国内建设。
- 美国是北美最大的建筑业国家。该国人均GDP为25,350美元,预计到2022年将成长与前一年同期比较%。建筑业占美国GDP的近4.2%。影响美国建筑业的因素包括新投资、住宅和非住宅建筑以及政府政策。
- 2021 年公共部门建筑支出降至 3,463 亿美元,而 2020 年为 3,612 亿美元。然而,私部门建筑支出在 2021 年有所增加,达到 12,454 亿美元,而 2020 年为 11,079 亿美元。
- 1 月建筑许可中的住宅建筑(包括私人住宅)经季节性已调整的的年率为 189.9 万套。这比12月修订后的188.5万辆高出0.7%,比2021年1月的188.3万辆高出0.8%。
- 2022年3月,美国运输部(USDOT)宣布,重组美国基础设施(INFRA)计画将在2022-2026财政年度向各州和地区拨款72.5亿美元,用于建设具有国家或地区重要性的多式联运货运和公路计划。预计这些因素将在预测期内活性化美国的建设活动。
美国建筑胶合剂和密封剂产业概况
美国建筑胶合剂和密封剂市场分散,前五大公司占34.57%的市场。该市场的主要企业有:3M、HB Fuller Company、Henkel AG & Co. KGaA、RPM International Inc. 和 Sika AG(按字母顺序排列)
其他福利
- Excel 格式的市场预测 (ME) 表
- 3个月的分析师支持
目录
第一章执行摘要和主要发现
第二章 报告要约
第三章 引言
- 研究假设和市场定义
- 研究范围
- 调查方法
第四章 产业主要趋势
- 最终用户趋势
- 建筑与施工
- 法律规范
- 美国
- 价值炼和通路分析
第五章市场区隔
- 树脂
- 丙烯酸纤维
- 氰基丙烯酸酯
- 环氧树脂
- 聚氨酯
- 硅胶
- VAE・EVA
- 其他树脂
- 科技
- 热熔胶
- 反应性
- 密封剂
- 溶剂型
- 水性
第六章 竞争格局
- 重大策略倡议
- 市场占有率分析
- 商业状况
- 公司简介
- 3M
- Arkema Group
- Dow
- HB Fuller Company
- Henkel AG & Co. KGaA
- Huntsman International LLC
- Illinois Tool Works Inc.
- MAPEI SpA
- RPM International Inc.
- Sika AG
第七章:CEO面临的关键策略问题
第 8 章 附录
- 全球黏合剂和密封剂产业概况
- 概述
- 五力分析框架(产业吸引力分析)
- 全球价值链分析
- 驱动因素、限制因素和机会
- 资讯来源及延伸阅读
- 图片列表
- 关键见解
- 资料包
- 词彙表
简介目录
Product Code: 92467
The United States Construction Adhesives & Sealants Market size is estimated at 3.08 billion USD in 2024, and is expected to reach 3.85 billion USD by 2028, growing at a CAGR of 5.76% during the forecast period (2024-2028).
High demand for adhesives and sealants is expected in the coming years with new construction reaching 7.1 billion square feet by 2028
- Resins impart the required physical and chemical properties such as UV resistance, heat resistance, and tensile strength in the adhesives that can be used in specific applications. New construction is expected to grow to 5.8 billion square feet in 2022 from 5.6 billion in 2021.
- The construction adhesives and sealants recorded a sudden growth of 5.12% in volume in 2021 due to the economic recovery, regularization of raw materials supply, and reopening of production facilities in the United States, which the COVID-19 pandemic impacted in 2020. During the pandemic, lockdowns across the country caused the shutdown of production facilities and a decline in the consumption of adhesives.
- These adhesives are segmented into different resins, of which polyurethane and acrylic resin-based adhesives are widely used in construction applications. These adhesives are known as structural adhesives, which offer high tensile strength in the range of 5 to 8 N/mm2. They are used in construction to bond decorative floor coverings and ceramic tiles adhesives, seal metal parts into concrete, bond a door frame into masonry, and many other applications.
- The United States accounts for the highest consumption of construction adhesives and sealants, accounting for nearly 70% of the North American market in 2021 because of the rising demand for residential and non-residential construction. The new building and constructions in the country are expected to reach 7.1 billion square feet by 2028 and, thus, drive the demand for construction adhesives and sealants over the forecast period.
United States Construction Adhesives & Sealants Market Trends
Government's' investments such as the Infrastructure for Rebuilding America (INFRA) program of USD 7.25 billion for FY 2022-2026 to increase construction in the country
- The United States is the largest country for construction activities in the North American region. The country had a GDP of USD 25,350 per capita, with an expected growth rate of 3.7% Y-o-Y in 2022. The construction industry contributes nearly 4.2% of the US GDP. The factors affecting the US construction industry are new investments, residential & non-residential constructions, government policies, and others.
- Public sector construction spending declined in 2021, recording USD 346.3 billion compared to USD 361.2 billion in 2020. However, the private sector construction spending increased in 2021 and was valued at USD 1,245.4 billion in 2021 compared to USD 1107.9 billion in 2020.
- The residential house construction, including privately-owned housing units authorized by building permits in January, was at a seasonally adjusted annual rate of 1,899,000. This was 0.7% above the revised December rate of 1,885,000 and 0.8% above the January 2021 rate of 1,883,000.
- In March 2022, the US Department of Transportation (USDOT) announced that the Infrastructure for Rebuilding America (INFRA) program would distribute USD 7.25 billion for FY 2022-2026 to all states and regions to build multimodal freight and highway projects of national or regional significance. These factors are expected to boost construction activities in the United States over the forecast period.
United States Construction Adhesives & Sealants Industry Overview
The United States Construction Adhesives & Sealants Market is fragmented, with the top five companies occupying 34.57%. The major players in this market are 3M, H.B. Fuller Company, Henkel AG & Co. KGaA, RPM International Inc. and Sika AG (sorted alphabetically).
Additional Benefits:
- The market estimate (ME) sheet in Excel format
- 3 months of analyst support
TABLE OF CONTENTS
1 EXECUTIVE SUMMARY & KEY FINDINGS
2 REPORT OFFERS
3 INTRODUCTION
- 3.1 Study Assumptions & Market Definition
- 3.2 Scope of the Study
- 3.3 Research Methodology
4 KEY INDUSTRY TRENDS
- 4.1 End User Trends
- 4.1.1 Building and Construction
- 4.2 Regulatory Framework
- 4.2.1 United States
- 4.3 Value Chain & Distribution Channel Analysis
5 MARKET SEGMENTATION (includes market size in Value in USD and Volume, Forecasts up to 2028 and analysis of growth prospects)
- 5.1 Resin
- 5.1.1 Acrylic
- 5.1.2 Cyanoacrylate
- 5.1.3 Epoxy
- 5.1.4 Polyurethane
- 5.1.5 Silicone
- 5.1.6 VAE/EVA
- 5.1.7 Other Resins
- 5.2 Technology
- 5.2.1 Hot Melt
- 5.2.2 Reactive
- 5.2.3 Sealants
- 5.2.4 Solvent-borne
- 5.2.5 Water-borne
6 COMPETITIVE LANDSCAPE
- 6.1 Key Strategic Moves
- 6.2 Market Share Analysis
- 6.3 Company Landscape
- 6.4 Company Profiles (includes Global Level Overview, Market Level Overview, Core Business Segments, Financials, Headcount, Key Information, Market Rank, Market Share, Products and Services, and Analysis of Recent Developments).
- 6.4.1 3M
- 6.4.2 Arkema Group
- 6.4.3 Dow
- 6.4.4 H.B. Fuller Company
- 6.4.5 Henkel AG & Co. KGaA
- 6.4.6 Huntsman International LLC
- 6.4.7 Illinois Tool Works Inc.
- 6.4.8 MAPEI S.p.A.
- 6.4.9 RPM International Inc.
- 6.4.10 Sika AG
7 KEY STRATEGIC QUESTIONS FOR ADHESIVES AND SEALANTS CEOS
8 APPENDIX
- 8.1 Global Adhesives and Sealants Industry Overview
- 8.1.1 Overview
- 8.1.2 Porter's Five Forces Framework (Industry Attractiveness Analysis)
- 8.1.3 Global Value Chain Analysis
- 8.1.4 Drivers, Restraints, and Opportunities
- 8.2 Sources & References
- 8.3 List of Tables & Figures
- 8.4 Primary Insights
- 8.5 Data Pack
- 8.6 Glossary of Terms
02-2729-4219
+886-2-2729-4219
 全球建筑黏合剂市场规模、份额、趋势和成长分析报告(2026-2034年)
 2026年全球建筑黏合剂市场报告
 建筑黏合剂市场-全球产业规模、份额、趋势、机会及预测(按树脂类型、技术、最终用途产业、地区和竞争格局划分,2021-2031年)
 地板黏合剂市场按类型、形态、基材、应用方法、包装、最终用途和通路划分-2026-2032年全球预测
 建筑密封胶市场规模、份额和成长分析(按树脂类型、技术、功能、应用、最终用途产业和地区划分)-产业预测,2026-2033年
 建筑黏合剂市场规模、份额和成长分析(按类型、应用和地区划分)—2026-2033年产业预测建筑密封胶市场按产品类型、应用、最终用途和技术划分-2025-2032年全球预测建筑胶合剂市场(按产品类型和应用)-全球预测,2025-2032全球建筑胶合剂和密封剂市场(2024-2031)
 建设用黏剂市场,规模,占有率,产业分析报告:类别树脂,各技术,各用途,各地区,2025年~2034年的市场预测
▼