


 |
市场调查报告书
商品编码
1693508
中国特种肥料市场占有率分析、产业趋势与统计、成长预测(2025-2030年)China Specialty Fertilizer - Market Share Analysis, Industry Trends & Statistics, Growth Forecasts (2025 - 2030) |
||||||
※ 本网页内容可能与最新版本有所差异。详细情况请与我们联繫。
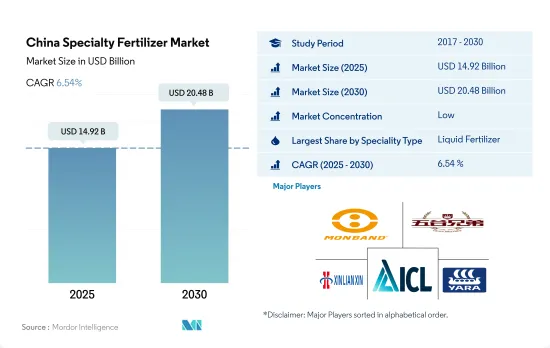
预计 2025 年中国特种肥料市场规模将达到 149.2 亿美元,到 2030 年预计将达到 204.8 亿美元,预测期内(2025-2030 年)的复合年增长率为 6.54%。
透过有效供应特定营养物质并减少施肥频率来推动市场发展
- 2022年专用肥市场将占中国化肥市场规模的约3.8%。专用肥市场占有率较小,主要原因是农民对其效能认知度较低,且与传统专用肥相比成本较高。
- 2022年,水溶性肥料占中国专用肥料市场规模的51.0%。水溶性肥料的主导地位很大程度上得益于灌溉农业的普及和灌溉设备的技术进步。灌溉是该国小型灌溉系统中最普遍的应用方法。预计这将在 2023 年至 2030 年期间推动水溶性肥料市场的发展。
- 2022年液体肥料将占中国专用肥料市场规模的48.8%。液体肥料易于被植物吸收,与灌溉或喷洒配合使用可以减少人事费用。叶面喷布是液体肥料最常使用的方法。
- 控制释放肥料将占据中国专用肥料市场容量的第二大市场占有率,到2022年将占0.1%。控制释放肥料的市场占有率主要归功于其能够提供长达六个月的养分的潜力。营养成分的流失也非常小。然而,在预测期内,农民意识的提高可能会增加控制释放肥料的市场占有率。
- 近年来,我国水溶肥产业在现代农业发展的利多政策和大力投入下,凭藉其在减少化肥、水、工、成本、提高产量和品质等方面的优势,蓬勃发展。
中国特种肥料市场趋势
种植面积的扩大是由于粮食需求的增加以及该国实现主食自给自足的目标。
- 中国田间作物种植面积将从2018年的1.266亿公顷略微增加到2022年的1.278亿公顷,占全国耕地总面积的70.8%。 2022年,玉米将占最大份额,为34.2%,其次是大米,为23.6%,小麦为18.3%。预计耕地面积的增加将推动国内化肥需求。
- 中国通常将田间作物生产分为两个季节:春季和夏季(4月至9月)和冬季。春季作物主要有早玉米、早稻、早小麦、棉花等,冬季作物主要有冬小麦、油菜等。但稻米和玉米是中国农业的重点作物,占中国粮食产量的三分之一。中国是世界主要稻米生产国之一,预计2022年,稻米种植面积将达3,000万公顷,稻米产量将达2.1亿吨。水稻主产区分布在黑龙江、湖南、江西、湖北、江苏、四川、广西、广东、湖南等地。受丰收的支撑,中国2022-23年度玉米产量预计将达到2.772亿吨,与前一年同期比较增加460万吨。玉米主产区为东北黑龙江、吉林、内蒙古三省。
- 中国的种植季节以春季为主,但在六月和七月的炎热月份面临一些挑战。米是数百万人的主食,该地区的高温和有限的降雨加剧了土壤中的矿物质消耗,因此必须增加施肥量。这些干旱条件也导致作物产量下降。
全球约28%的氧化亚氮排放排放中国的农业用地。
- 主要营养素可改善植物体内的酵素活性等生化过程,促进植物细胞生长。主要营养素的缺乏会影响植物的健康、发育和作物产量。 2022年田间作物氮、钾、磷平均施用量为159.9公斤/公顷。田间作物主要养分平均施用量为氮65.23%、磷28.07%、钾6.68%。
- 氮是第一大主要营养素,因为它是植物新陈代谢所必需的,也是叶绿素和胺基酸的组成部分。平均施氮量为279.65公斤/公顷。其次是钾肥,施用量为每公顷 105.3 公斤,磷肥,施用量为每公顷 94.9 公斤(2022 年)。人们认为,地表水和地下水受到氮和磷的污染是由于没有向农民提供有关施肥率的建议不足所造成的。全球农业用地氧化亚氮排放有28%来自中国。
- 2022年,平均养分施用量最高的作物是棉花(255.41公斤/公顷)、小麦(232.25公斤/公顷)、玉米(198.44公斤/公顷)和水稻(157.76公斤/公顷)。中国是世界上最大的棉花生产国、消费国和进口国,预计2022年棉花产量将达640万吨。全球消费的棉花约有20%产自中国,其中84%产自新疆维吾尔自治区。
- 扩大农业生产对于满足不断增长的人口的需求至关重要,因此,预计2023年至2030年间田间作物的主要养分施用量将会增加。
中国特种肥料产业概况
中国专用肥市场细分化,前五大企业市占率合计为5.01%。该市场的主要企业包括河北蒙邦水溶肥、河北沃泽五丰生物科技、河南心连心化工集团有限公司、以色列化工集团有限公司、雅苒国际有限公司等。
其他福利
- Excel 格式的市场预测 (ME) 表
- 3个月的分析师支持
目录
第一章执行摘要和主要发现
第二章 报告要约
第三章 引言
- 研究假设和市场定义
- 研究范围
- 调查方法
第四章 产业主要趋势
- 主要作物种植面积
- 田间作物
- 园艺作物
- 平均养分施用量
- 微量营养素
- 田间作物
- 园艺作物
- 主要营养素
- 田间作物
- 园艺作物
- 次要宏量营养素
- 田间作物
- 园艺作物
- 微量营养素
- 灌溉农田
- 法律规范
- 价值炼和通路分析
第五章市场区隔
- 专业类型
- CRF
- 聚合物涂层
- 聚合硫涂层
- 其他的
- 液体肥料
- SRF
- 水溶性
- CRF
- 施肥方式
- 受精
- 叶面喷布
- 土壤
- 作物类型
- 田间作物
- 园艺作物
- 草坪和观赏植物
第六章竞争格局
- 关键策略趋势
- 市场占有率分析
- 商业状况
- 公司简介
- Grupa Azoty SA(Compo Expert)
- Haifa Group
- Hebei Monband Water Soluble Fertilizer Co. Ltd
- Hebei Sanyuanjiuqi Fertilizer Co., Ltd.
- Hebei Woze Wufeng Biological Technology Co., Ltd
- Henan XinlianXin Chemicals Group Company Limited
- ICL Group Ltd
- Sociedad Quimica y Minera de Chile SA
- Yara International ASA
- Zouping Hongyun BIoTechnology Co., Ltd.
第七章:CEO面临的关键策略问题
第 8 章 附录
- 世界概况
- 概述
- 五力分析框架
- 全球价值链分析
- 市场动态(DRO)
- 资讯来源及延伸阅读
- 图片列表
- 关键见解
- 数据包
- 词彙表
The China Specialty Fertilizer Market size is estimated at 14.92 billion USD in 2025, and is expected to reach 20.48 billion USD by 2030, growing at a CAGR of 6.54% during the forecast period (2025-2030).
Efficiency in providing particular nutrients and reducing the number of fertilizations may drive the market
- The specialty fertilizer market accounted for about 3.8% of the market volume of the Chinese fertilizer market in 2022. The minimal market share of the specialty fertilizers market is majorly attributed to the less awareness among farmers regarding efficiency and higher cost compared to conventional specialty fertilizers.
- Water-soluble fertilizers accounted for 51.0% of the Chinese specialty fertilizer market volume in 2022. The dominance of water-soluble fertilizers is majorly due to the growing adoption of irrigation agriculture and technical advancements in irrigation equipment. Fertigation is the most popular application mode used in the country's micro irrigation systems. This will drive the soluble fertilizers market during 2023-2030
- Liquid fertilizers accounted for 48.8% of the Chinese specialty fertilizer market volume in 2022. Liquid fertilizers are more easily absorbed by plants and can be used with irrigation or spraying by reducing labor costs. Foliar is the most popular method used by the liquid fertilizer application.
- Controlled-release fertilizers accounted for the next largest market share in the Chinese specialty fertilizer market volume, accounting for 0.1% in 2022. The market share of controlled-release fertilizers is mainly due to their potential to provide nutrients for up to six months. The loss of nutrients is also very low. However, rising awareness among farmers can increase the market share of controlled-release fertilizers in the forecast period.
- In recent years, the soluble fertilizer industry in China has boomed because of its advantages in reducing fertilizer usage, water, labor, and cost, and increasing yield and quality, accompanied by favorable policies for modern agriculture development and substantial investment.
China Specialty Fertilizer Market Trends
The expansion of the cultivation area is driven by increasing demand for food and the country's goal to achieve self-sufficiency in staple food
- China's cultivation area for field crops expanded marginally from 126.6 million hectares in 2018 to 127.8 million hectares in 2022, representing 70.8% of the nation's total cultivated land. In 2022, corn claimed the largest share at 34.2%, trailed by rice and wheat at 23.6% and 18.3% respectively. This uptick in cultivation area is projected to drive up fertilizer demand in the country.
- China typically divides its field crop production into two seasons: spring/summer (April-September) and winter. Spring crops encompass early corn, early rice, early wheat, and cotton, while winter crops focus on winter wheat and rapeseed. Rice and corn, however, take precedence in China's agricultural landscape, accounting for a third of the nation's grain output. As the world's leading rice producer, China dedicated 30 million hectares to rice farming in 2022, yielding a bountiful 210 million tonnes. Key rice-growing regions span Heilongjiang, Hunan, Jiangxi, Hubei, Jiangsu, Sichuan, Guangxi, Guangdong, and Yunnan. China's corn production for 2022-23 was projected to hit 277.2 million tonnes, a 4.6 million-tonne increase from the previous year, buoyed by a successful harvest. The primary corn belts lie in the northeastern provinces of Heilongjiang, Jilin, and Inner Mongolia.
- While spring dominates China's cropping calendar, it faces some challenges during the hotter months of June and July. Given rice's status as a dietary staple for millions, the region's high temperatures and limited rainfall exacerbate mineral depletion in the soil, necessitating higher fertilizer application. These arid conditions can also curtail crop yields.
About 28% of global nitrous oxide emissions from croplands are from China's agricultural lands
- Primary nutrients improve biochemical processes like enzyme activity in plants and promote plant cell growth. Primary nutrient deficiencies can impact plant health, development, and crop production output. The average application rate of nitrogen, potassium, and phosphorus collectively in field crops was 159.9 kg/hectare in 2022. The average primary nutrient application in field crops included 65.23% nitrogen, 28.07% phosphorous, and 6.68% potassium.
- Nitrogen ranks first in primary nutrients, as it is essential for plant metabolism and is a component of chlorophyll and amino acids. Nitrogen had an average application rate of 279.65 kg/hectare. This was followed by potash at 105.3 kg/hectare and phosphorous at 94.9 kg/hectare in 2022. The contamination of surface and groundwater with nitrogen and phosphorus has been considered a result of inadequate advice given to farmers regarding fertilizer application rates. About 28% of global nitrous oxide emissions from croplands are from China's agricultural lands.
- In 2022, the crops with the highest average nutrient application rates were cotton (255.41 kg/hectare), wheat (232.25 kg/hectare), corn (198.44 kg/hectare), and rice (157.76 kg/hectare). In 2022, cotton production amounted to 6.4 million metric tons, making China the world's largest producer, consumer, and importer of cotton. Around 20% of the cotton consumed worldwide is produced in China, and 84% of that production comes from Xinjiang.
- To meet the demands of a growing population, boosting crop production is essential; as a result, the application of primary nutrients in field crops is expected to grow from 2023 to 2030.
China Specialty Fertilizer Industry Overview
The China Specialty Fertilizer Market is fragmented, with the top five companies occupying 5.01%. The major players in this market are Hebei Monband Water Soluble Fertilizer Co. Ltd, Hebei Woze Wufeng Biological Technology Co., Ltd, Henan XinlianXin Chemicals Group Company Limited, ICL Group Ltd and Yara International ASA (sorted alphabetically).
Additional Benefits:
- The market estimate (ME) sheet in Excel format
- 3 months of analyst support
TABLE OF CONTENTS
1 EXECUTIVE SUMMARY & KEY FINDINGS
2 REPORT OFFERS
3 INTRODUCTION
- 3.1 Study Assumptions & Market Definition
- 3.2 Scope of the Study
- 3.3 Research Methodology
4 KEY INDUSTRY TRENDS
- 4.1 Acreage Of Major Crop Types
- 4.1.1 Field Crops
- 4.1.2 Horticultural Crops
- 4.2 Average Nutrient Application Rates
- 4.2.1 Micronutrients
- 4.2.1.1 Field Crops
- 4.2.1.2 Horticultural Crops
- 4.2.2 Primary Nutrients
- 4.2.2.1 Field Crops
- 4.2.2.2 Horticultural Crops
- 4.2.3 Secondary Macronutrients
- 4.2.3.1 Field Crops
- 4.2.3.2 Horticultural Crops
- 4.2.1 Micronutrients
- 4.3 Agricultural Land Equipped For Irrigation
- 4.4 Regulatory Framework
- 4.5 Value Chain & Distribution Channel Analysis
5 MARKET SEGMENTATION (includes market size in Value in USD and Volume, Forecasts up to 2030 and analysis of growth prospects)
- 5.1 Speciality Type
- 5.1.1 CRF
- 5.1.1.1 Polymer Coated
- 5.1.1.2 Polymer-Sulfur Coated
- 5.1.1.3 Others
- 5.1.2 Liquid Fertilizer
- 5.1.3 SRF
- 5.1.4 Water Soluble
- 5.1.1 CRF
- 5.2 Application Mode
- 5.2.1 Fertigation
- 5.2.2 Foliar
- 5.2.3 Soil
- 5.3 Crop Type
- 5.3.1 Field Crops
- 5.3.2 Horticultural Crops
- 5.3.3 Turf & Ornamental
6 COMPETITIVE LANDSCAPE
- 6.1 Key Strategic Moves
- 6.2 Market Share Analysis
- 6.3 Company Landscape
- 6.4 Company Profiles
- 6.4.1 Grupa Azoty S.A. (Compo Expert)
- 6.4.2 Haifa Group
- 6.4.3 Hebei Monband Water Soluble Fertilizer Co. Ltd
- 6.4.4 Hebei Sanyuanjiuqi Fertilizer Co., Ltd.
- 6.4.5 Hebei Woze Wufeng Biological Technology Co., Ltd
- 6.4.6 Henan XinlianXin Chemicals Group Company Limited
- 6.4.7 ICL Group Ltd
- 6.4.8 Sociedad Quimica y Minera de Chile SA
- 6.4.9 Yara International ASA
- 6.4.10 Zouping Hongyun Biotechnology Co., Ltd.
7 KEY STRATEGIC QUESTIONS FOR FERTILIZER CEOS
8 APPENDIX
- 8.1 Global Overview
- 8.1.1 Overview
- 8.1.2 Porter's Five Forces Framework
- 8.1.3 Global Value Chain Analysis
- 8.1.4 Market Dynamics (DROs)
- 8.2 Sources & References
- 8.3 List of Tables & Figures
- 8.4 Primary Insights
- 8.5 Data Pack
- 8.6 Glossary of Terms
 晶体肥料市场:2026-2032年全球市场预测(依养分类型、应用、形态、作物类型、作用机制与销售管道)特种肥料市场:2026-2032年全球市场预测(依产品形式、作物类型、养分类型、施用方法、通路和最终用途划分)
 特种肥料市场规模、份额和趋势分析报告:按技术、作物、类型、应用、地区和细分市场预测(2026-2033 年)
 特种肥料:市场占有率分析、产业趋势与统计、成长预测(2026-2031)
 全球特种肥料市场规模、份额、趋势和成长分析报告(2026-2034)
 2026年全球特种肥料市场报告
 特种肥料市场规模、份额和成长分析(按类型、技术、形态、作物类型、应用方法和地区划分)-2026-2033年产业预测全球特种肥料市场规模(依特种肥料类型、作物类型、施用方法、区域范围及预测)
 特种肥料市场 - 全球产业规模、份额、趋势、机会和预测,按作物类型、形式、应用方式、技术、地区和竞争细分,2020-2030 年中东和非洲特种肥料:市场占有率分析、行业趋势和统计数据、成长预测(2025-2030 年)