


 |
市场调查报告书
商品编码
1693529
北美特种肥料:市场占有率分析、行业趋势和成长预测(2025-2030 年)North America Specialty Fertilizer - Market Share Analysis, Industry Trends & Statistics, Growth Forecasts (2025 - 2030) |
||||||
※ 本网页内容可能与最新版本有所差异。详细情况请与我们联繫。
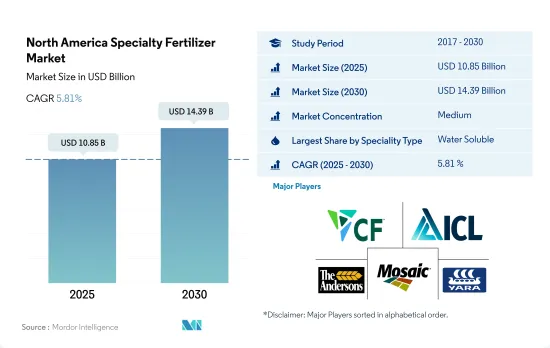
北美特种肥料市场规模预计在 2025 年为 108.5 亿美元,预计到 2030 年将达到 143.9 亿美元,预测期内(2025-2030 年)的复合年增长率为 5.81%。
由于营养等级范围广泛且施用方法多样,水溶性肥料占据市场主导地位。
- 2022年,水溶性肥料占据北美专用肥料市场最大份额,为47.9%。这些肥料的需求取决于特定需求的营养等级和施用方法,例如叶面喷布或施肥。值得注意的是,2022 年叶面喷布占了 45.2% 的市场份额,而灌溉占了 54.8% 的市场份额。
- 液体肥料在 2022 年占据第二大市场占有率,为 45.9%。该地区耕地土壤的酸性导致人们越来越青睐硝酸铵等液体特殊肥料。这些肥料不仅有助于维持土壤 pH 值,还能解决氮浸出问题,这是环保人士和农民共同面临的重大问题。
- 虽然控制释放肥料的市场占有率较小,仅为4.9%,但在精密农业中发挥着至关重要的作用。它们为作物提供精准的营养,是现代农业的重要组成部分。
- 2022年,美国占据北美特种肥料市场的很大份额,为67.1%。在美国市场,水溶性肥料和液体肥料占主导地位。同样,在研究期间,美国也表现出对叶面喷布和灌溉的强烈偏好,这一趋势归因于该国发达的灌溉基础设施。
- 由于灌溉系统的发展以及对田间作物、草皮和观赏植物的需求不断增长,美国特种肥料市场预计在未来几年内将会成长。
美国凭藉其发达的农业体系和全国广大的耕地面积占据市场主导地位。
- 2022年,美国在北美特种肥料市场占据主导地位。水溶性肥料的市场占有率为48.0%,液体肥料的市占率为46.3%,控释肥的市占率为5.1%。缓释肥料的份额较小,仅0.6%,主要原因是其在小麦、玉米和谷类等主要作物中的应用有限。然而,预计该国微灌溉系统的发展将推动该领域的成长。 2022年,美国拥有1,830万公顷灌溉农地。
- 在北美,加拿大拥有第二大特种肥料市场,其次是美国。预计 2023 年至 2030 年间加拿大特种肥料市场的复合年增长率将达到 6.4%。
- 2022年墨西哥占北美特种肥料市场的16.0%。具体来说,预计2022年墨西哥田间作物将达220万吨,2030年将增加至280万吨。
- 2019 年和 2020 年,特种肥料的价值和数量均显着下降,主要原因是新冠疫情导致的供应链中断。然而,由于原物料价格上涨和需求增加,市场在 2021 年有所復苏。
- 精准技术的日益普及预计将推动特种肥料的需求。精密农业强调最佳施肥,非常适合控制释放和缓效等特殊肥料的特性。因此,北美特种肥料市场预计在 2023 年至 2030 年期间的复合年增长率将达到 5.6%。
北美特种肥料市场趋势
补贴和其他政府财政支持有助于扩大田间作物
- 北美的农场种植多种作物,以田间作物为主。玉米、棉花、水稻、大豆和小麦是该地区的主要田间作物。美国、加拿大和墨西哥对该地区的农业生产贡献巨大。 2022 年,田间作物约占北美总种植面积的 97.6%,其中谷物和油籽占据市场主导地位。
- 从国家来看,美国占据市场主导地位,研究期间的作物总种植面积为 1.357 亿公顷。农田作物和园艺占种植面积的大部分,2022年的比例分别为97.2%和2.8%。然而,在2018-2019年,恶劣的环境条件导致德克萨斯和休士顿等地区发生严重洪灾,导致作物种植面积大幅减少。
- 传统上,该区是美国中西部的一个地区,涵盖印第安纳州西部、伊利诺伊州、爱荷华州、密苏里州、内布拉斯加州东部和堪萨斯州东部的大部分地区,玉米和大豆是主要作物。它也是大米的主要出口国,该地区的水稻种植主要集中在四个主要地区。该地区田间作物的市场潜力不断增加,加上政府资金投入和保护力度加大,预计将增加该地区田间作物的种植面积。
在主要养分中,氮肥是田间作物施用量较大的肥料,相当于每公顷229.8公斤。
- 水稻、玉米、小麦和油菜籽等田间作物是该地区主要的作物消耗作物。 2022年,水稻将消耗约140.85公斤/公顷的主要养分,其次是油菜籽/油菜籽,消耗量为118.40公斤/公顷。预计谷物作物将消耗最多的氮肥。由于该地区的集约化耕作,土壤养分耗尽,需要大量肥料来补充生长。
- 在主要养分中,氮肥施用量最大,2022年约占74.0%,相当于田间作物229.8公斤/公顷。然而,氮缺乏是该地区最常见的作物营养问题之一。因此,大部分的氮供应是透过土壤施用提供。当施入土壤时,氮会转化为矿物质硝酸盐,以便植物轻鬆吸收。油菜籽是一种主要的氮消耗作物,在美国广泛种植。
- 油菜籽可用于提取润滑油、液压油和塑胶等工业用油。施肥率取决于土壤品质和降雨量,但氮需求量为每英亩 100 至 150 磅。磷肥和钾肥的施用量也因土壤而异。然而,根据 AgMRC 的建议施用量为每英亩 0-80 磅和每英亩 0-140 磅。
- 由于初级养分是各种作物养分的主要来源,由于土壤贫化和淋溶,其施用量预计将逐年大幅增加。
北美特种肥料产业概况
北美特种肥料市场适度整合,前五大公司占63.41%的市占率。该市场的主要企业包括 CF Industries Holdings, Inc.、ICL Group Ltd、The Andersons Inc.、The Mosaic Company、Yara International ASA 等。
其他福利
- Excel 格式的市场预测 (ME) 表
- 3个月的分析师支持
目录
第一章执行摘要和主要发现
第二章 报告要约
第三章 引言
- 研究假设和市场定义
- 研究范围
- 调查方法
第四章 产业主要趋势
- 主要作物种植面积
- 田间作物
- 园艺作物
- 平均养分施用量
- 微量营养素
- 田间作物
- 园艺作物
- 主要营养素
- 田间作物
- 园艺作物
- 次要宏量营养素
- 田间作物
- 园艺作物
- 微量营养素
- 灌溉农田
- 法律规范
- 价值炼和通路分析
第五章市场区隔
- 特殊类型
- CRF
- 聚合物涂层
- 聚合硫涂层
- 其他的
- 液体肥料
- SRF
- 水溶性
- CRF
- 施肥方式
- 受精
- 叶面喷布
- 土壤
- 作物类型
- 田间作物
- 园艺作物
- 草坪和观赏植物
- 原产地
- 加拿大
- 墨西哥
- 美国
- 北美其他地区
第六章竞争格局
- 关键策略趋势
- 市场占有率分析
- 商业状况
- 公司简介
- CF Industries Holdings, Inc.
- Haifa Group
- ICL Group Ltd
- Koch Industries Inc.
- Nutrien Ltd.
- Sociedad Quimica y Minera de Chile SA
- The Andersons Inc.
- The Mosaic Company
- Wilbur-Ellis Company LLC
- Yara International ASA
第七章:CEO面临的关键策略问题
第 8 章 附录
- 世界概况
- 概述
- 五力分析框架
- 全球价值链分析
- 市场动态(DRO)
- 资讯来源及延伸阅读
- 图片列表
- 关键见解
- 数据包
- 词彙表
The North America Specialty Fertilizer Market size is estimated at 10.85 billion USD in 2025, and is expected to reach 14.39 billion USD by 2030, growing at a CAGR of 5.81% during the forecast period (2025-2030).
The market is dominated by water-soluble fertilizers due to the wide range of nutrient grades and different application methods
- In 2022, water-soluble fertilizers held the maximum share of the North American specialty fertilizers market, accounting for 47.9%. The demand for these fertilizers is influenced by nutrient grades and application modes, such as foliar or fertigation, based on specific needs. Notably, in 2022, foliar application accounted for 45.2% of the market, while fertigation claimed 54.8%.
- Liquid fertilizers secured the second-largest market share at 45.9% in 2022. Given the acidic nature of arable lands in the region, there's a growing preference for liquid-based specialty fertilizers like ammonium nitrate. These fertilizers not only help maintain soil pH levels but also address concerns about nitrogen leaching, a key issue for both environmentalists and farmers.
- Controlled-release fertilizers, with a modest 4.9% market share, play a pivotal role in precision farming. By ensuring crops receive precise nutrient dosages, they have become indispensable in modern agriculture.
- In 2022, the US accounted for a significant chunk, 67.1%, of the North American specialty fertilizer market. Water-soluble and liquid fertilizers were the dominant segments in the US market. Likewise, the study period revealed a strong preference for foliar and fertigation modes in the US, a trend attributed to the country's well-established irrigation infrastructure.
- With a well-developed irrigation system and growing demand for field crops, turfs, and ornamentals, the specialty fertilizer market in the US is poised for growth in the coming years.
The United States dominates the market due to well-developed agricultural systems and larger cultivation area across the country
- In 2022, the United States held a dominant position in the North American specialty fertilizers market. Water-soluble fertilizers, liquid fertilizers, and CRF accounted for 48.0%, 46.3%, and 5.1% of the market share, respectively. Slow-release fertilizers had a smaller share of 0.6%, primarily due to limited adoption in major crops like wheat, maize, and cereals. However, the segment's growth is expected to be bolstered by the country's developing micro-irrigation system. In 2022, the total irrigated cropland in the US spanned 18.3 million hectares.
- In North America, Canada has the second-largest specialty fertilizer market, followed by the United States. During 2023-2030, the country's specialty fertilizer market is anticipated to register a CAGR of 6.4%.
- Mexico held a 16.0% share of the North American specialty fertilizers market in 2022. Notably, Mexico's field crops saw a volume of 2.2 million metric tons in 2022, with an expected rise to 2.8 million metric tons by 2030.
- Specialty fertilizers experienced a notable decline in both value and volume in 2019 and 2020, primarily due to disruptions in the supply chain caused by the COVID-19 pandemic. However, the market rebounded in 2021, driven by rising raw material prices and increased demand.
- The growing adoption of precision technologies is expected to drive the demand for specialty fertilizers. Precision farming, which emphasizes optimal fertilizer application, aligns well with the characteristics of specialty fertilizers like controlled-release and slow-release variants. As a result, the North American specialty fertilizers market is projected to register a CAGR of 5.6% during 2023-2030.
North America Specialty Fertilizer Market Trends
Financial support by the government, such as subsidies, has contributed to the expansion of field crops
- A wide array of crops are grown on North American farms, mainly covering field crops. Corn, cotton, rice, soybean, and wheat are some of the dominating field crops across the region. The United States, Canada, and Mexico are major contributors to the region's agricultural output. In 2022, field crops covered around 97.6% of the overall cultivation in North America, with cereals and oilseeds dominating the market.
- By country, the United States dominates the market, covering 135.7 million hectares of the overall area under crop cultivation during the study period. Field crops and horticulture covered the majority of the area and accounted for shares of 97.2% and 2.8% in 2022. However, between 2018 and 2019, the country witnessed a significant dip in crop acreages majorly due to unfavorable environmental conditions resulting in heavy floods in areas like Texas and Houston.
- The largest crop cultivated is corn, the majority of which is grown in a region known as the 'Corn Belt,' It is a traditional area in the midwestern United States, roughly covering western Indiana, Illinois, Iowa, Missouri, eastern Nebraska, and eastern Kansas, in which corn (maize) and soybeans are the dominant crops. Also, it is the major rice exporter, and rice cultivation in the region is mainly concentrated within four regions, with three in the South and one in California. The increased market potential for the region's field crops, coupled with increased government funding and protection, is anticipated to positively drive the area under field crop cultivation in the region.
Among all the primary nutrients, nitrogen is applied in a higher quantity to field crops, which is equivalent to 229.8 kg/hectare
- Field crops, such as rice, corn/maize, wheat, and rapeseed/canola, are some of the major primary nutrient-consuming crops in the region. In 2022, about 140.85 kg/hectare of primary nutrients were consumed by rice, followed by 118.40 kg/hectare consumed by rapeseed/canola. Cereals are anticipated to consume the maximum amount of nitrogen-based fertilizers. As they are grown intensively in the region, they deplete the nutrients in the soil and require more fertilizers to supplement growth.
- Among all the primary nutrients, nitrogen is applied in a higher quantity, accounting for about 74.0% in 2022, equivalent to 229.8 kg/hectare for field crops. Nitrogen deficiency, however, is one of the most prevalent crop nutrient problems in the region. Hence, most of the nitrogen supplement is provided through soil application. When applied to the soil, nitrogen is converted to mineral nitrate for the plants to absorb easily. Rapeseed, the major nitrogen-consuming crop, is widely grown in the United States.
- Rapeseed is used for extracting oil for industrial applications, like lubricants, hydraulic fluids, and plastics. While fertilizer usage is based on soil quality and rainfall potential, its nitrogen requirements range from 100 to 150 lbs./acre. Phosphorus and potassium fertility rates also vary from soil to soil. However, the recommended rates range from 0 to 80 lbs./acre and 0 to 140 lbs./acre, as per the AgMRC.
- Since primary nutrients are the major sources of nutrients for various crops, their application rates are anticipated to grow significantly over the years due to soil depletion, leaching, etc.
North America Specialty Fertilizer Industry Overview
The North America Specialty Fertilizer Market is moderately consolidated, with the top five companies occupying 63.41%. The major players in this market are CF Industries Holdings, Inc., ICL Group Ltd, The Andersons Inc., The Mosaic Company and Yara International ASA (sorted alphabetically).
Additional Benefits:
- The market estimate (ME) sheet in Excel format
- 3 months of analyst support
TABLE OF CONTENTS
1 EXECUTIVE SUMMARY & KEY FINDINGS
2 REPORT OFFERS
3 INTRODUCTION
- 3.1 Study Assumptions & Market Definition
- 3.2 Scope of the Study
- 3.3 Research Methodology
4 KEY INDUSTRY TRENDS
- 4.1 Acreage Of Major Crop Types
- 4.1.1 Field Crops
- 4.1.2 Horticultural Crops
- 4.2 Average Nutrient Application Rates
- 4.2.1 Micronutrients
- 4.2.1.1 Field Crops
- 4.2.1.2 Horticultural Crops
- 4.2.2 Primary Nutrients
- 4.2.2.1 Field Crops
- 4.2.2.2 Horticultural Crops
- 4.2.3 Secondary Macronutrients
- 4.2.3.1 Field Crops
- 4.2.3.2 Horticultural Crops
- 4.2.1 Micronutrients
- 4.3 Agricultural Land Equipped For Irrigation
- 4.4 Regulatory Framework
- 4.5 Value Chain & Distribution Channel Analysis
5 MARKET SEGMENTATION (includes market size in Value in USD and Volume, Forecasts up to 2030 and analysis of growth prospects)
- 5.1 Speciality Type
- 5.1.1 CRF
- 5.1.1.1 Polymer Coated
- 5.1.1.2 Polymer-Sulfur Coated
- 5.1.1.3 Others
- 5.1.2 Liquid Fertilizer
- 5.1.3 SRF
- 5.1.4 Water Soluble
- 5.1.1 CRF
- 5.2 Application Mode
- 5.2.1 Fertigation
- 5.2.2 Foliar
- 5.2.3 Soil
- 5.3 Crop Type
- 5.3.1 Field Crops
- 5.3.2 Horticultural Crops
- 5.3.3 Turf & Ornamental
- 5.4 Country
- 5.4.1 Canada
- 5.4.2 Mexico
- 5.4.3 United States
- 5.4.4 Rest of North America
6 COMPETITIVE LANDSCAPE
- 6.1 Key Strategic Moves
- 6.2 Market Share Analysis
- 6.3 Company Landscape
- 6.4 Company Profiles
- 6.4.1 CF Industries Holdings, Inc.
- 6.4.2 Haifa Group
- 6.4.3 ICL Group Ltd
- 6.4.4 Koch Industries Inc.
- 6.4.5 Nutrien Ltd.
- 6.4.6 Sociedad Quimica y Minera de Chile SA
- 6.4.7 The Andersons Inc.
- 6.4.8 The Mosaic Company
- 6.4.9 Wilbur-Ellis Company LLC
- 6.4.10 Yara International ASA
7 KEY STRATEGIC QUESTIONS FOR FERTILIZER CEOS
8 APPENDIX
- 8.1 Global Overview
- 8.1.1 Overview
- 8.1.2 Porter's Five Forces Framework
- 8.1.3 Global Value Chain Analysis
- 8.1.4 Market Dynamics (DROs)
- 8.2 Sources & References
- 8.3 List of Tables & Figures
- 8.4 Primary Insights
- 8.5 Data Pack
- 8.6 Glossary of Terms
 特种肥料市场:2026-2032年全球市场预测(依产品形式、作物类型、养分类型、施用方法、通路和最终用途划分)
 特种肥料:市场占有率分析、产业趋势与统计、成长预测(2026-2031)
 全球特种肥料市场规模、份额、趋势和成长分析报告(2026-2034)
 2026年全球特种肥料市场报告
 特种肥料市场规模、份额和成长分析(按类型、技术、形态、作物类型、应用方法和地区划分)-2026-2033年产业预测全球特种肥料市场规模(依特种肥料类型、作物类型、施用方法、区域范围及预测)
 特种肥料市场 - 全球产业规模、份额、趋势、机会和预测,按作物类型、形式、应用方式、技术、地区和竞争细分,2020-2030 年中东和非洲特种肥料:市场占有率分析、行业趋势和统计数据、成长预测(2025-2030 年)中国特种肥料市场占有率分析、产业趋势与统计、成长预测(2025-2030年)南美洲特种肥料:市场占有率分析、产业趋势与统计、成长预测(2025-2030 年)