


 |
市场调查报告书
商品编码
1693526
特种肥料:市场占有率分析、产业趋势与统计、成长预测(2025-2030)Specialty Fertilizer - Market Share Analysis, Industry Trends & Statistics, Growth Forecasts (2025 - 2030) |
||||||
※ 本网页内容可能与最新版本有所差异。详细情况请与我们联繫。
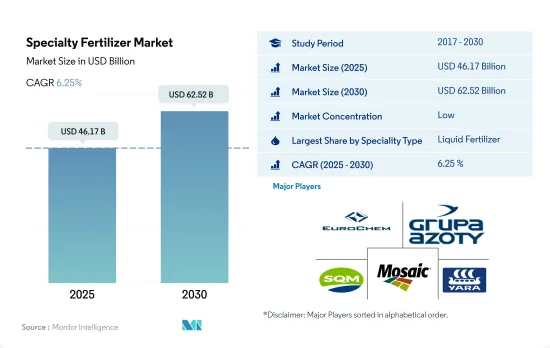
预计特种肥料市场规模到 2025 年将达到 461.7 亿美元,到 2030 年将达到 625.2 亿美元,预测期内(2025-2030 年)的复合年增长率为 6.25%。
对高效肥料的需求推动了对特殊肥料的需求
- 2022年,全球特种肥料市场约占全球肥料市场总量的12.0%,价值约517.4亿美元。在研究期间,市场以 83.8% 的强劲速度成长。这种快速成长是由于人们对环境问题的日益关注,预计这将推动特种肥料市场在 2023 年至 2030 年期间的发展。
- 水溶性肥料约占整个市场的44.6%,其中亚太地区和北美占据主导地位。到2022年,这些地区将占全球水溶肥料市场的70.3%以上。
- 预计2023年至2030年缓释肥料的消费量将大幅增加,复合年增率为3.7%。同时,这些肥料的市场价值预计将实现6.1%的复合年增长率。这种变化是由于农民和种植者认识到缓释肥料在提高作物产量和品质的同时最大限度地减少对环境的影响的好处而发生的。
- 此外,易于施用、分布均匀和成本效益导致人们明显转向使用液体肥料。这些因素将推动液体肥料市场的发展,预计 2023 年至 2030 年期间的复合年增长率为 5.8%。
- 预测期内推动全球特种肥料市场发展的关键因素是肥料利用效率的提高、特种肥料采用量的激增以及农田对喷灌和微灌系统的偏好日益增长。
亚太地区是特种肥料最大的市场。
- 2022年,亚太地区占据特种肥料市场最大份额,占总价值的45.8%。田间作物占该地区专用肥料消费量的83.5%。紧随其后的是园艺作物,占 13.7%,而草皮和观赏作物落后,占不到 1%。
- 中国在农地作物领域处于领先地位,占专用肥料市场份额的43.04%。紧随其后的是印度(17.15%)、日本(16.35%)和印尼(5.67%)。 2022年,澳洲占据亚太特种肥料市场4.07%的份额。
- 北美成为全球第二大特种肥料市场,2022年价值约125.9亿美元,占总价值的24.8%。在北美市场,田间作物占消费量的86.8%,草坪和观赏作物占7.6%,园艺作物6.2%。
- 南美洲约占全球特种肥料市场的18.48%,2021年价值约30.4亿美元。巴西是南美洲市场的主导者,2022年其特殊肥料市场价值将达17.5亿美元,消费量将达200万吨。
- 2020 年,特种肥料市场产量和价值均持续成长,但因新冠疫情导致供应链中断而下降。
- 由于全球过度使用化肥,人们对化肥污染的担忧日益加剧,这将在未来几年推动全球特种化肥市场的发展。
全球特种肥料市场趋势
田间作物是世界各地的主食,未来几年田间作物的种植面积将会扩大。
- 全球农业部门面临许多挑战。根据联合国预测,到 2050 年,世界人口可能会超过 90 亿。人口成长可能会对农业造成过度压力,而由于劳动力短缺和都市化进程加剧导致农地面积减少,农业产量已经下降。根据联合国粮食及农业组织预测,2050年,全球70%的人口预计将居住在城市。随着全球可耕地面积减少,农民需要使用更多的肥料来提高作物产量。
- 亚太地区是世界上最大的农产品生产地区。农业对该地区的经济至关重要,约占总劳动力的 20%。该地区以田间作物种植为主,约占全部区域作物总面积的95%以上。水稻、小麦和玉米是该地区的主要田间作物,约占2022年总耕地面积的24.3%。
- 北美洲是世界上可耕地面积第二大的地区。北美的农场种植多种作物,以田间作物为主。根据美国农业部的数据,玉米、棉花、稻米、大豆和小麦是该地区的主要田间作物。美国占市场主导地位,2022 年占北美作物种植总面积的 46.2%。 2017 年至 2019 年间,该国作物种植面积大幅下降,主因是不利的环境条件导致德克萨斯州和休士顿等地区发生严重洪灾。
在所有养分中,主要养分(N、P、K)的平均施用量最高,为164.3 kg/ha。
- 玉米、菜籽、棉花、高粱、水稻、小麦和大豆是全球主要的营养密集型作物。这些作物主要养分施用量如下:玉米:230.57 公斤/公顷,油菜籽:255.75 公斤/公顷,菜籽:172.70 公斤/公顷,高粱:158.46 公斤/公顷,水稻:154.49 公斤/公顷,高粱:135.35 公斤/公顷,水稻:154.49 公斤/公顷公顷。大量营养素对作物生长至关重要,因为它们促进植物的重要代谢过程,并有助于细胞、细胞膜和叶绿素等重要植物组织的形成。磷对于种植优质作物尤其重要,而钾在激活植物生长所必需的酵素方面起着关键作用。
- 全球田间作物氮、钾、磷的平均施用量为164.31公斤/公顷。使用最广泛的基肥是氮肥,平均施用量为224.6公斤/公顷,其次是钾肥,平均施用量为150.3公斤/公顷。磷排在第三位,2022 年的平均施用率为 117.9 公斤/公顷。
- 2022年油菜氮肥施用量最高,为347.4kg/ha,玉米/玉米磷肥施用量最高,为156.3kg/ha。菜籽钾施用量最高,为每公顷 248.6 公斤。全球田间作物种植面积不断增加,其中南美洲和亚太地区的成长最为显着。这些地区正成为化肥的潜在市场。欧洲和北美等发展中地区以及营养不良地区越来越多地使用特种肥料来提高其功效。预计这些趋势将在 2023 年至 2030 年期间推动主要营养肥料市场的发展。
特种肥料行业概况
专用肥市场分散,前五大企业占30.38%。该市场的主要企业有:EuroChem Group、Grupa Azoty SA(Compo Expert)、Sociedad Quimica y Minera de Chile SA、The Mosaic Company 和 Yara International ASA(按字母顺序排列)
其他福利
- Excel 格式的市场预测 (ME) 表
- 3个月的分析师支持
目录
第一章执行摘要和主要发现
第二章 报告要约
第三章 引言
- 研究假设和市场定义
- 研究范围
- 调查方法
第四章 产业主要趋势
- 主要作物种植面积
- 田间作物
- 园艺作物
- 平均养分施用量
- 微量营养素
- 田间作物
- 园艺作物
- 主要营养素
- 田间作物
- 园艺作物
- 次要宏量营养素
- 田间作物
- 园艺作物
- 微量营养素
- 灌溉农田
- 法律规范
- 价值炼和通路分析
第五章市场区隔
- 特殊类型
- CRF
- 聚合物涂层
- 聚合硫涂层
- 其他的
- 液体肥料
- SRF
- 水溶性
- CRF
- 施肥方式
- 受精
- 叶面喷布
- 土壤
- 作物类型
- 田间作物
- 园艺作物
- 草坪和观赏植物
- 地区
- 亚太地区
- 澳洲
- 孟加拉
- 中国
- 印度
- 印尼
- 日本
- 巴基斯坦
- 菲律宾
- 泰国
- 越南
- 其他亚太地区
- 欧洲
- 法国
- 德国
- 义大利
- 荷兰
- 俄罗斯
- 西班牙
- 乌克兰
- 英国
- 其他欧洲国家
- 中东和非洲
- 奈及利亚
- 沙乌地阿拉伯
- 南非
- 土耳其
- 其他中东和非洲地区
- 北美洲
- 加拿大
- 墨西哥
- 美国
- 北美其他地区
- 南美洲
- 阿根廷
- 巴西
- 南美洲其他地区
- 亚太地区
第六章 竞争格局
- 关键策略趋势
- 市场占有率分析
- 商业状况
- 公司简介
- Coromandel International Ltd.
- EuroChem Group
- Grupa Azoty SA(Compo Expert)
- Haifa Group
- Kingenta Ecological Engineering Group Co., Ltd.
- Koch Industries Inc.
- Nutrien Ltd.
- Sociedad Quimica y Minera de Chile SA
- The Mosaic Company
- Yara International ASA
第七章:CEO面临的关键策略问题
第 8 章 附录
- 世界概况
- 概述
- 五力分析框架
- 全球价值链分析
- 市场动态(DRO)
- 资讯来源及延伸阅读
- 图片列表
- 关键见解
- 资料包
- 词彙表
The Specialty Fertilizer Market size is estimated at 46.17 billion USD in 2025, and is expected to reach 62.52 billion USD by 2030, growing at a CAGR of 6.25% during the forecast period (2025-2030).
The demand for high nutrient-efficient fertilizers is driving the demand for specialty fertilizers
- In 2022, the global specialty fertilizers market represented approximately 12.0% of the total global fertilizer market, with a valuation of around USD 51.74 billion. Over the study period, the market witnessed a robust growth of 83.8%. This surge can be attributed to the rising environmental concerns, which are anticipated to propel the specialty fertilizer market during 2023-2030.
- Water-soluble fertilizers, constituting roughly 44.6% of the market value, are predominantly dominated by Asia-Pacific and North America. Together, these regions commanded over 70.3% of the global water-soluble fertilizer market in 2022.
- Between 2023 and 2030, the consumption of slow-release fertilizers is projected to witness a notable uptick, with a CAGR of 3.7%. Simultaneously, the market value for these fertilizers is expected to register a CAGR of 6.1%. This shift is driven by farmers and growers recognizing the benefits of slow-release fertilizers in enhancing crop yields and quality while minimizing environmental impact.
- Moreover, there is a discernible shift toward liquid fertilizers, driven by their ease of application, uniform distribution, and cost-effectiveness. These factors are projected to fuel the liquid fertilizer market, with an estimated CAGR of 5.8% during 2023-2030.
- Key drivers for the global specialty fertilizer market in the forecast period include heightened fertilizer-use efficiency, a surge in specialty fertilizer adoption, and an increasing preference for sprinklers or micro-irrigation systems across agricultural lands.
Asia-Pacific region is the largest market for specialty fertilizers.
- In 2022, Asia-Pacific held the largest share of the specialty fertilizer market, accounting for 45.8% of its total value. Field crops dominated the region's specialty fertilizer consumption, representing 83.5% of the volume. Horticultural crops followed at 13.7%, while turf and ornamental crops lagged behind at under 1%.
- China led the pack in the field crops segment, commanding 43.04% of the specialty fertilizer market's value. India trailed at 17.15%, with Japan at roughly 16.35%, and Indonesia at 5.67%. Australia secured a 4.07% share of the Asia-Pacific specialty fertilizer market in 2022.
- North America emerged as the second-largest specialty fertilizer market globally, capturing 24.8% of its total value, amounting to approximately USD 12.59 billion in 2022. Field crops dominated the North American market, accounting for 86.8% of the consumption, while turf and ornamental crops held a 7.6% share, and horticultural crops claimed 6.2%.
- South America contributed around 18.48% to the global specialty fertilizer market, valued at roughly USD 3.04 billion in 2021. Brazil stood out as the dominant player in the South American market, with its specialty fertilizer market reaching USD 1.75 billion in 2022, and a consumption volume of 2.0 million metric tons.
- The specialty fertilizer market witnessed a consistent growth in volume and value, barring a dip in 2020 due to supply chain disruptions triggered by the COVID-19 pandemic.
- Mounting concerns over fertilizer pollution, stemming from global overuse, are poised to propel the global specialty fertilizer market in the coming years.
Global Specialty Fertilizer Market Trends
Field crops being the staple food across the globe, area under field crops will grow in the coming years.
- The global agricultural sector is facing many challenges. According to the UN, the world population will likely exceed nine billion by 2050. This population growth may overburden the agricultural industry, which is already experiencing an output loss due to a lack of laborers and the shrinkage of agricultural fields caused by rising urbanization. According to the Food and Agriculture Organization, 70% of the global population is expected to live in cities by 2050. Due to the global loss of arable land, farmers now need to utilize more fertilizers to increase crop yields.
- Asia-Pacific is the world's largest producer of agricultural products. Agriculture is critical to the region's economy, as it employs about 20% of the total available workforce. Field crop cultivation dominates the region, accounting for about more than 95% of the total crop area in the region. Rice, wheat, and corn are the major field crops produced in the region, together accounting for about 24.3% of the total crop area in 2022.
- North America is the second-largest arable region of the total agricultural land area in the world. Diverse varieties of crops are grown in North American farms, primarily field crops. As per the USDA, corn, cotton, rice, soybean, and wheat are among the region's dominant field crops. The United States dominated the market by accounting for 46.2% of the total area under crop cultivation in 2022 of the overall North American area under cultivation. Crop acreage in the country fell significantly between 2017 and 2019, primarily due to unfavorable environmental conditions that resulted in heavy floods in areas such as Texas and Houston.
Among all nutrients, primary nutrients (N, P, and K) have the highest average application rate at 164.3 kg/hectares.
- Corn/maize, rapeseed/canola, cotton, sorghum, rice, wheat, and soybean rank among the primary nutrient-intensive crops globally. The application rates for primary nutrients in these crops were as follows: corn/maize - 230.57 kg/ha, rapeseed/canola - 255.75 kg/ha, cotton - 172.70 kg/ha, sorghum - 158.46 kg/ha, rice - 154.49 kg/ha, wheat - 135.35 kg/ha, and soybean - 120.97 kg/ha. Primary nutrient fertilizers are pivotal for crop growth, facilitating vital plant metabolic processes and aiding in the formation of crucial plant tissues like cells, cell membranes, and chlorophyll. Phosphorus is particularly vital for cultivating high-quality crops, while potassium plays a key role in activating enzymes essential for plant growth.
- The global average application rate for nitrogen, potassium, and phosphorus in field crops stands at 164.31 kg/ha. Nitrogen emerges as the most widely used primary nutrient fertilizer, with an average application rate of 224.6 kg/ha, followed by potassic fertilizers at 150.3 kg/ha. Phosphorus ranks third, with an average application rate of 117.9 kg/ha in 2022.
- In 2022, rapeseed recorded the highest nitrogen application rate at 347.4 kg/ha, while corn/maize led in phosphorus application at 156.3 kg/ha. Canola took the lead in potassium application, with a rate of 248.6 kg/ha. The global cultivation area for field crops is on the rise, with South America and Asia-Pacific witnessing notable growth. These regions are emerging as potential markets for fertilizers. Developed regions like Europe and North America, along with areas grappling with nutrient deficiencies, are increasingly turning to specialty fertilizers for their efficacy. These trends are expected to propel the primary nutrient fertilizers market during 2023-2030.
Specialty Fertilizer Industry Overview
The Specialty Fertilizer Market is fragmented, with the top five companies occupying 30.38%. The major players in this market are EuroChem Group, Grupa Azoty S.A. (Compo Expert), Sociedad Quimica y Minera de Chile SA, The Mosaic Company and Yara International ASA (sorted alphabetically).
Additional Benefits:
- The market estimate (ME) sheet in Excel format
- 3 months of analyst support
TABLE OF CONTENTS
1 EXECUTIVE SUMMARY & KEY FINDINGS
2 REPORT OFFERS
3 INTRODUCTION
- 3.1 Study Assumptions & Market Definition
- 3.2 Scope of the Study
- 3.3 Research Methodology
4 KEY INDUSTRY TRENDS
- 4.1 Acreage Of Major Crop Types
- 4.1.1 Field Crops
- 4.1.2 Horticultural Crops
- 4.2 Average Nutrient Application Rates
- 4.2.1 Micronutrients
- 4.2.1.1 Field Crops
- 4.2.1.2 Horticultural Crops
- 4.2.2 Primary Nutrients
- 4.2.2.1 Field Crops
- 4.2.2.2 Horticultural Crops
- 4.2.3 Secondary Macronutrients
- 4.2.3.1 Field Crops
- 4.2.3.2 Horticultural Crops
- 4.2.1 Micronutrients
- 4.3 Agricultural Land Equipped For Irrigation
- 4.4 Regulatory Framework
- 4.5 Value Chain & Distribution Channel Analysis
5 MARKET SEGMENTATION (includes market size in Value in USD and Volume, Forecasts up to 2030 and analysis of growth prospects)
- 5.1 Speciality Type
- 5.1.1 CRF
- 5.1.1.1 Polymer Coated
- 5.1.1.2 Polymer-Sulfur Coated
- 5.1.1.3 Others
- 5.1.2 Liquid Fertilizer
- 5.1.3 SRF
- 5.1.4 Water Soluble
- 5.1.1 CRF
- 5.2 Application Mode
- 5.2.1 Fertigation
- 5.2.2 Foliar
- 5.2.3 Soil
- 5.3 Crop Type
- 5.3.1 Field Crops
- 5.3.2 Horticultural Crops
- 5.3.3 Turf & Ornamental
- 5.4 Region
- 5.4.1 Asia-Pacific
- 5.4.1.1 Australia
- 5.4.1.2 Bangladesh
- 5.4.1.3 China
- 5.4.1.4 India
- 5.4.1.5 Indonesia
- 5.4.1.6 Japan
- 5.4.1.7 Pakistan
- 5.4.1.8 Philippines
- 5.4.1.9 Thailand
- 5.4.1.10 Vietnam
- 5.4.1.11 Rest of Asia-Pacific
- 5.4.2 Europe
- 5.4.2.1 France
- 5.4.2.2 Germany
- 5.4.2.3 Italy
- 5.4.2.4 Netherlands
- 5.4.2.5 Russia
- 5.4.2.6 Spain
- 5.4.2.7 Ukraine
- 5.4.2.8 United Kingdom
- 5.4.2.9 Rest of Europe
- 5.4.3 Middle East & Africa
- 5.4.3.1 Nigeria
- 5.4.3.2 Saudi Arabia
- 5.4.3.3 South Africa
- 5.4.3.4 Turkey
- 5.4.3.5 Rest of Middle East & Africa
- 5.4.4 North America
- 5.4.4.1 Canada
- 5.4.4.2 Mexico
- 5.4.4.3 United States
- 5.4.4.4 Rest of North America
- 5.4.5 South America
- 5.4.5.1 Argentina
- 5.4.5.2 Brazil
- 5.4.5.3 Rest of South America
- 5.4.1 Asia-Pacific
6 COMPETITIVE LANDSCAPE
- 6.1 Key Strategic Moves
- 6.2 Market Share Analysis
- 6.3 Company Landscape
- 6.4 Company Profiles
- 6.4.1 Coromandel International Ltd.
- 6.4.2 EuroChem Group
- 6.4.3 Grupa Azoty S.A. (Compo Expert)
- 6.4.4 Haifa Group
- 6.4.5 Kingenta Ecological Engineering Group Co., Ltd.
- 6.4.6 Koch Industries Inc.
- 6.4.7 Nutrien Ltd.
- 6.4.8 Sociedad Quimica y Minera de Chile SA
- 6.4.9 The Mosaic Company
- 6.4.10 Yara International ASA
7 KEY STRATEGIC QUESTIONS FOR FERTILIZER CEOS
8 APPENDIX
- 8.1 Global Overview
- 8.1.1 Overview
- 8.1.2 Porter's Five Forces Framework
- 8.1.3 Global Value Chain Analysis
- 8.1.4 Market Dynamics (DROs)
- 8.2 Sources & References
- 8.3 List of Tables & Figures
- 8.4 Primary Insights
- 8.5 Data Pack
- 8.6 Glossary of Terms
 特种肥料市场规模、份额和成长分析(按类型、技术、形态、作物类型、应用方法和地区划分)-2026-2033年产业预测
 按养分类型、应用、形态、作物类型、作用机制和销售管道的晶体肥料市场—2025-2032年全球预测特种肥料市场(依作物类型、产品形态、营养类型、施用方法、通路和最终用途)-2025-2032 年全球预测
 2025年特种肥料全球市场报告
 特种肥料市场规模、份额、趋势分析报告:按技术、作物类型、应用、地区、细分市场预测,2025-2030 年
 全球特种肥料市场规模(依特种肥料类型、作物类型、施用方法、区域范围及预测)
 特种肥料市场 - 全球产业规模、份额、趋势、机会和预测,按作物类型、形式、应用方式、技术、地区和竞争细分,2020-2030 年
 中东和非洲特种肥料:市场占有率分析、行业趋势和统计数据、成长预测(2025-2030 年)中国特种肥料市场占有率分析、产业趋势与统计、成长预测(2025-2030年)北美特种肥料:市场占有率分析、行业趋势和成长预测(2025-2030 年)