


 |
市场调查报告书
商品编码
1693544
非洲肥料:市场占有率分析、产业趋势与统计、成长预测(2025-2030)Africa Fertilizers - Market Share Analysis, Industry Trends & Statistics, Growth Forecasts (2025 - 2030) |
||||||
价格
※ 本网页内容可能与最新版本有所差异。详细情况请与我们联繫。
简介目录
预计 2025 年非洲肥料市场规模将达到 152.8 亿美元,预计到 2030 年将达到 200.7 亿美元,预测期内(2025-2030 年)的复合年增长率为 5.60%。
由于人口不断增长,粮食需求不断增加,预计 2023 年至 2030 年间,各类作物的化肥使用量将会增加。
- 2022年,非洲化肥消费量以田间作物为主,占总量的71.1%。这相当于消费量1550万吨,价值118亿美元。
- 紧随其后的是园艺作物,占非洲化肥消费量的 28.7%,2022 年价值 47.7 亿美元。消费量仍维持在 9,000 吨的适度水平,而园艺作物的种植面积从 2017 年的 3,650 万公顷扩大到 2022 年的 3,770 万公顷。这一增长是由对隐性饥饿和营养不良的担忧导致对水果和蔬菜等高价值作物的需求增加所推动的。耕地面积的快速增加凸显了提高生产力和增加园艺作物施肥的必要性。
- 受非洲国际市场对花卉的需求所推动,草坪和观赏作物占2021年非洲化肥消费量的8.9%。这相当于市场规模为7.706亿美元,消费量150万吨。
- 然而,到2022年,草皮和观赏作物仅占非洲化肥消费量的0.02%。该领域的市场规模为 350 万美元,消费量为 4,500 吨。常规肥料占了57.0%的市场份额,专用肥料占据了剩余的43.0%。
- 预计所有作物类型的化肥使用量都将增加。这种成长的动力来自于满足快速成长的人口的粮食需求、实现更高的产量以及提高作物生产率。
南非是非洲大陆主要农业生产国之一,依赖进口。
- 非洲蕴藏量丰富的氮、磷酸盐和钾矿藏,有潜力成为全球化肥市场的主要企业。该地区人口快速成长,加上食品消费模式的不断变化和收入的不断提高,推动了农业产量的提高。因此,预计肥料需求将会增加。
- 2022年,尼日利亚占据非洲化肥市场的36.7%的份额。尼日利亚是世界主要米消费量国之一,每年生产700万吨大米。该国的经济成长主要由农业部门推动,预计未来几年将维持 5.5% 的复合年增长率。
- 儘管尼日利亚是农业大国,但其化肥使用量相对较低,每公顷不到20公斤。这表明增加施肥率具有巨大潜力,这可能会推动市场进一步成长。相较之下,埃及和南非等国家的用水量已经大大超过奈及利亚,这意味着奈及利亚需要成长约 500% 才能赶上。
- 南非是非洲农业大国,严重依赖化肥进口。钾肥全部在国内消费,但60%至70%的氮肥依赖进口。与其他市场不同,南非的化肥产业在放鬆管制的环境中运营,没有进口关税或政府计划。随着作物种植面积的激增,南非化肥市场预计将大幅成长,从 2022 年的 17.7 亿美元扩大到 2030 年的 56 亿美元。
非洲肥料市场趋势
该地区有潜力使农业产量翻一番,而不断增长的消费需求预计将导致田间作物种植面积的扩大。
- 非洲的农业生态学区从每年降雨两次的茂密热带雨林到降雨稀少的干旱沙漠。该地区的主要田间作物包括玉米、高粱、小麦和水稻。 2022年,这些作物的种植面积达到2.248亿公顷,占农业用地总面积的95%以上。
- 2018-19年度,因供应过剩导致价格受压,南非玉米种植面积减少10%,至210万公顷。结果,国内玉米产量下降了11%,从1,300万吨下降到1,200万吨,而出口量也从250万吨暴跌到100万吨。因此,生产商可能会从玉米转向作物,尤其是大豆。预计此转变将导致2018-2019年非洲玉米种植面积整体下降。
- 非洲最大的高粱生产国是奈及利亚,紧随其后的是衣索比亚。高粱占尼日利亚谷物产量的50%,占其谷物种植面积的45%,是一种耐旱作物,可适应多种土壤条件。这些特性使得高粱成为一种首选的主要作物,尤其是在非洲的干旱地区,确保了粮食和收入安全。
- 肯亚、索马利亚和衣索比亚大部分地区面临严重粮食不安全的迫在眉睫的威胁。过去十年,儘管非洲的农业和耕地面积不断扩大,但其粮食进口支出却增加了近两倍。
氮是多种田间作物必需的关键营养素,而油菜籽是该地区的主要营养消耗作物。
- 油菜作物钾、磷施用量最高,2022年分别为162.4公斤/公顷、281.7公斤/公顷。同时,2022年非洲田间作物平均氮肥施用量将达364.9公斤/公顷。
- 2022年,非洲田间作物占一次养分总消费量的87.1%,达55.61万吨。这项优势得益于用于田间作物的土地面积广阔。具体而言,2022年这些作物的平均氮、磷、钾养分施用量分别为223.2公斤/公顷、125.3公斤/公顷、155.3公斤/公顷。
- 尼日利亚的几内亚大草原为玉米生产提供了适当的环境条件。然而,儘管具有这样的潜力,该地区的农民仍然在为低产量而苦苦挣扎。主要原因是由于土地集约利用导致土壤劣化和养分耗尽(主要是氮)。田间作物优先施用氮肥,因为氮肥具有多种益处,包括犁地、增加叶面积、形成籽粒、灌浆和促进蛋白质合成。氮在提高作物产量和品质方面也发挥着重要作用。基本营养物质对于作物生长至关重要,由于对土壤贫化和氮淋失的担忧,预计未来几年基本营养物质的施用率将大幅增加。
非洲肥料产业概况
非洲肥料市场细分化,前五大公司占7.43%。该市场的主要企业包括 Gavilon South Africa(MacroSource, LLC)、ICL Group Ltd、K+S Aktiengesellschaft、UPL Limited、Yara International ASA 等。
其他福利
- Excel 格式的市场预测 (ME) 表
- 3个月的分析师支持
目录
第一章执行摘要和主要发现
第二章 报告要约
第三章 引言
- 研究假设和市场定义
- 研究范围
- 调查方法
第四章 产业主要趋势
- 主要作物种植面积
- 田间作物
- 园艺作物
- 平均养分施用量
- 微量营养素
- 田间作物
- 园艺作物
- 主要营养素
- 田间作物
- 园艺作物
- 次要宏量营养素
- 田间作物
- 园艺作物
- 微量营养素
- 灌溉农田
- 法律规范
- 价值炼和通路分析
第五章市场区隔
- 类型
- 复合型
- 直的
- 微量营养素
- 硼
- 铜
- 铁
- 锰
- 钼
- 锌
- 其他的
- 氮
- 硝酸铵
- 尿素
- 其他的
- 磷酸
- DAP
- MAP
- SSP
- TSP
- 钾
- MoP
- SoP
- 次要营养物质
- 钙
- 镁
- 硫
- 形式
- 传统的
- 特别的
- CRF
- 液体肥料
- SRF
- 水溶性
- 施肥方式
- 受精
- 叶面喷布
- 土壤
- 作物类型
- 田间作物
- 园艺作物
- 草坪和观赏植物
- 原产地
- 奈及利亚
- 南非
- 其他非洲国家
第六章竞争格局
- 关键策略趋势
- 市场占有率分析
- 商业状况
- 公司简介
- Foskor
- Gavilon South Africa(MacroSource, LLC)
- Haifa Group
- ICL Group Ltd
- K+S Aktiengesellschaft
- Kynoch Fertilizer
- UPL Limited
- Yara International ASA
第七章:CEO面临的关键策略问题
第 8 章 附录
- 世界概况
- 概述
- 五力分析框架
- 全球价值链分析
- 市场动态(DRO)
- 资讯来源及延伸阅读
- 图片列表
- 关键见解
- 数据包
- 词彙表
简介目录
Product Code: 92609
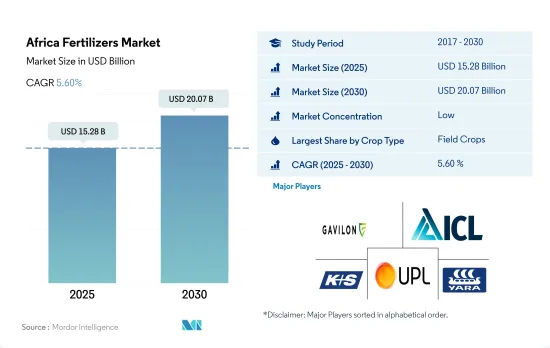
The Africa Fertilizers Market size is estimated at 15.28 billion USD in 2025, and is expected to reach 20.07 billion USD by 2030, growing at a CAGR of 5.60% during the forecast period (2025-2030).
The application of fertilizers in the respective crop types is anticipated to grow during 2023-2030, owing to the increasing need for food to feed the growing populations
- In 2022, field crops dominated fertilizer consumption in Africa, representing 71.1% of the total. This translated to a volume consumption of 15.5 million metric tons, valued at USD 11.80 billion.
- Horticultural crops followed, accounting for 28.7% of Africa's fertilizer consumption, valued at USD 4.77 billion in 2022. Despite a modest volume consumption of 9.0 thousand metric tons, the cultivation area for horticultural crops expanded from 36.5 million hectares in 2017 to 37.7 million hectares in 2022. This growth was driven by rising demand for high-value crops, such as fruits and vegetables, amidst concerns of hidden hunger and malnutrition. This surge in cultivation areas underscores the need for enhanced productivity, driving up fertilizer application in horticultural crops.
- Turf & ornamental crops, primarily driven by the demand for African flowers in international markets, accounted for 8.9% of Africa's fertilizer consumption in 2021. This translated to a market value of USD 770.6 million and a volume consumption of 1.5 million metric tons.
- However, in 2022, the share of turf and ornamental crops in Africa's fertilizer consumption dropped to a mere 0.02%. The market value for this segment was USD 3.5 million, with a volume consumption of 4.5 thousand metric tons. Conventional fertilizers dominated the market, capturing a 57.0% share, while specialty fertilizers accounted for the remaining 43.0%.
- The application of fertilizers across crop types is expected to rise. This growth is driven by the need to meet the food demands of a burgeoning population, achieve higher yields, and enhance crop productivity.
South Africa is one of the major agriculture-producing countries in the continent and is import-dependent
- Africa's vast mineral reserves of nitrogen, phosphate, and potash position it as a potential major player in the global fertilizer market. The region's rapid population growth, coupled with evolving food consumption patterns and rising incomes, is driving a need for increased agricultural production. This, in turn, is expected to lead to an increase in fertilizer demand.
- In 2022, Nigeria dominated the African fertilizer market, accounting for 36.7% of the total. Nigeria boasts one of the world's highest rice consumption rates, with an annual production of 7 million metric tons. The country's economic growth, primarily propelled by the agricultural sector, is projected to sustain a CAGR of 5.5% in the coming years.
- Despite being a major player, Nigeria's fertilizer usage remains relatively low, at under 20kg/hectare. This indicates a significant untapped potential for increased fertilizer application, potentially driving further market growth. In comparison, countries like Egypt and South Africa have already surpassed Nigeria's usage by a significant margin, suggesting a potential leap of around 500% for Nigeria to catch up.
- South Africa, a key agricultural nation in Africa, heavily relies on fertilizer imports. While all potassic fertilizers are domestically consumed, a substantial 60%-70% of nitrogenous fertilizers are imported. Unlike some other markets, South Africa's fertilizer sector operates in a deregulated landscape, devoid of import tariffs or government schemes. With a surge in crop cultivation, the South African fertilizer market is projected to witness substantial growth, expanding from USD 1.77 billion in 2022 to USD 5.60 billion by 2030.
Africa Fertilizers Market Trends
The region has the potential to double its agricultural production, and the area under field crops is expected to expand due to the rising consumption demand
- The agroecological zones in Africa span from dense rainforests with bi-annual rainfall to arid deserts with minimal precipitation. Dominant field crops in the region include corn, sorghum, wheat, and rice. In 2022, the cultivation area for these crops reached 224.8 million hectares, accounting for over 95% of the total agricultural land.
- In the 2018-19 season, South African corn farmers reduced their planted area by 10% to 2.1 million hectares, responding to an oversupply that suppressed prices. Consequently, corn production in the country dipped by 11%, from 13 million to 12 million tonnes, and exports plummeted from 2.5 million to 1 million tonnes. In light of this, producers were likely to pivot from corn to oilseed crops, with soybeans being a favored choice. This shift was anticipated to lead to an overall decline in corn cultivation across Africa from 2018 to 2019.
- Nigeria takes the lead as the largest sorghum producer in Africa, closely followed by Ethiopia. Sorghum, accounting for 50% of Nigeria's cereal output and occupying 45% of its cereal cultivation land, is a drought-tolerant crop with adaptability to diverse soil conditions. These qualities make sorghum a preferred staple crop, particularly in Africa's drier regions, ensuring food and income security.
- Kenya, Somalia, and significant parts of Ethiopia face an imminent threat of severe food shortages. Over the past decade, Africa's spending on food imports nearly tripled despite a consistent expansion in its agricultural industry and cultivated land.
Nitrogen stands out as a crucial nutrient essential for various field crops, with rapeseed being the primary nutrient consumer in this region
- Rapeseed crops have the highest potassium and phosphorous application rates, accounting for 162.4 kg/hectare and 281.7 kg/hectare, respectively, in 2022. Meanwhile, the average nitrogen application rate for field crops in Africa stood at 364.9 kg/hectare in 2022.
- In 2022, field crops in Africa accounted for 87.1% of the total primary nutrient consumption, which amounted to 556.1 thousand metric tons. This dominance can be attributed to the extensive land area dedicated to field crops. Specifically, the average nutrient application rates for nitrogen, phosphorous, and potassium in these crops were 223.2 kg/ha, 125.3 kg/ha, and 155.3 kg/ha, respectively, in 2022.
- The Guinea savannas in Nigeria offer favorable environmental conditions for maize production. However, despite this potential, farmers in the region struggle with low yields. The primary culprits are soil degradation and nutrient depletion, primarily nitrogen, resulting from intensified land use. Field crops prioritize nitrogen application due to its multiple benefits, including promoting tillering, leaf area development, grain formation, filling, and protein synthesis. Nitrogen also plays a crucial role in enhancing both grain yield and quality. Given that primary nutrients are vital for crop growth and with concerns over soil depletion and nitrogen leaching, the application rates for primary nutrients are expected to witness significant growth in the coming years.
Africa Fertilizers Industry Overview
The Africa Fertilizers Market is fragmented, with the top five companies occupying 7.43%. The major players in this market are Gavilon South Africa (MacroSource, LLC), ICL Group Ltd, K+S Aktiengesellschaft, UPL Limited and Yara International ASA (sorted alphabetically).
Additional Benefits:
- The market estimate (ME) sheet in Excel format
- 3 months of analyst support
TABLE OF CONTENTS
1 EXECUTIVE SUMMARY & KEY FINDINGS
2 REPORT OFFERS
3 INTRODUCTION
- 3.1 Study Assumptions & Market Definition
- 3.2 Scope of the Study
- 3.3 Research Methodology
4 KEY INDUSTRY TRENDS
- 4.1 Acreage Of Major Crop Types
- 4.1.1 Field Crops
- 4.1.2 Horticultural Crops
- 4.2 Average Nutrient Application Rates
- 4.2.1 Micronutrients
- 4.2.1.1 Field Crops
- 4.2.1.2 Horticultural Crops
- 4.2.2 Primary Nutrients
- 4.2.2.1 Field Crops
- 4.2.2.2 Horticultural Crops
- 4.2.3 Secondary Macronutrients
- 4.2.3.1 Field Crops
- 4.2.3.2 Horticultural Crops
- 4.2.1 Micronutrients
- 4.3 Agricultural Land Equipped For Irrigation
- 4.4 Regulatory Framework
- 4.5 Value Chain & Distribution Channel Analysis
5 MARKET SEGMENTATION (includes market size in Value in USD and Volume, Forecasts up to 2030 and analysis of growth prospects)
- 5.1 Type
- 5.1.1 Complex
- 5.1.2 Straight
- 5.1.2.1 Micronutrients
- 5.1.2.1.1 Boron
- 5.1.2.1.2 Copper
- 5.1.2.1.3 Iron
- 5.1.2.1.4 Manganese
- 5.1.2.1.5 Molybdenum
- 5.1.2.1.6 Zinc
- 5.1.2.1.7 Others
- 5.1.2.2 Nitrogenous
- 5.1.2.2.1 Ammonium Nitrate
- 5.1.2.2.2 Urea
- 5.1.2.2.3 Others
- 5.1.2.3 Phosphatic
- 5.1.2.3.1 DAP
- 5.1.2.3.2 MAP
- 5.1.2.3.3 SSP
- 5.1.2.3.4 TSP
- 5.1.2.4 Potassic
- 5.1.2.4.1 MoP
- 5.1.2.4.2 SoP
- 5.1.2.5 Secondary Macronutrients
- 5.1.2.5.1 Calcium
- 5.1.2.5.2 Magnesium
- 5.1.2.5.3 Sulfur
- 5.2 Form
- 5.2.1 Conventional
- 5.2.2 Speciality
- 5.2.2.1 CRF
- 5.2.2.2 Liquid Fertilizer
- 5.2.2.3 SRF
- 5.2.2.4 Water Soluble
- 5.3 Application Mode
- 5.3.1 Fertigation
- 5.3.2 Foliar
- 5.3.3 Soil
- 5.4 Crop Type
- 5.4.1 Field Crops
- 5.4.2 Horticultural Crops
- 5.4.3 Turf & Ornamental
- 5.5 Country
- 5.5.1 Nigeria
- 5.5.2 South Africa
- 5.5.3 Rest of Africa
6 COMPETITIVE LANDSCAPE
- 6.1 Key Strategic Moves
- 6.2 Market Share Analysis
- 6.3 Company Landscape
- 6.4 Company Profiles
- 6.4.1 Foskor
- 6.4.2 Gavilon South Africa (MacroSource, LLC)
- 6.4.3 Haifa Group
- 6.4.4 ICL Group Ltd
- 6.4.5 K+S Aktiengesellschaft
- 6.4.6 Kynoch Fertilizer
- 6.4.7 UPL Limited
- 6.4.8 Yara International ASA
7 KEY STRATEGIC QUESTIONS FOR FERTILIZER CEOS
8 APPENDIX
- 8.1 Global Overview
- 8.1.1 Overview
- 8.1.2 Porter's Five Forces Framework
- 8.1.3 Global Value Chain Analysis
- 8.1.4 Market Dynamics (DROs)
- 8.2 Sources & References
- 8.3 List of Tables & Figures
- 8.4 Primary Insights
- 8.5 Data Pack
- 8.6 Glossary of Terms
02-2729-4219
+886-2-2729-4219
 硼肥市场-全球产业规模、份额、趋势、机会和预测,依来源、应用、区域和竞争格局划分,2020-2030年预测全球粪肥市场-产业规模、份额、趋势、机会及预测,依类型、形态、应用、区域及竞争格局划分,2020-2030年预测昆虫肥料市场-全球产业规模、份额、趋势、机会和预测,按类型、形态、应用、地区和竞争格局划分,2020-2030年预测海藻肥料市场-全球产业规模、份额、趋势、机会和预测,按形态(液体和粉末)、应用(农场、花园及其他)、地区和竞争格局划分,2020-2030年预测聚合物包膜肥料市场-全球产业规模、份额、趋势、机会和预测,按类型、作物类型、地区和竞争格局划分,2020-2030年预测
 按营养类型、形态、施用方法、作物类型、品种和地区分類的启动肥市场规模、份额和增长分析 - 2025-2032 年行业预测
 硅肥市场:预测(2025-2030 年)
 胶囊肥料市场依营养成分、释放机制、作物用途及地区划分
 几丁质肥料市场:按应用、最终用户、类型、原材料、配方和通路- 全球预测(2025-2032年)化肥市场按产品类型、作物类型、包装、施用方法、最终用户和分销管道划分-2025-2032年全球预测
▼