


 |
市场调查报告书
商品编码
1849935
中国资料中心冷却:市场占有率分析、产业趋势、统计数据和成长预测(2025-2030)China Data Center Cooling - Market Share Analysis, Industry Trends & Statistics, Growth Forecasts (2025 - 2030) |
||||||
※ 本网页内容可能与最新版本有所差异。详细情况请与我们联繫。
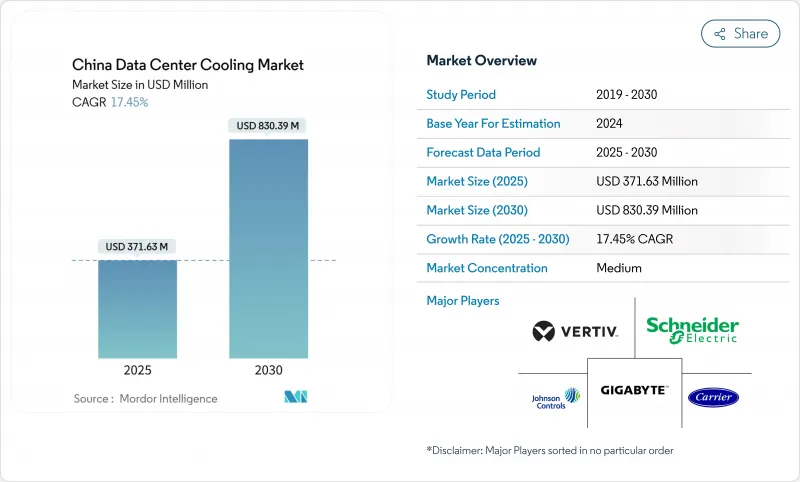
预计到 2025 年,中国资料中心冷却市场规模将达到 3.7163 亿美元,到 2030 年将达到 8.3039 亿美元,2025 年至 2030 年的复合年增长率为 17.45%。
强制性的电源使用效率 (PUE) 上限、人工智慧伺服器机架密度不断提高(其散热量是传统工作负载的六到八倍),以及诸如「东部数据」和「西部计算」等政府项目,都在推动对液冷技术的资本投资。营运商优先考虑在一线城市实现 PUE 低于 1.3 的技术,并正从传统的空气冷却系统转向晶片级直接冷却、浸没式冷却和后门式液冷解决方案。同时,水资源压力法规也在推动闭合迴路设计的发展,以最大限度地提高散热效率并最大限度地降低消费量。虽然设备销售仍然占据支出的大部分,但随着设施业主寻求维修和待开发区液冷部署方面的专业知识,对专业服务的需求正在迅速增长。
中国资料中心冷却市场趋势及洞察
超大规模资料中心和人工智慧主导的机架密度的兴起
现代AI机柜的功耗高达20-130kW,而传统伺服器的功耗仅为5-10kW,因此风冷已无法满足需求,液冷技术也因此广泛应用。华为的密封液冷机柜可将冷却功耗降低96%,并将资料中心的PUE值降至1.1,证明了其在超大规模资料中心环境下的可行性。目前,位于贵安、乌兰察布和芜湖的国家级旗舰AI计算丛集正在建设阶段指定采用液冷解决方案,这凸显了数据中心规划的重大转变,即散热设计与晶片性能同等重要。
政府对新建资料中心的PUE上限规定
北京的「十四五」规划要求所有新建资料中心到2025年PUE值低于1.5,上海则将标准提高到1.3。2023年绿色资料中心标准将扩大合规范围至用水率和可再生能源利用率,确认液冷是实现大规模能源效率目标的唯一现实途径。
电费上涨削弱了总拥有成本优势。
预计资料中心用电量将从2025年的200太瓦时(TWh)增至2030年的400-600太瓦时(TWh),而江苏和浙江的电价上涨将大幅增加营运成本,足以抵销旧设备折旧免税额带来的成本节约。 「东部数据/西部计算」计画旨在透过将负载转移到可再生能源丰富的地区来减轻负担,但营运商仍需考虑延迟和光纤回程传输的限制。
细分市场分析
到2024年,超大规模资料中心将占中国资料中心冷却市场收入的46.5%,预计到2030年,其对中国资料中心冷却市场规模的贡献将以17.9%的复合年增长率成长。这些公司正在建造单机架功率超过100kW的AI丛集,因此采用液冷技术对于热感余量和PUE合规性至关重要。这种规模也降低了单机架的冷却成本,使其成为企业和边缘营运商效仿的标竿。然而,在边缘站点,由于空间和维护方面的限制,紧凑型后门式热交换器更受欢迎。超大规模资料中心的兴起确保了液冷基础设施在新容量成长中占据主导地位,而气动系统则作为辅助选项占据一席之地。
託管业者正顺应这一趋势,将专用液冷区作为加值服务进行捆绑销售,将高密度配置转化为利润成长和差异化的客户体验。企业级设施在全面采用浸没式冷却技术方面进展缓慢,但正在试行直接对晶片进行冷却的迴路,以增强现有冷却器机组的性能。总而言之,这些倡议表明,随着各个营运商细分市场向人工智慧赋能的热感架构迈进,中国资料中心冷却市场仍保持高速成长。
凭藉成熟的设计框架和运作与资本支出之间的良好平衡,三级资料中心预计在2024年将占总支出的67.1%。然而,四级资料中心的建设正以19.2%的复合年增长率增长,因为人工智慧训练工作负载无法容忍即使几分钟的计划外停机。因此,随着投资人优先考虑容错性强、可同时维护的液冷系统(即使在维修期间也能将机架温度保持在30°C以内),中国四级资料中心冷却市场规模将迅速扩大。
随着每机架功率和冷却需求降至15kW以下,一级和二级资料中心的占地面积正在稳步缩小;而三级资料中心则透过双迴路液冷基础设施维修,使营运商能够在无需额外预算四级资料中心的情况下,满足客户新的密度需求。这种分级架构的演进巩固了液冷技术在中国资料中心冷却市场人工智慧架构中的基准。
中国资料中心冷却市场按资料中心类型(超大规模资料中心(自有和租赁)、企业级和边缘资料中心、託管资料中心)、等级(一级和二级、三级、四级)、冷却技术(风冷、液冷)以及组件(服务、设备)进行细分。市场预测以美元计价。
其他福利:
- Excel格式的市场预测(ME)表
- 3个月的分析师支持
目录
第一章 引言
- 研究假设和市场定义
- 调查范围
第二章调查方法
第三章执行摘要
第四章 市场情势
- 市场概览
- 市场驱动因素
- 超大规模和人工智慧主导的机架密度爆炸性成长
- 政府为新建筑的PUE(能源使用量)设定了上限
- 託管业务快速扩张(机架市占率年增 51.7%)
- 成熟的液冷供应链和本地OEM厂商的规模化生产
- 利用寒冷天气自然冷却区的东方数据和西方计算程序
- 将伺服器废热转化为区域供热网路的收益
- 市场限制
- 高电费削弱了TCO优势
- 水资源压力增加会减少蒸发冷却许可。
- 地方电力配额上限延缓了超大规模计划
- 对含氟冷媒进口的依赖面临关税风险
- 供应链分析
- 监管环境
- 技术展望
- 波特五力模型
- 新进入者的威胁
- 买方的议价能力
- 供应商的议价能力
- 替代品的威胁
- 竞争对手之间的竞争
- 影响市场的宏观经济因素
第五章 市场规模与成长预测
- 依资料中心类型
- 超大规模资料中心业者(自有和租赁)
- 企业和边缘运算
- 搭配
- 依层级类型
- 一级和二级
- 三级
- 第四级
- 透过冷却技术
- 空气冷却
- 冷却器和节热器(直接膨胀系统)
- 计算机房空调
- 冷却塔(支援直接冷却、间接冷却和两级冷却)
- 其他的
- 液冷
- 浸没式冷却
- 晶片直接冷却
- 后门热交换器
- 空气冷却
- 按组件
- 透过服务
- 咨询和培训
- 安装与部署
- 维护和支援
- 透过装置
- 透过服务
第六章 竞争情势
- 市场集中度
- 策略趋势
- 市占率分析
- 公司简介
- Schneider Electric SE
- Johnson Controls International plc
- GIGA-BYTE Technology Co. Ltd.
- Vertiv Group Corp.
- Carrier Global Corporation
- Rittal GmbH and Co. KG
- Munters Group AB
- Stulz GmbH
- Kstar Science and Technology Co. Ltd.
- Alfa Laval AB
- Huawei Technologies Co. Ltd.
- Hangzhou Envicool Technology Co. Ltd.
- Shenzhen Yimikang Technology Co. Ltd.
- Inspur Group Co. Ltd.
- Lenovo Group Ltd.
- CoolIT Systems Inc.
- Asetek A/S
- Sugon(Dawning Information Industry)
- Midea Group Co. Ltd.(Clivet Division)
- Iceotope Technologies Ltd.
第七章 市场机会与未来展望
The China data center cooling market is valued at USD 371.63 million in 2025 and is forecast to reach USD 830.39 million by 2030, advancing at a 17.45% CAGR during 2025-2030.
Mandatory Power Usage Effectiveness (PUE) caps, surging AI server rack densities that dissipate 6-8 times more heat than legacy workloads, and the government's Eastern Data and Western Compute program are converging to accelerate capital outlays for liquid-based cooling. Operators are prioritizing technology that keeps PUE below 1.3 in Tier 1 cities, driving a pivot away from conventional air systems toward direct-to-chip, immersion, and rear-door liquid solutions. At the same time, water-stress regulations are pushing closed-loop designs that minimise consumption while maximising thermal efficiency. Although equipment sales still dominate spending, demand for specialised services is climbing fast as facility owners seek expertise to retrofit or green-field liquid deployments.
China Data Center Cooling Market Trends and Insights
Surging hyperscale and AI-driven rack densities
Modern AI cabinets consume 20-130 kW versus 5-10 kW for legacy servers, rendering air cooling insufficient and propelling mass adoption of liquid technologies. Huawei's closed liquid-cooled cabinet cuts cooling power by 96% and lowers facility PUE to 1.1, proving viability at the hyperscale level. National flagship AI compute clusters in Gui'an, Ulanqab, and Wuhu now specify liquid solutions at the build-out stage, underscoring a structural shift that places thermal design on par with chip performance in data-center planning.
Government-mandated PUE caps for new builds
Beijing's 14th Five-Year plan requires all new data centers to operate below 1.5 PUE by 2025, while Shanghai tightens the threshold to 1.3. The 2023 Green Data Center standard expands compliance to water-consumption ratios and renewable-energy sourcing, cementing liquid cooling as the only practical route to meet efficiency targets at scale.
High electricity tariffs eroding TCO advantages
Data center power draw is expected to climb from 200 TWh in 2025 toward 400-600 TWh by 2030, with tariffs in Jiangsu and Zhejiang raising operating costs enough to negate savings from legacy equipment depreciation. The Eastern Data and Western Compute initiative counterbalances the burden by relocating load to renewable-rich provinces but requires operators to reconcile latency and fibre-backhaul constraints.
Other drivers and restraints analyzed in the detailed report include:
- Rapid colocation expansion
- Maturing liquid-cooling supply chain and local OEM scale-up
- Growing water-stress curbing evaporative-cooling permits
For complete list of drivers and restraints, kindly check the Table Of Contents.
Segment Analysis
Hyperscalers accounted for 46.5% of 2024 revenue, and their contribution to the China data center cooling market size is forecast to expand at 17.9% CAGR through 2030. These firms build AI clusters that exceed 100 kW per rack, making liquid technology non-negotiable for thermal headroom and PUE compliance. Their scale also drives down per-rack cooling cost, creating a benchmark that enterprise and edge operators now emulate. Edge sites, however, favour compact rear-door heat exchangers due to space and maintenance limits. The hyperscaler wave ensures that liquid infrastructure will dominate new capacity additions, even though air systems retain a retrofit niche.
Colocation operators mirror this trajectory by bundling dedicated liquid zones as premium services, converting density into both margin and differentiated customer experience. Enterprise facilities lag on full immersion adoption but are piloting direct-to-chip loops to stretch existing chiller plants. Combined, these moves keep the China data center cooling market on a high-growth path as every operator segment advances toward AI-ready thermal architectures.
Tier 3 sites captured 67.1% of spending in 2024 thanks to their mature design frameworks and competitive balance of uptime vs. capex. Yet Tier 4 builds are growing at 19.2% CAGR because AI training workloads cannot afford even minutes of unplanned downtime. The China data center cooling market size for Tier 4 facilities will therefore rise swiftly as investors prioritise fault-tolerant, concurrently maintainable liquid systems that keep racks within 30 °C even during maintenance.
Tier 1 and Tier 2 footprints are steadily cannibalised as their power and cooling envelopes top out below 15 kW per rack. Meanwhile, Tier 3 specifications are being retrofitted with dual-loop liquid infrastructure so operators can satisfy new customer density requirements without a green-field Tier 4 budget. This tier evolution reinforces liquid technology as the baseline for any AI-centric build in China's data center cooling market.
China Data Center Cooling Market is Segmented by Data Center Type (Hyperscalers (Owned and Leased), Enterprise and Edge, Colocation), Tier Type (Tier 1 and 2, Tier 3, Tier 4), Cooling Technology (Air Based Cooling, Liquid Based Cooling), Component (Service, Equipment). The Market Forecasts are Provided in Terms of Value (USD).
List of Companies Covered in this Report:
- Schneider Electric SE
- Johnson Controls International plc
- GIGA-BYTE Technology Co. Ltd.
- Vertiv Group Corp.
- Carrier Global Corporation
- Rittal GmbH and Co. KG
- Munters Group AB
- Stulz GmbH
- Kstar Science and Technology Co. Ltd.
- Alfa Laval AB
- Huawei Technologies Co. Ltd.
- Hangzhou Envicool Technology Co. Ltd.
- Shenzhen Yimikang Technology Co. Ltd.
- Inspur Group Co. Ltd.
- Lenovo Group Ltd.
- CoolIT Systems Inc.
- Asetek A/S
- Sugon (Dawning Information Industry)
- Midea Group Co. Ltd. (Clivet Division)
- Iceotope Technologies Ltd.
Additional Benefits:
- The market estimate (ME) sheet in Excel format
- 3 months of analyst support
TABLE OF CONTENTS
1 INTRODUCTION
- 1.1 Study Assumptions and Market Definition
- 1.2 Scope of the Study
2 RESEARCH METHODOLOGY
3 EXECUTIVE SUMMARY
4 MARKET LANDSCAPE
- 4.1 Market Overview
- 4.2 Market Drivers
- 4.2.1 Surging hyperscale and AI-driven rack densities
- 4.2.2 Government-mandated PUE caps for new builds
- 4.2.3 Rapid colocation expansion (+51.7 % rack share YoY)
- 4.2.4 Maturing liquid-cooling supply chain and local OEM scale-up
- 4.2.5 Eastern Data and Western Compute programme exploiting cold-climate free-cooling zones
- 4.2.6 Monetisation of server waste-heat into district-heating grids
- 4.3 Market Restraints
- 4.3.1 High electricity tariffs eroding TCO advantages
- 4.3.2 Growing water-stress curbing evaporative-cooling permits
- 4.3.3 Provincial power-quota caps delaying hyperscale projects
- 4.3.4 Import dependency on fluorinated coolants facing tariff risk
- 4.4 Supply-Chain Analysis
- 4.5 Regulatory Landscape
- 4.6 Technological Outlook
- 4.7 Porter's Five Forces
- 4.7.1 Threat of New Entrants
- 4.7.2 Bargaining Power of Buyers
- 4.7.3 Bargaining Power of Suppliers
- 4.7.4 Threat of Substitutes
- 4.7.5 Competitive Rivalry
- 4.8 Impact of Macroeconomic Factors on the Market
5 MARKET SIZE AND GROWTH FORECASTS (VALUE)
- 5.1 By Data Center Type
- 5.1.1 Hyperscalers (owned and Leased)
- 5.1.2 Enterprise and Edge
- 5.1.3 Colocation
- 5.2 By Tier Type
- 5.2.1 Tier 1 and 2
- 5.2.2 Tier 3
- 5.2.3 Tier 4
- 5.3 By Cooling Technology
- 5.3.1 Air-based Cooling
- 5.3.1.1 Chiller and Economizer (DX Systems)
- 5.3.1.2 CRAH
- 5.3.1.3 Cooling Tower (covers direct, indirect and two-stage cooling)
- 5.3.1.4 Others
- 5.3.2 Liquid-based Cooling
- 5.3.2.1 Immersion Cooling
- 5.3.2.2 Direct-to-Chip Cooling
- 5.3.2.3 Rear-Door Heat Exchanger
- 5.3.1 Air-based Cooling
- 5.4 By Component
- 5.4.1 By Service
- 5.4.1.1 Consulting and Training
- 5.4.1.2 Installation and Deployment
- 5.4.1.3 Maintenance and Support
- 5.4.2 By Equipment
- 5.4.1 By Service
6 COMPETITIVE LANDSCAPE
- 6.1 Market Concentration
- 6.2 Strategic Moves
- 6.3 Market Share Analysis
- 6.4 Company Profiles {(includes Global level Overview, Market level overview, Core Segments, Financials as available, Strategic Information, Market Rank/Share for key companies, Products and Services, and Recent Developments)}
- 6.4.1 Schneider Electric SE
- 6.4.2 Johnson Controls International plc
- 6.4.3 GIGA-BYTE Technology Co. Ltd.
- 6.4.4 Vertiv Group Corp.
- 6.4.5 Carrier Global Corporation
- 6.4.6 Rittal GmbH and Co. KG
- 6.4.7 Munters Group AB
- 6.4.8 Stulz GmbH
- 6.4.9 Kstar Science and Technology Co. Ltd.
- 6.4.10 Alfa Laval AB
- 6.4.11 Huawei Technologies Co. Ltd.
- 6.4.12 Hangzhou Envicool Technology Co. Ltd.
- 6.4.13 Shenzhen Yimikang Technology Co. Ltd.
- 6.4.14 Inspur Group Co. Ltd.
- 6.4.15 Lenovo Group Ltd.
- 6.4.16 CoolIT Systems Inc.
- 6.4.17 Asetek A/S
- 6.4.18 Sugon (Dawning Information Industry)
- 6.4.19 Midea Group Co. Ltd. (Clivet Division)
- 6.4.20 Iceotope Technologies Ltd.
7 MARKET OPPORTUNITIES AND FUTURE OUTLOOK
- 7.1 White-space and Unmet-need Assessment
 整合式机架安装单元 (CDU) 市场:按阶段、容量、应用和最终用户分類的全球预测,2026-2032 年资料中心CDU市场:按类型、组件、冷却方式、容量、应用工作负载、最终用途、企业规模、安装方式、分销管道划分,全球预测,2026-2032年
 资料中心冷却市场:依组件、冷却技术、资料中心类型和行业划分 - 全球预测至2036年
 资料中心冷却:市场占有率分析、产业趋势与统计、成长预测(2026-2032)
 全球资料中心冷却市场规模、份额、趋势和成长分析报告(2026-2034年)
 节水型资料中心技术市场,全球预测至2034年:依冷却技术、水源、水处理方法、所有权模式及地区划分
 2026年全球资料中心冷却市场报告全球资料中心冷却市场:市场规模、占有率、成长率、产业分析、依类型、应用和地区划分的分析以及未来预测(2026-2034)
 资料中心冷却系统市场 - 全球产业规模、份额、趋势、机会与预测:冷却策略、最终用途类型、服务、最终用户产业、地区和竞争格局,2021-2031年
 资料中心冷却市场规模、份额和趋势分析报告:按组件、类型、污染物、结构、应用、地区和细分市场预测(2026-2033 年)