


 |
市场调查报告书
商品编码
1850299
垂直农业:市场份额分析、行业趋势、统计数据和成长预测(2025-2030 年)Vertical Farming - Market Share Analysis, Industry Trends & Statistics, Growth Forecasts (2025 - 2030) |
||||||
※ 本网页内容可能与最新版本有所差异。详细情况请与我们联繫。
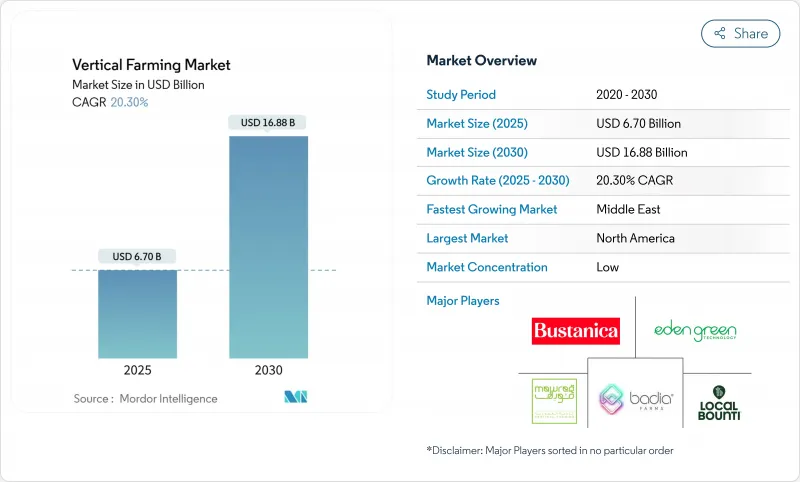
据估计,到 2025 年,垂直农业市场规模将达到 67 亿美元,预计到 2030 年将达到 168.8 亿美元,预测期内复合年增长率为 20.30%。
强劲的扩张是由都市区土地稀缺、技术成本下降和机构投资增加所驱动的。北美地区在2024年仍保持领先地位,收入份额达39.1%,而中东地区到2030年将以15.5%的复合年增长率实现最快增长,这主要得益于粮食安全计划为大型设施提供资金。水耕技术占产值的57.1%,但气耕凭藉其更高的产量面积产量经济性,以24.1%的复合年增长率超越了水耕技术。照明设备在资本支出方面领先,占比达38.5%,而空调系统则随着营运商提高能源效率而实现了20.2%的快速成长。市场竞争仍分散,前五大供应商在2024年的营收份额超过20%,但仍有充足的空间容纳专业领域的参与企业和区域领导者。
全球垂直农业市场趋势与洞察
都市化催生了对本地生产的生鲜食品的需求。
到2050年,全球居住预计将达到70%,这将对大都会圈的食品物流带来越来越大的压力。像Eden Green这样的业者能够在48小时内将生菜从采摘地运送到货架,将运输路线从数千英里缩短到都会区内,同时减少99%的土地使用和98%的用水量。新加坡的「30 by 30」策略标誌着这一理念在全国范围内得到应用,该战略旨在透过扩大太阳能室内农场的规模,到2030年满足新加坡三分之一的营养需求。
LED、自动化和人工智慧的成本曲线
照明是目前最大的可控成本。康乃尔大学的测试表明,利用频谱调谐LED灯和人工智慧调度技术,生菜的能耗从每公斤9.5千瓦时降低到6.42千瓦时。西门子和80Acres Farms进一步展示了数位双胞胎和机器人技术如何实现全球范围内的标准化工作流程。
高能源密集度与资本投资
曾经试验以每公斤生菜12.5千瓦时的最高耗电量进行生产,但这会压缩电网电价超过每千瓦时0.12美国的地区的利润空间。发光二极体)目前的平均能耗为每焦耳3.2微摩尔,高于2023年的每焦耳2.5微摩尔。人工智慧控制的暖气、通风和空调系统(HVAC)可进一步降低25%的能耗。然而,货柜维修虽然前期投入成本较低(1.5万至2万美元),但其热容量较低,因此单位能耗成本较高。
细分市场分析
到2024年,水耕法将占据垂直农业市场57.1%的份额。由于其成熟的营养液配方、可扩展的硬体供应以及易于理解的系统维护,水耕法仍然是大型零售商的首选。气耕以24.1%的复合年增长率成长,利用喷雾水可将生物量成长速度提高30%,并节省95%的用水量。随着莓果和葡萄种植面积的扩大,气耕垂直农业市场规模预计将快速成长。虽然目前水耕法的普及率较低,但它透过养鱼和养菜创造了互惠互利的收入来源,可以有效抵御价格波动的影响。
商业性评估会权衡资本密集度和产量。水耕轨道每平方公尺成本为 80 至 100 美元,而气培塔每平方公尺成本超过 140 美元,但生长週期较短。数据主导的灌溉正在缩小两者之间的差距,一些营运商已在同一设施内混合使用这两种方法。保险公司越来越倾向于气培系统的冗余性,因为喷雾喷嘴可以隔离根部病害爆发,从而降低召回风险。
到2024年,建筑类产品将占销售额的61.3%,这反映了超级市场规模的生产能力以及整合屋顶太阳能和配套余热回收系统的能力。货柜农场以23.5%的复合年增长率成长,部分原因是大学、医院和企业园区购买了承包模组。 FreightFarm指出,2024年来自非营利组织的订单成长了32%。
经济效益取决于资产的使用寿命:建筑物折旧期为20至25年,符合绿色债券融资条件;而货柜折旧期为7年,且每磅的公用事业成本较高。儘管如此,灾害救援机构仍重视货柜的机动性,如果极端天气扰乱供应链,他们可以在30天内调派货柜。
区域分析
北美仍将是最大的区域贡献者,预计到2024年将占全球销售额的39.1%。美国农业部的补贴、零售商的合作以及消费者愿意为本地种植的果蔬支付20-30%的溢价,都推动了这个成长动能。例如,位于乔治亚、耗资5,600万美元、占地3万平方公尺的美国大型综合设施,就展示瞭如何将棕地仓库改造为全年供应的供应商。美国的Goodleaf公司则利用水力发电关税来维持其商品价格的竞争力。
中东是垂直农业发展最快的地区,年复合成长率高达15.5%。主权财富基金正在资助大规模的垂直农场建设,以增强干旱气候下的粮食安全。杜拜的ECO-1是世界上最大的垂直农场,目前每年生产超过200万磅的绿叶蔬菜,阿联酋计画在2030年再建500座。这些系统通常与海水淡化厂结合,利用废热和盐水矿物质流来提高资源利用效率。
亚太地区正在经历多元化的发展。新加坡正加速推进其太阳能塔项目,以实现「2030年实现30座太阳能塔」的目标,而马来西亚的几家企业则因电费而被迫关闭。中国一家国营科研院所正专注于多层温室混合结构,而非全室内系统。欧洲面临规划审批和高昂建设成本的双重挑战,但一家荷兰温室业者正吸引私募股权投资。南美洲正在崛起:智利的AgroUrbana公司筹集了600万美元,用于将其产能扩大五倍;一家墨西哥营运商正在扩建一个货柜式温室丛集,以服务度假区。
其他福利:
- Excel格式的市场预测(ME)表
- 包含 3 个月的分析师支持
目录
第一章 引言
- 研究假设和市场定义
- 调查范围
第二章调查方法
第三章执行摘要
第四章 市场情势
- 市场概览
- 市场驱动因素
- 都市化催生了新鲜本地农产品的需求。
- LED、自动化和人工智慧的成本曲线
- 极端天气下的气候适应粮食系统
- 政府对农业技术的奖励与投资
- VF企业碳信用收入的积累
- 企业ESG现场微型农场安装
- 市场限制
- 高消费量和高资本投入
- 作物投资组合的盈利窗口期较窄
- 技能差距与营运复杂性
- 基因改造微型菜苗监管路径尚不明确
- 监管环境
- 技术展望
- 五力分析
- 供应商的议价能力
- 买方的议价能力
- 新进入者的威胁
- 替代品的威胁
- 竞争对手之间的竞争
第五章 市场规模与成长预测
- 透过生长机制
- 水耕法
- 气耕
- 水耕法
- 按结构
- 建筑式垂直农场
- 基于货柜的垂直农场
- 按组件
- 照明
- 气候控制
- 感应器
- 其他水耕组件(营养液计量系统、惰性栽培基质等)
- 按作物
- 番茄
- 莓果
- 生菜和绿叶蔬菜
- 胡椒
- 黄瓜
- 微型菜苗
- 其他作物(菠菜、烹饪香草等)
- 按地区
- 北美洲
- 美国
- 加拿大
- 墨西哥
- 北美其他地区
- 欧洲
- 英国
- 法国
- 瑞典
- 其他欧洲地区
- 亚太地区
- 新加坡
- 中国
- 日本
- 台湾
- 亚太其他地区
- 中东
- 阿拉伯聯合大公国
- 沙乌地阿拉伯
- 以色列
- 其他中东地区
- 非洲
- 南非
- 肯亚
- 其他非洲地区
- 北美洲
第六章 竞争情势
- 市场集中度
- 策略趋势
- 市占率分析
- 公司简介
- Mowreq Specialized Agriculture Company
- GoodLeaf Farms(TruLeaf)
- Local Bounti Corporation
- Arable Grow
- Badia Farms
- 80 Acres Urban Agriculture Inc.
- Eden Green Technology
- Emirates Bustanica
第七章 市场机会与未来展望
The Vertical Farming Market size is estimated at USD 6.70 billion in 2025 and is projected to reach USD 16.88 billion by 2030, at a CAGR of 20.30% during the forecast period.
Robust expansion stems from tightening urban land availability, technological cost deflation, and rising institutional investment. North America retained leadership with a 39.1% revenue share in 2024, but the Middle East posts the fastest 15.5% CAGR through 2030 as food-security programs finance mega-facilities. Hydroponics held 57.1% of production value, while aeroponics outpaced at 24.1% CAGR thanks to superior yield-per-foot economics. Lighting accounted for the largest 38.5% capital outlay, yet climate-control systems show the quickest 20.2% growth as operators sharpen energy efficiency. Competition remains fragmented, with top-five vendors controlling over 20% of 2024 revenue, leaving ample room for specialized entrants and regional champions.
Global Vertical Farming Market Trends and Insights
Urbanization-driven demand for local fresh produce
Global urban residency is on track to reach 70% by 2050, intensifying pressure on metropolitan food logistics. Operators such as Eden Green deliver lettuce from harvest to shelf within 48 hours, cutting transport routes from thousands of miles to within city limits while using 99% less land and 98% less water. Singapore's "30 by 30" strategy illustrates national-level adoption, and solar-powered indoor farms are scaling to supply one-third of the city-state's nutritional needs by 2030.
LED, automation, and AI cost-down curve
Lighting now represents the single largest controllable expense. Cornell University trials lowered lettuce energy demand from 9.5 kilowatt-hours per kilogram to 6.42 kilowatt-hours per kilogram. Using spectrum-tuned LEDs and AI scheduling. Siemens and 80 Acres Farms further display how digital twins and robotics standardize workflows across global footprints.
High energy intensity and capex
Electricity absorbs 50-65% of operating budgets, trials record 12.5 kilowatt-hours per kilogram of lettuce, pressuring margins where grid tariffs exceed United States dollars 0.12 per kilowatt-hour. Light-emitting diodes now average 3.2 micromoles per joule, up from 2.5 micromoles per joule in 2023, and artificial intelligence-orchestrated heating, ventilation, and air conditioning trims another 25% load. Yet, container retrofits, while cheaper upfront at USD 15,000-20,000, struggle with poorer thermal mass and, thus, higher per-unit energy cost.
Other drivers and restraints analyzed in the detailed report include:
- Climate-resilient food systems amid extreme weather
- Government incentives and ag-tech investments
- Skill gap and operational complexity
For complete list of drivers and restraints, kindly check the Table Of Contents.
Segment Analysis
Hydroponics commanded 57.1% of the vertical farming market in 2024. Proven nutrient recipes, scalable hardware supply, and straightforward system maintenance keep it the first choice for large retailers. Aeroponics, growing at 24.1% CAGR, atomizes water into a fine mist, accelerating biomass by up to 30% and saving 95% water. The vertical farming market size for aeroponics is forecast to climb briskly alongside rising berry and vine-crop adoption. Despite lower current penetration, aquaponics creates symbiotic fish-and-vegetable revenue streams that hedge price volatility.
Commercial evaluations weigh capital intensity against throughput. Hydroponic rails cost USD 80-100 per square meter, while aeroponic towers exceed USD 140 but return faster cycles. Data-driven fertigation is narrowing this gap, and some operators hybridize both methods within the same facility. Insurance underwriters increasingly favor aeroponic redundancy because misting nozzles isolates root disease outbreaks, reducing recall exposure.
Buildings held 61.3% of 2024 revenue, reflecting supermarket-scale volumes and the ability to integrate rooftop solar or co-located waste-heat recovery. Container farms, though only a fraction, rose at 23.5% CAGR as universities, hospitals, and corporate campuses purchased turnkey modules. Freight Farms noted a 32% uptick in orders from nonprofits during 2024.
Economics diverges over asset life. Buildings amortize over 20-25 years and qualify for green-bond financing, containers depreciate in seven years and endure higher per-pound utility costs. Nevertheless, disaster-relief agencies value container mobility, dispatching units within 30 days after extreme weather knocks out supply chains.
The Vertical Farming Market Report is Segmented by Growth Mechanism (Hydroponics, Aeroponics, and Aquaponics), by Structure (Buidling-Based Vertical Farms and More), by Components (Lightning, Sensors, Climate Control, and More), by Crop (Tomato, Berries, Pepper, Cucumber, and More), and by Geography (North America, South America, Asia-Pacific, Europe, and More). The Market Forecasts are Provided in Terms of Value (USD).
Geography Analysis
North America remained the largest regional contributor, delivering 39.1% of 2024 revenue. USDA grants, retailer partnerships, and consumer willingness to pay a 20-30% premium for local greens underpin momentum. U.S. facilities, such as a USD 56 million, 30,000-square-meter complex in Georgia, illustrate how brownfield warehouses convert into year-round suppliers. Canada's GoodLeaf leverages hydroelectric tariffs to maintain a competitive cost of goods.
The Middle East is the vertical farming market's fastest region, expanding at 15.5% CAGR. Sovereign funds finance large enclosures to bolster food security amid arid climates. ECO-1 in Dubai, the world's largest vertical farm, now produces more than 2 million lb of leafy greens each year, and the UAE plans 500 additional sites by 2030. Systems here are frequently coupled with desalination plants, using waste heat and brine mineral streams to enhance resource efficiency.
Asia-Pacific shows mixed signals. Singapore accelerates solar-integrated towers to meet its "30 by 30" target, whereas several ventures in Malaysia shut down due to high electricity tariffs. China's state-backed institutes focus on multi-story greenhouse hybrids rather than full indoor builds. Europe faces zoning hurdles and high construction costs, yet Dutch greenhouse operators attract private equity funding. South America is emergent: Chile's AgroUrbana closed USD 6 million to quintuple capacity, and Mexican operators scale container clusters to serve resort corridors.
- Mowreq Specialized Agriculture Company
- GoodLeaf Farms (TruLeaf)
- Local Bounti Corporation
- Arable Grow
- Badia Farms
- 80 Acres Urban Agriculture Inc.
- Eden Green Technology
- Emirates Bustanica
Additional Benefits:
- The market estimate (ME) sheet in Excel format
- 3 months of analyst support
TABLE OF CONTENTS
1 Introduction
- 1.1 Study Assumptions and Market Definition
- 1.2 Scope of the Study
2 Research Methodology
3 Executive Summary
4 Market Landscape
- 4.1 Market Overview
- 4.2 Market Drivers
- 4.2.1 Urbanization-driven demand for local fresh produce
- 4.2.2 LED, automation, and AI cost-down curve
- 4.2.3 Climate-resilient food systems amid extreme weather
- 4.2.4 Government incentives and Ag-tech investments
- 4.2.5 Carbon-credit revenue stacking for VF operators
- 4.2.6 Corporate ESG on-site micro-farm installations
- 4.3 Market Restraints
- 4.3.1 High energy intensity and capex
- 4.3.2 Narrow crop portfolio profitability window
- 4.3.3 Skill gap and operational complexity
- 4.3.4 Unclear GMO micro-green regulatory pathway
- 4.4 Regulatory Landscape
- 4.5 Technological Outlook
- 4.6 Porters Five Forces
- 4.6.1 Bargaining Power of Suppliers
- 4.6.2 Bargaining Power of Buyers
- 4.6.3 Threat of New Entrants
- 4.6.4 Threat of Substitutes
- 4.6.5 Intensity of Competitive Rivalry
5 Market Size and Growth Forecasts (Value, USD)
- 5.1 By Growth Mechanism
- 5.1.1 Hydroponics
- 5.1.2 Aeroponics
- 5.1.3 Aquaponics
- 5.2 By Structure
- 5.2.1 Building-based Vertical Farms
- 5.2.2 Shipping-Container-based Vertical Farms
- 5.3 By Components
- 5.3.1 Lighting
- 5.3.2 Climate Control
- 5.3.3 Sensors
- 5.3.4 Other Hydroponic Components (nutrient dosing systems, inert grow media, etc.)
- 5.4 By Crop
- 5.4.1 Tomato
- 5.4.2 Berries
- 5.4.3 Lettuce and Leafy Greens
- 5.4.4 Pepper
- 5.4.5 Cucumber
- 5.4.6 Microgreens
- 5.4.7 Other Crops (spinach, culinary herbs, etc.)
- 5.5 By Geography
- 5.5.1 North America
- 5.5.1.1 United States
- 5.5.1.2 Canada
- 5.5.1.3 Mexico
- 5.5.1.4 Rest of North America
- 5.5.2 Europe
- 5.5.2.1 United Kingdom
- 5.5.2.2 France
- 5.5.2.3 Sweden
- 5.5.2.4 Rest of Europe
- 5.5.3 Asia-Pacific
- 5.5.3.1 Singapore
- 5.5.3.2 China
- 5.5.3.3 Japan
- 5.5.3.4 Taiwan
- 5.5.3.5 Rest of Asia-Pacific
- 5.5.4 Middle East
- 5.5.4.1 United Arab Emirates
- 5.5.4.2 Saudi Arabia
- 5.5.4.3 Israel
- 5.5.4.4 Rest of Middle East
- 5.5.5 Africa
- 5.5.5.1 South Africa
- 5.5.5.2 Kenya
- 5.5.5.3 Rest of Africa
- 5.5.1 North America
6 Competitive Landscape
- 6.1 Market Concentration
- 6.2 Strategic Moves
- 6.3 Market Share Analysis
- 6.4 Company Profiles (includes Global level Overview, Market level overview, Core Segments, Financials as available, Strategic Information, Market Rank/Share for key companies, Products and Services, and Recent Developments)
- 6.4.1 Mowreq Specialized Agriculture Company
- 6.4.2 GoodLeaf Farms (TruLeaf)
- 6.4.3 Local Bounti Corporation
- 6.4.4 Arable Grow
- 6.4.5 Badia Farms
- 6.4.6 80 Acres Urban Agriculture Inc.
- 6.4.7 Eden Green Technology
- 6.4.8 Emirates Bustanica
7 Market Opportunities and Future Outlook
 垂直农业市场(按产品、照明类型、作物类型、系统、安装类型和最终用户划分)—2025-2032 年全球预测
 垂直农业市场-全球产业规模、份额、趋势、机会和预测,按结构、生长机制、作物类型、成分、应用、地区和竞争进行细分,2020-2030 年
 2025年垂直农业全球市场报告
 2032年垂直农业市场预测:按作物类型、成分、结构、系统、应用和地区进行的全球分析
 美国垂直农业:市场份额分析、行业趋势和成长预测(2025-2030 年)
 垂直农业市场:2025-2029 年全球
 垂直农业市场机会、成长动力、产业趋势分析及 2025 - 2034 年预测
 2025-2033年垂直农业市场报告(按组件、结构、成长机制、应用和地区)日本垂直农业市场报告(按组件、结构、成长机制、应用和地区)2025-2033全球垂直农业市场:市场规模、份额和趋势分析(按组成部分、栽培方式、作物、结构和地区),按细分市场预测(2025-2030 年)