


 |
市场调查报告书
商品编码
1850308
网际网路通讯协定电视(IPTV):市场占有率分析、产业趋势、统计数据和成长预测(2025-2030 年)Internet Protocol Television (IPTV) - Market Share Analysis, Industry Trends & Statistics, Growth Forecasts (2025 - 2030) |
||||||
※ 本网页内容可能与最新版本有所差异。详细情况请与我们联繫。
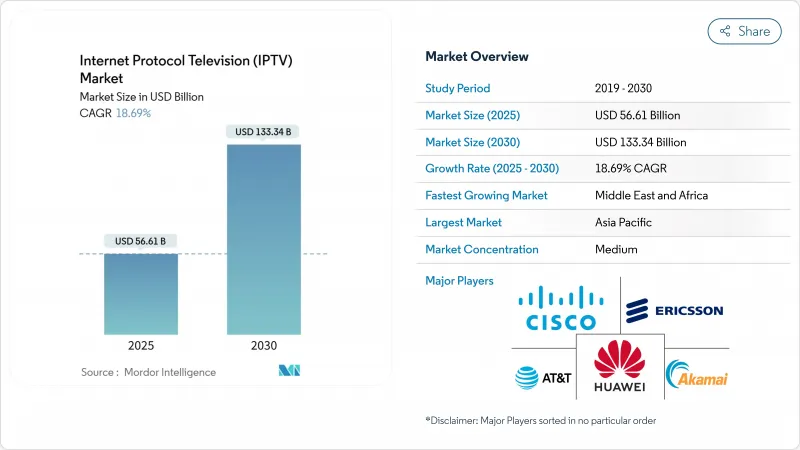
预计到 2025 年,IPTV 市场规模将达到 566.1 亿美元,预计到 2030 年将成长至 1,333.4 亿美元,预测期内复合年增长率为 18.69%。
光纤到府 (FTTH) 的普及、4K/8K 视讯需求的增长以及混合型用户和广告模式的兴起,共同推动了下一波需求浪潮,并将衡量成功的标准从用户增长转向每兆比特传输的观看时长。多播辅助架构降低了传输成本,提高了毛利率,而联网电视广告的插入则提升了入门级套餐的平均用户收入。拥有密集光纤网路覆盖范围的营运商报告称,随着家庭用户体验到零延迟的超高清串流媒体,高端用户的普及速度显着加快。
全球网际网路通讯协定电视(IPTV)市场趋势与洞察
光纤到户部署与4K/8K内容需求融合
美国营运商计划在2024年新增1,200万户光纤到户(FTTH)家庭,而日本、韩国和德国的营运商已在大都会圈扩展了对称Gigabit覆盖范围。光纤宽频协会指出,现有光纤可在35年的使用寿命内支援每秒600Terabit的传输速度,从而消除消费者视讯的「最后一公里」瓶颈。因此,串流媒体服务供应商可以自信地提供8K体育赛事和HDR自然纪录片,吸引用户订阅高级套餐。一家日本通讯业者透露,拥有Gigabit套餐的用户观看超高画质影片的长度比Gigabit用户多出32%,证明了频宽与用户参与度之间的直接联繫。到2025年,亚太地区25G和50G无源光网路(PON)的部署将为立体视讯和全像视讯频宽,使今天的资本投资成为应对未来身临其境型视讯格式的保障。
欧洲和北美超级聚合平台的兴起
一家西欧老牌业者于2024年推出了云端原生平台,将该国的点播影片、付费点播影片和体育直播整合到一个统一的搜寻平台。在西班牙,三分之二的新宽频用户在60天内透过营运商的控制面板启动了至少一个第三方应用程序,由此产生的批发平台费用抵消了线性广告收入的下滑。在美国,七家串流媒体服务提供商的收费整合使每位用户每月收入增加了4美元,而宽频价格并未上涨。一家区域性光纤合资企业获得了承包聚合中间件的授权,取代了传统的有线电视机上盒,儘管资本投入有限,却成为了IPTV市场的热门话题。从更宏观的角度来看:便利的内容发现将发行管道转变为商店,使营运商能够从每个新增的内容合作伙伴中获利。
成熟市场中持续的剪线潮转向纯OTT服务
预计到2024年,北美付费电视家庭用户数将进一步下降4%,因为消费者会将支出重点放在宽频和行动连线上,频道方案则沦为可附加元件。巴西天空电视台(Sky Brazil)计画于2024年4月全面转向光纤网络,凸显了现有业者将基础设施所有权视为抵御OTT(网路电视)普及的唯一保障。欧洲有线电视集团也纷纷效仿,透过过度建设光纤到府(FTTH)或将同轴电缆升级到DOCSIS 4.0来应对,但用户成长仍停滞不前。用户价值正转向低延迟接入,内容正从核心驱动力转变为提升销售。除非营运商能够提升IP传输的经济效益,否则即使总观看时间增加,IPTV市场的平均每用户收入(ARPU)仍面临停滞的风险。
细分市场分析
到2024年,随着营运商将託管营运、平台整合和客户支援外包,服务将占IPTV市场规模的61%。用于人工智慧主导的个人化引擎的预算正在增加,这些引擎可以在不增加内容成本的情况下延长观看时间。供应商提供云端原生支援服务和预测性维护,从而降低客户流失率和现场服务成本。利润取决于客户参与度,因此销售推荐演算法的服务合作伙伴会收取更高的费用。 IPTV市场也对那些将安全、分析和收费整合到单一服务等级协定(SLA)中的整合商给予了丰厚的回报,这使得营运商能够专注于扩展光纤网路。
传输和编码设备虽然目前基数较小,但预计到2030年将以22.4%的复合年增长率增长,因为低延迟边缘编码器对于4K体育赛事直播和互动式迭加至关重要。营运商发现,在2025年的现场升级中,将多播模组整合到用户网关中,可以在不牺牲位元率的情况下,将串流媒体每小时成本降低三分之一。随着转码器从H.264加速演进到AV1再到VVC,韧体可升级性如今已成为一个卖点。因此,硬体供应商正在推出面向未来的设计,以在8K普及率不断提高的情况下保护资本投资。竞争差异化正在转向每Gigabit传输的功率效率,这项指标正日益受到监管机构和投资者的关注。
到2024年,订阅模式将占IPTV市场份额的74.3%,因为许多家庭仍然偏爱无广告的节目库和捆绑的体育赛事通行证。多萤幕观看、云端DVR和跨装置回看等功能提升了IPTV的价值,尤其是在家庭用户中。营运商透过提供可兑换院线电影的串流积分来增强用户忠诚度计划,从而防止用户转向按月付费的OTT服务。然而,这些业者也不断推出价格较低的广告套餐,以吸引註重预算的观众,同时又不蚕食高端套餐的市场份额。
AVoD(广告支援视讯点播)产业正以28.7%的复合年增长率快速成长,这主要得益于广告技术的成熟,使其能够支援家庭级定向和可购物广告位。 2025年1月,加拿大一家杂货店在烹饪节目直播中投放的广告点击率高达9%,显示当广告与内容契合时,使用者有购买意愿。营运商正在将需求方平台(DSP)整合到其中间件中,以便直接获取广告收入,而不仅仅是支付传输费用。虽然按次付费(PPV)模式对于拳击和音乐会等热门节目仍然有效,但为了最大化用户终身价值,越来越多的赛事版权被纳入中檔订阅套餐中。最初为PPV微支付而设计的工具正被重新用于打赏和直播电商,从而拓展了每位观众的收入来源,使其不再局限于门票。
IPTV市场按组件(硬体、服务)、收入模式(订阅制、按次付费、广告支援)、串流媒体类型(直播/线性电视、时移/回放电视、视讯点播)、装置/接取平台(智慧型电视、行动装置/平板多播、PC/笔记型电脑、机上盒、串流媒体装置)、传输方式(群组播放器、单线设备/单线器)和地区进行细分。市场预测以美元计价。
区域分析
到2024年,亚太地区将占据IPTV市场35.8%的份额,其收入主要得益于光纤到府(FTTH)的广泛覆盖、智慧型手机的高普及率以及多语言内容库。中国平台透过同步播出主要体育赛事的普通话和粤语说明,最大限度地提高了版权费收入。日本的8K卫星广播测试吸引了都市区光纤用户选择高级套餐,这些套餐保证零降采样。印度的二线城市已经采用了每月699印度卢比(约8.45美元)的光纤+本地OTT套餐,将有线电视用户转变为IP用户。在超当地语系化电视剧以精准广告投放蓬勃发展,证明随着传输成本的降低,文化特色也能实现规模化成长。
中东和非洲的基数虽小,但预计到2030年将以24.7%的复合年增长率增长,这主要得益于模拟广播的淘汰和智慧型手机价格的下降刺激了市场需求。一家北非广播公司为了节省流量,以480p的分辨率播放了一部斋月剧,吸引了120万独立观众。尼日利亚的开放接入走廊以批发价出租频宽,并利用支援多播的路由器实现全城Wi-Fi覆盖。肯亚和加纳正在利用政府资金在传统电缆难以覆盖的农村地区推广光纤网路建设。价格实惠、高品质的串流媒体已成为最有效的反盗版工具。
北美和欧洲的IPTV市场已经成熟,但透过超聚合定价和联网电视广告实现盈利的模式仍在继续。一家北欧光纤合作社将Gigabit接入与四家独立串流服务捆绑销售,每月收费54.90欧元(约60.14美元)。儘管家庭用户成长缓慢,美国通讯业者仍利用行动套餐零费率来留住用户。拉丁美洲的发展路径则有所不同:巴西正准备采用ATSC 3.0地面电波-IP混合广播,而阿根廷和智利则避免对光纤进行投资,转而依赖卫星回程传输。用于农村光纤到府(FTTH)的频谱竞标收入正在推动安第斯市场从有线电视向IP电视转型,这可能会重塑该地区的IPTV格局。
其他福利:
- Excel格式的市场预测(ME)表
- 3个月的分析师支持
目录
第一章 引言
- 研究假设和市场定义
- 调查范围
第二章调查方法
第三章执行摘要
第四章 市场情势
- 市场概览
- 市场驱动因素
- 光纤网路部署与4K/8K内容需求的融合
- 欧洲和北美超级聚合平台的兴起
- 亚洲地区将IPTV与固定行动方案捆绑销售
- 广告支援的视讯点播 (AVoD) 获利模式
- 市场限制
- 成熟市场中用户持续停掉有线电视服务服务,转而使用纯OTT服务
- 体育赛事尖峰时段期单播频宽
- 监理展望
- 波特五力分析
- 新进入者的威胁
- 买方的议价能力
- 供应商的议价能力
- 替代品的威胁
- 竞争对手之间的竞争
- 投资分析
第五章 市场规模与成长预测
- 按组件
- 硬体
- 机上盒(STB)
- 中介软体
- 传输和编码设备
- 条件存取系统
- 服务
- 託管式 IPTV 服务
- 整合与咨询
- 支援与维护
- 硬体
- 按收入模式
- 订阅制
- 按次付费观看
- 广告支持型(AVoD)
- 按串流媒体类型
- 直播/线性电视
- 时移/重播电视
- 视讯点播
- 按设备/访问平台
- 智慧电视
- 手机和平板电脑
- 桌上型电脑/笔记型电脑
- 机上盒和串流媒体装置
- 按配送方式
- 多播IPTV
- 单播IPTV
- 按地区
- 北美洲
- 美国
- 加拿大
- 墨西哥
- 南美洲
- 巴西
- 阿根廷
- 其他南美洲
- 欧洲
- 德国
- 英国
- 法国
- 义大利
- 西班牙
- 其他欧洲地区
- 亚太地区
- 中国
- 日本
- 韩国
- 印度
- 澳洲
- 纽西兰
- 亚太其他地区
- 中东和非洲
- 中东
- 阿拉伯聯合大公国
- 沙乌地阿拉伯
- 其他中东地区
- 非洲
- 南非
- 奈及利亚
- 肯亚
- 其他非洲地区
- 北美洲
第六章 竞争情势
- Strategic Developments
- Vendor Positioning Analysis
- 公司简介
- AT & T Inc.
- Verizon Communications Inc.
- Deutsche Telekom AG
- China Telecom Corp. Ltd.
- Orange SA
- British Telecom plc
- Telefonica SA
- Dish Network Corp.
- Comcast Corp.
- Vodafone Group plc
- Akamai Technologies Inc.
- Cisco Systems Inc.
- Huawei Technologies Co. Ltd.
- Ericsson AB
- ARRIS(CommScope Holding Co.)
- Sagemcom Broadband SAS
- ZTE Corp.
- Imagine Communications Corp.
- Broadpeak SA
- Amino Technologies plc
- Tripleplay Services Ltd.
- Sterlite Technologies Ltd.
- Moftak Solutions
第七章 市场机会与未来展望
The IPTV market size is estimated at USD 56.61 billion in 2025 and is projected to scale to USD 133.34 billion by 2030, reflecting an 18.69% CAGR during the forecast window.
Fiber-to-the-home (FTTH) ubiquity, rising 4 K/8 K video appetite, and hybrid subscription-advertising models act together to unlock the next demand layer, moving the metric of success from headline subscriber additions to incremental viewing hours per delivered megabit. Lower transport cost from multicast-assisted architectures widens gross margins, while connected-TV ad insertion boosts average revenue per user on entry-level plans. Operators that already own dense fiber footprints report faster premium-tier uptake once households experience latency-free ultra-high-definition streams.
Global Internet Protocol Television (IPTV) Market Trends and Insights
Convergence of FTTH Roll-outs With 4 K/8 K Content Demand
Operators in the United States lit 12 million new FTTH homes in 2024, while peers in Japan, South Korea, and Germany extended symmetrical gigabit coverage to entire metropolitan belts. The Fiber Broadband Association notes that existing fibers can accommodate 600 terabits per second over a 35-year lifespan, eliminating last-mile constraints for consumer video. As a result, streaming providers confidently debut 8 K sports and HDR nature documentaries that lock customers into premium bundles. A Japanese carrier disclosed that households on its 10-gigabit plan stream 32% more ultra-HD hours than 1-gigabit users, proving a direct bandwidth-to-engagement link. Deployments of 25 G and 50 G PON in Asia-Pacific during 2025 quietly lay the groundwork for volumetric and holographic video, turning today's capex into insurance against future immersive formats.
Emergence of Super-Aggregation Platforms in Europe And North America
Western European incumbents launched cloud-native hubs in 2024 that unify national catch-up, subscription video-on-demand, and live sports in one search layer. In Spain, two-thirds of new broadband households activated at least one third-party app through the operator dashboard inside 60 days, generating wholesale platform fees that offset linear ad declines. Billing integration across seven U.S. streamers added USD 4 per user in incremental monthly revenue without raising broadband prices. Regional fiber ventures license turnkey aggregation middleware to leapfrog legacy cable boxes, placing them squarely in the IPTV market conversation despite limited capex. The larger picture is that discovery convenience converts distribution pipes into storefronts where operators monetize every additional content partner.
Persistent Cord-Cutting Toward Pure-OTT Services in Mature Markets
North American pay-TV households fell another 4% in 2024 as consumers focused spending on broadband and mobile connectivity, relegating channel bundles to optional add-ons. Sky Brasil's April 2024 pivot toward fiber underscores how incumbents view infrastructure ownership as the sole hedge against pure-play OTT disruption. European cable groups follow by over-building FTTH or upgrading coax to DOCSIS 4.0, yet subscriber growth remains flat. Customer value perception has shifted toward low-latency access, making content an upsell, not a core driver. Unless operators strengthen IP delivery economics, the IPTV market risks ARPU stagnation even if total viewing hours rise.
Other drivers and restraints analyzed in the detailed report include:
- Telco Bundling With Fixed-Mobile Convergent Plans in Asia
- AVoD Monetization Gains
- Unicast Bandwidth Bottlenecks During Peak Sporting Events
For complete list of drivers and restraints, kindly check the Table Of Contents.
Segment Analysis
Services represented 61% of the IPTV market size in 2024 as operators outsourced managed operations, platform integration, and customer support. Budgets increasingly flow to AI-driven personalization engines that raise viewing minutes without inflating content costs. Vendors offer cloud-native support desks and predictive maintenance that lower churn and truck-roll expenses. Because margins hinge on engagement, service partners selling recommendation algorithms command premium rates. The IPTV market also rewards integrators who wrap security, analytics, and billing into one SLA, letting operators focus on fiber expansion.
Transmission & encoding equipment, although smaller in base, is projected to grow at a 22.4% CAGR through 2030 as low-latency edge encoders become mandatory for live 4K sports and interactive overlays. Operators learned in the 2025 field upgrades that embedding multicast modules in consumer gateways cuts per-hour streaming cost by one-third without compromising bitrates. Firmware upgradability is now a selling point as codec evolution from H.264 to AV1 and VVC gathers pace. Hardware suppliers thus market future-proof designs that preserve capex even when 8K adoption rises. Competitive differentiation is shifting toward power efficiency per delivered gigabit, a metric regulators and investors increasingly scrutinize.
Subscriptions controlled 74.3% of the IPTV market share in 2024 because many households still prefer ad-free catalogs and bundled sports passes. Multi-screen allowances, cloud DVR, and cross-device resumption sustain perceived value, especially among families. Operators enrich loyalty programs by offering streaming credits redeemable for theatrical releases, preventing churn to month-to-month OTT rivals. Yet the same players keep introducing lower-priced ad tiers to capture budget-conscious viewers without cannibalizing premium packages.
AVoD is the fastest-growing slice, racing at 28.7% CAGR, fuelled by maturing ad tech that supports household-level targeting and shoppable placements. A January 2025 Canadian campaign for a grocer logged a 9% click-through rate within cooking show streams, evidencing purchase intent when ads align with content. Operators integrate demand-side platforms into middleware, capturing a direct share of ad revenue rather than mere carriage fees. Pay-per-view remains useful for marquee boxing or concerts, but event rights increasingly feed mid-tier subscription bundles to maximize lifetime value. Tools originally built for PPV micropayments are repurposed for tipping and live commerce, broadening revenue per viewer beyond tickets alone.
IPTV Market is Segmented by Component (Hardware, Services), Revenue Model (Subscription-Based, Pay-Per-View, Advertising-Supported), Streaming Type (Live/Linear TV, Time-Shifted/Replay TV, Video-On-Demand), Device/Access Platform (Smart TV, Mobile and Tablet, PC/Laptop, Set-Top Box and Media Streamer), Delivery Method (Multicast IPTV, Unicast IPTV), Geography. The Market Forecasts are Provided in Terms of Value (USD).
Geography Analysis
Asia-Pacific dominated revenue with 35.8% of the IPTV market in 2024, propelled by FTTH roll-outs, high smartphone penetration, and multilingual libraries. Chinese platforms simulcast Mandarin and Cantonese commentary on premier sports, maximizing rights fees. Japan's 8 K satellite trials nudged urban fiber households into premium plans that guarantee zero down-sampling. Tier-II Indian cities adopted bundled fiber plus local OTT packs at INR 699 (USD 8.45) per month, converting cable homes into IP ecosystems. Hyper-local dramas thrive on targeted advertising, proving that cultural specificity scales when transport costs fall.
The Middle East and Africa holds a smaller base but is forecast for a 24.7% CAGR through 2030 as analog switch-off deadlines and cheap smartphones stimulate demand. A North African broadcaster streamed Ramadan dramas at 480p to conserve data, attracting 1.2 million unique viewers. Nigeria's open-access corridors lease bandwidth at wholesale rates, enabling city-wide Wi-Fi with multicast-ready routers that lessen piracy by improving legitimate quality. Government funds earmarked for rural fiber accelerate uptake in Kenya and Ghana, where traditional cable never reached scale. Affordable, high-quality streams emerge as the most effective antipiracy tool.
North America and Europe are mature, yet monetization continues via super-aggregation fees and connected-TV ads. A Nordic fiber cooperative bundled gigabit access with four indie streamers for EUR 54.90 (USD 60.14) per month, tapping patriotic content demand amid macro pressures. U.S. carriers leverage zero-rating into mobile plans, retaining subscribers despite slower household growth. Latin America represents divergent paths: Brazil readies ATSC 3.0 hybrid terrestrial-IP, whereas Argentina and Chile rely on satellite backhaul pending fiber investment. Spectrum auction proceeds earmarked for rural FTTH could let Andean markets leapfrog cable straight to IP, reshaping the regional IPTV market landscape.
- AT & T Inc.
- Verizon Communications Inc.
- Deutsche Telekom AG
- China Telecom Corp. Ltd.
- Orange S.A.
- British Telecom plc
- Telefonica S.A.
- Dish Network Corp.
- Comcast Corp.
- Vodafone Group plc
- Akamai Technologies Inc.
- Cisco Systems Inc.
- Huawei Technologies Co. Ltd.
- Ericsson AB
- ARRIS (CommScope Holding Co.)
- Sagemcom Broadband SAS
- ZTE Corp.
- Imagine Communications Corp.
- Broadpeak S.A.
- Amino Technologies plc
- Tripleplay Services Ltd.
- Sterlite Technologies Ltd.
- Moftak Solutions
Additional Benefits:
- The market estimate (ME) sheet in Excel format
- 3 months of analyst support
TABLE OF CONTENTS
1 INTRODUCTION
- 1.1 Study Assumptions and Market Definition
- 1.2 Scope of the Study
2 RESEARCH METHODOLOGY
3 EXECUTIVE SUMMARY
4 MARKET LANDSCAPE
- 4.1 Market Overview
- 4.2 Market Drivers
- 4.2.1 Convergence of Fiber-to-Home Roll-outs With 4K/8K Content Demand
- 4.2.2 Emergence of Super-Aggregation Platforms in Europe and North America
- 4.2.3 Telco Bundling of IPTV With Fixed-Mobile Convergent Plans in Asia
- 4.2.4 Advertising-Supported Video-on-Demand (AVoD) Monetization Gains
- 4.3 Market Restraints
- 4.3.1 Persistent Cord-Cutting Toward pure-OTT Services in Mature Markets
- 4.3.2 Unicast Bandwidth Bottlenecks During Peak Sporting Events
- 4.4 Regulatory Outlook
- 4.5 Porter's Five Forces Analysis
- 4.5.1 Threat of New Entrants
- 4.5.2 Bargaining Power of Buyers
- 4.5.3 Bargaining Power of Suppliers
- 4.5.4 Threat of Substitutes
- 4.5.5 Competitive Rivalry
- 4.6 Investment Analysis
5 MARKET SIZE AND GROWTH FORECASTS (VALUE)
- 5.1 By Component
- 5.1.1 Hardware
- 5.1.1.1 Set-Top Box (STB)
- 5.1.1.2 Middleware
- 5.1.1.3 Transmission and Encoding Equipment
- 5.1.1.4 Conditional Access Systems
- 5.1.2 Services
- 5.1.2.1 Managed IPTV Services
- 5.1.2.2 Integration and Consulting
- 5.1.2.3 Support and Maintenance
- 5.1.1 Hardware
- 5.2 By Revenue Model
- 5.2.1 Subscription-Based
- 5.2.2 Pay-Per-View
- 5.2.3 Advertising-Supported (AVoD)
- 5.3 By Streaming Type
- 5.3.1 Live/Linear TV
- 5.3.2 Time-Shifted/Replay TV
- 5.3.3 Video-on-Demand
- 5.4 By Device/Access Platform
- 5.4.1 Smart TV
- 5.4.2 Mobile and Tablet
- 5.4.3 PC/Laptop
- 5.4.4 Set-Top Box and Media Streamer
- 5.5 By Delivery Method
- 5.5.1 Multicast IPTV
- 5.5.2 Unicast IPTV
- 5.6 By Geography
- 5.6.1 North America
- 5.6.1.1 United States
- 5.6.1.2 Canada
- 5.6.1.3 Mexico
- 5.6.2 South America
- 5.6.2.1 Brazil
- 5.6.2.2 Argentina
- 5.6.2.3 Rest of South America
- 5.6.3 Europe
- 5.6.3.1 Germany
- 5.6.3.2 United Kingdom
- 5.6.3.3 France
- 5.6.3.4 Italy
- 5.6.3.5 Spain
- 5.6.3.6 Rest of Europe
- 5.6.4 Asia-Pacific
- 5.6.4.1 China
- 5.6.4.2 Japan
- 5.6.4.3 South Korea
- 5.6.4.4 India
- 5.6.4.5 Australia
- 5.6.4.6 New Zealand
- 5.6.4.7 Rest of Asia-Pacific
- 5.6.5 Middle East and Africa
- 5.6.5.1 Middle East
- 5.6.5.1.1 United Arab Emirates
- 5.6.5.1.2 Saudi Arabia
- 5.6.5.1.3 Rest of Middle East
- 5.6.5.2 Africa
- 5.6.5.2.1 South Africa
- 5.6.5.2.2 Nigeria
- 5.6.5.2.3 Kenya
- 5.6.5.2.4 Rest of Africa
- 5.6.1 North America
6 COMPETITIVE LANDSCAPE
- 6.1 Strategic Developments
- 6.2 Vendor Positioning Analysis
- 6.3 Company Profiles (includes Global level Overview, Market level overview, Core Segments, Financials as available, Strategic Information, Products and Services, and Recent Developments)
- 6.3.1 AT & T Inc.
- 6.3.2 Verizon Communications Inc.
- 6.3.3 Deutsche Telekom AG
- 6.3.4 China Telecom Corp. Ltd.
- 6.3.5 Orange S.A.
- 6.3.6 British Telecom plc
- 6.3.7 Telefonica S.A.
- 6.3.8 Dish Network Corp.
- 6.3.9 Comcast Corp.
- 6.3.10 Vodafone Group plc
- 6.3.11 Akamai Technologies Inc.
- 6.3.12 Cisco Systems Inc.
- 6.3.13 Huawei Technologies Co. Ltd.
- 6.3.14 Ericsson AB
- 6.3.15 ARRIS (CommScope Holding Co.)
- 6.3.16 Sagemcom Broadband SAS
- 6.3.17 ZTE Corp.
- 6.3.18 Imagine Communications Corp.
- 6.3.19 Broadpeak S.A.
- 6.3.20 Amino Technologies plc
- 6.3.21 Tripleplay Services Ltd.
- 6.3.22 Sterlite Technologies Ltd.
- 6.3.23 Moftak Solutions
7 MARKET OPPORTUNITIES AND FUTURE OUTLOOK
- 7.1 White-space and Unmet-Need Assessment
 IPTV市场分析及预测(至2035年):依类型、产品、服务、技术、组件、应用、最终用户、部署方式及设备划分网际网路通讯协定电视 (IPTV) CDN 市场分析及预测(至 2035 年):按类型、产品类型、服务、技术、组件、应用、部署类型、最终用户、设备和解决方案划分
 IPTV市场规模、份额和成长分析(按服务类型、组件、收入模式、最终用户产业、设备类型和地区划分)-2026-2033年产业预测
 IPTV市场-全球产业规模、份额、趋势、机会及预测(按组件、设备类型、产品/服务、传输方式、终端用户产业、地区及竞争格局划分),2021-2031年网际网路通讯协定电视市场-全球产业规模、份额、趋势、机会及预测(依型号、服务、产业垂直领域、地区及竞争格局划分,2021-2031年)
 互联网通讯协定电视市场按订阅类型、组件、设备、最终用户和地区划分
 日本网际网路协定电视市场报告(按订阅类型、传输类型、装置类型、串流媒体类型、服务类型、最终用户和地区划分,2026-2034 年)
 网际网路通讯协定电视市场按服务类型、最终用户、部署模式、设备类型和组件划分 - 全球预测 2025-2032
 网际网路协定电视(IPTV)市场
 全球 IPTV 软体市场:市场规模、份额、趋势分析(按类型、设备类型、最终用途和地区划分)、细分市场预测(2025-2033 年)