


 |
市场调查报告书
商品编码
1850358
企业协作:市场占有率分析、产业趋势、统计数据和成长预测(2025-2030 年)Enterprise Collaboration - Market Share Analysis, Industry Trends & Statistics, Growth Forecasts (2025 - 2030) |
||||||
※ 本网页内容可能与最新版本有所差异。详细情况请与我们联繫。
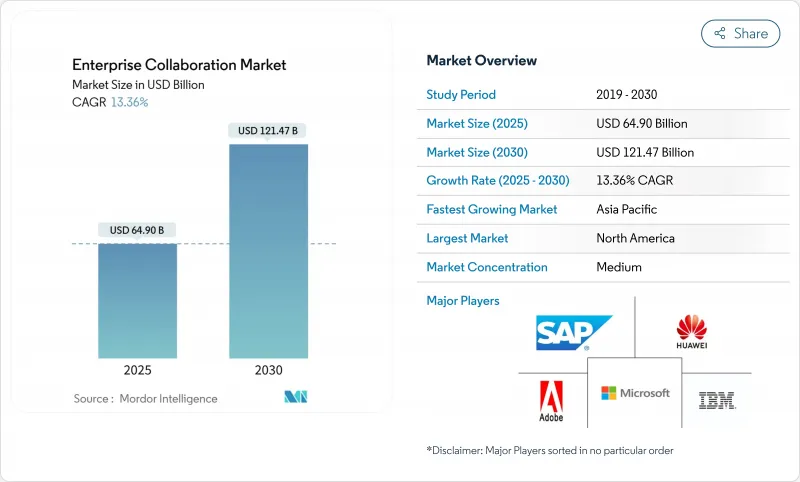
企业协作市场规模预计将在 2025 年达到 649 亿美元,到 2030 年将扩大到 1,214.7 亿美元,复合年增长率为 13.4%。
强劲成长与生成式人工智慧助理的快速普及、混合办公模式的兴起以及对能够统一语音、视讯、通讯和知识管理的安全、可扩展平台的需求密切相关。儘管软体仍然是主要的支出驱动因素,但随着企业寻求人工智慧整合的专业人才,服务成长正在加速。即使许多工作负载仍保留在本地,云端迁移仍然强劲。从区域来看,北美凭藉早期人工智慧应用保持了其收益主导,而亚太地区则凭藉5G部署、积极的数位基础设施投资和政府支援政策,成为突出的成长引擎。
全球企业协作市场趋势与洞察
API整合以统一分散的工作流程
现代企业平均每位员工要管理 9.4 个应用程序,这导致频繁切换应用程序,成本高昂。到 2026 年,75% 的公司计划部署支援人工智慧的通讯 API,将 CRM 系统、计划管理套件和通讯中心连接起来,将产品推出週期缩短 25%,并提升企业协作市场的生产力价值。成功的采用者会为他们的 AI 助理提供丰富的上下文信息,从而实现更流畅的数据同步、自动化繁琐的更新,并将员工从繁琐的工作中解放出来,让他们专注于更有价值的任务。
行动优先设计加速第一线用户采用
第一线员工占全球劳动力的80%,但迄今为止,他们一直缺乏专门设计的工具。行动原生介面能够实现即时任务管理,但与以桌面为中心的部署相比,其投资报酬率降低了391%。亚太地区凭藉其长期以来优先使用行动装置的消费行为,引领着这项转变,并推动了企业协作市场的成长。
人们越来越担心供应商锁定和互通性问题
监管机构目前正在调查云端生态系是否存在反竞争行为,而各公司则透过采用开放标准和容器化配置来反击,但重新培训使用者使用替代人工智慧介面的学习曲线仍然很高。
细分市场分析
至2024年,软体收入将占72.0%,巩固其作为企业协作市场核心平台层的地位。然而,随着企业意识到人工智慧助理需要客製化的回应工程、模型微调和管治框架,服务业务的复合年增长率将达到14.6%,超过整体13.4%的成长速度。预计2030年,企业协作服务市场规模将达373亿美元。供应商正在将培训、变更管理和持续优化等服务捆绑销售,这些合约的期限通常比传统协作协议长40%至60%。
历史数据显示,服务业的复合年增长率将从2019年至2024年的11.8%加速至2030年的14.6%,反映出人工智慧和边缘运算带来的日益增长的复杂性。像塔塔咨询服务公司(Tata Consultancy Services)这样的供应商正在建立行业专属的卓越中心,以帮助客户更快、更安全地进行人工智慧赋能的通讯。因此,在企业协作市场中,软体授权价值与服务交付创新之间的界线正变得模糊不清。
到2024年,本地部署解决方案将占总收入的68.5%,凸显了金融和政府等产业对资料主权规则日益增长的重视。云端采用率仍然较低,年复合成长率为14.3%,比本地部署高出3.7个百分点,这主要得益于企业寻求弹性消费模式和原生AI附加元件。预计到2030年,云端企业协作市场规模将达到385.6亿美元,显示将本地控制与云端创新结合的混合设计将成为架构蓝图的主流。
主权云端框架、边缘存取点和保密运算技术正在帮助企业协调监管限制与人工智慧发展目标。到2027年,70%的企业将以「数位主权」为标准来评估其服务提供者的选择。这项需求正在推动对区域资料中心和多重云端编配技能的需求,并促进企业协作服务产业的兴起。
企业协作市场报告按组件(软体和服务)、部署类型(云端基础和本地部署)、应用(通讯工具、会议工具、其他)、组织规模(大型企业和中小企业)、最终用户垂直行业(IT 和通讯、BFSI、其他)和地区进行细分。
区域分析
到2024年,北美将占全球营收的40.1%,反映出云端运算的广泛应用、人工智慧的早期采用以及风险资金筹措的活性化。该地区的企业如今正将生成式人工智慧融入面向客户的工作流程,将其视为保持竞争力的必要条件,从而支撑了两位数的持续成长。主权云端和边缘区域的扩展将使受监管行业能够在合规与创新之间取得平衡。
亚太地区是成长最快的地区,预计到2030年复合年增长率将达到14.0%。各国政府正大力投资5G骨干网路和云端基础设施,企业在人工智慧应用方面也获得了3.6倍的投资报酬率。行动优先的工作模式以及相应的政策支持,使亚太地区成为全球企业协作市场扩张的关键驱动力。在澳洲、日本和新加坡,数位主权框架与开放的云端生态系相结合,正在推动融合本地资料驻留和全球人工智慧资源的混合架构的建构。
欧洲正稳步推进,严格执行《数位市场法案》和《一般资料保护规范》(GDPR)有利于那些能够证明其资料保护措施高于行业标准的本地供应商。同时,拉丁美洲和中东及非洲地区正受惠于宽频普及率的提高和区域资料中心的激增。在墨西哥、巴西和阿联酋,边缘接入点的部署降低了延迟,即使在国际频宽成本高的情况下,也能支援人工智慧密集功能。
其他福利:
- Excel格式的市场预测(ME)表
- 3个月的分析师支持
目录
第一章 引言
- 研究假设和市场定义
- 调查范围
第二章调查方法
第三章执行摘要
第四章 市场情势
- 市场概览
- 市场驱动因素
- API整合以统一分散的工作流程
- 行动优先设计加速了现场应用。
- 生成式人工智慧助理可自动执行重复性任务
- 混合办公模式将推动统一通讯即服务 (UCaaS) 的普及。
- 垂直化「微套件」捆绑包
- 新兴市场的低延迟边缘接入点
- 市场限制
- 人们越来越担心供应商锁定和互通性问题
- 加强数据主权监管
- 「应用疲劳」会降低用户参与度KPI
- 协作堆迭中零日攻击的激增
- 价值链分析
- 监管格局
- 技术展望
- 波特五力分析
- 新进入者的威胁
- 供应商的议价能力
- 买方的议价能力
- 替代品的威胁
- 竞争对手之间的竞争
- 评估宏观经济趋势对市场的影响
第五章 市场规模与成长预测
- 按组件
- 软体
- 服务
- 依部署类型
- 云端基础
- 本地部署
- 透过使用
- 沟通工具
- 会议工具
- 协调/计划管理工具
- 社交和知识共用平台
- 按公司规模
- 大公司
- 小型企业
- 按最终用户产业
- 资讯科技/通讯
- BFSI
- 零售和消费品
- 医疗保健和生命科学
- 教育
- 运输/物流
- 旅游与饭店
- 其他行业
- 按地区
- 北美洲
- 美国
- 加拿大
- 墨西哥
- 欧洲
- 德国
- 英国
- 法国
- 义大利
- 西班牙
- 俄罗斯
- 其他欧洲地区
- 亚太地区
- 中国
- 日本
- 韩国
- 印度
- ASEAN
- 澳洲和纽西兰
- 其他亚太地区
- 南美洲
- 巴西
- 阿根廷
- 其他南美
- 中东和非洲
- 中东
- 沙乌地阿拉伯
- 阿拉伯聯合大公国
- 土耳其
- 其他中东地区
- 非洲
- 南非
- 奈及利亚
- 其他非洲国家
- 北美洲
第六章 竞争情势
- 市场集中度
- 策略趋势
- 市占率分析
- 公司简介
- Microsoft Corporation
- Cisco Systems Inc.
- Zoom Video Communications Inc.
- Slack Technologies Inc.(Salesforce)
- Google LLC
- IBM Corporation
- SAP SE
- Atlassian Corporation PLC
- Adobe Inc.
- Huawei Technologies Co. Ltd.
- Mitel Networks Corp.
- TIBCO Software Inc.
- Zoho Corp.
- Axero Solutions LLC
- Trello(Atlassian)
- monday.com Ltd.
- Asana Inc.
- Jive Software
- Poly(HP)
- RingCentral Inc.
第七章 市场机会与未来展望
The enterprise collaboration market size reached a valuation of USD 64.90 billion in 2025 and is projected to expand to USD 121.47 billion by 2030, reflecting a 13.4% CAGR.
Strong growth is tied to rapid adoption of generative-AI copilots, hybrid-work mandates, and the need for secure, scalable platforms that unify voice, video, messaging, and knowledge management. Software continues to anchor spending, though services rise faster as enterprises seek specialized AI integration talent. Cloud migration remains brisk despite data-sovereignty concerns that keep many workloads on-premise. Regionally, North America retains revenue leadership on the strength of early AI deployment, while Asia-Pacific emerges as the standout growth engine on the back of 5G rollouts, aggressive digital-infrastructure investment, and supportive government policy.
Global Enterprise Collaboration Market Trends and Insights
API Integration to Unify Fragmented Workflows
Modern enterprises juggle an average of 9.4 applications per worker, creating costly context-switching overhead. By 2026, 75% of firms plan to deploy AI-enabled communications APIs that connect CRM systems, project-management suites, and messaging hubs, cutting product launch cycles by 25% and lifting the enterprise collaboration market's overall productivity value. Successful adopters report smoother data synchronization that feeds AI copilots richer context, enabling them to automate mundane updates and free employees for higher-value tasks.
Mobile-First Design Accelerates Frontline Adoption
Frontline workers comprise 80% of the global workforce yet historically lacked purpose-built tools. Mobile-native interfaces now deliver real-time task management, saving firms as much as 391% ROI relative to desktop-centric rollouts. Asia-Pacific leads this shift due to long-standing mobile-first consumer behavior, propelling regional growth within the enterprise collaboration market.
Rising Vendor Lock-In and Interoperability Concerns
Regulators now probe cloud ecosystems for anti-competitive practices as egress fees and proprietary AI models create costly switching barriers. Enterprises counter by adopting open standards and containerized deployment, yet the learning curve of retraining users on alternative AI interfaces remains high.
Other drivers and restraints analyzed in the detailed report include:
- Generative-AI Copilots Automate Repetitive Tasks
- Hybrid-Work Mandates Boost UCaaS Deployments
- Verticalised "Micro-Suite" Bundles
- Low-Latency Edge Points of Presence (PoPs) in Emerging Markets
- Tightening Data-Sovereignty Regulations
For complete list of drivers and restraints, kindly check the Table Of Contents.
Segment Analysis
Software retained a 72.0% slice of 2024 revenue, cementing its role as the core platform layer in the enterprise collaboration market. Services, however, are forecast to expand at 14.6% CAGR, topping the overall 13.4% pace as enterprises recognize that AI copilots require custom prompt engineering, model fine-tuning, and governance frameworks. The enterprise collaboration market size for services is on track to reach USD 37.30 billion by 2030, reflecting sustained demand for professional and managed offerings. Vendors bundle training, change-management, and continuous optimization contracts that typically run 40-60% longer than traditional collaboration engagements.
Historical data show services CAGR accelerating from 11.8% during 2019-2024 to 14.6% through 2030, mirroring the escalating complexity that AI and edge computing introduce. Providers such as Tata Consultancy Services build industry-specific centers of excellence, enabling clients to launch AI-infused communications faster and with lower risk. As a result, the enterprise collaboration market continues to see a blurring line between software license value and service-delivered innovation.
On-premise solutions preserved 68.5% of 2024 revenue, underscoring the grip of data-sovereignty rules in sectors like finance and government. Cloud deployments, while smaller, are rising at a 14.3% CAGR-outpacing on-premise by 3.7 percentage points-as organizations pursue elastic consumption models and native AI add-ons. The enterprise collaboration market size for cloud implementations is projected to hit USD 38.56 billion by 2030, illustrating how hybrid designs that pair local control with cloud innovation will dominate architectural blueprints.
Sovereign-cloud frameworks, edge PoPs, and confidential-computing techniques help reconcile regulatory constraints with AI ambitions. By 2027, 70% of enterprises plan to evaluate provider choices through a "digital sovereignty" lens. That requirement inflates demand for regional data centers and multi-cloud orchestration skills, fueling the enterprise collaboration industry's services upswing.
The Enterprise Collaboration Market Report is Segmented by Component (Software and Services), Deployment Type (Cloud-Based and On-Premise), Application (Communication Tools, Conferencing Tools, and More), Organization Size (Large Enterprises and Small and Medium Enterprises (SMEs)), End-User Industry (IT and Telecommunication, BFSI, and More), and Geography.
Geography Analysis
North America generated 40.1% of 2024 revenue for the enterprise collaboration market, reflecting deep cloud penetration, early AI adoption, and robust VC funding. Regional enterprises now embed generative AI in customer-facing workflows as a competitive necessity, underpinning consistent double-digit growth. Expanding sovereign-cloud zones and edge zones ensure regulated sectors can balance compliance with innovation.
Asia-Pacific is the fastest-growing territory at 14.0% CAGR through 2030. Governments invest aggressively in 5G backbones and cloud infrastructure, while organizations report a 3.6X ROI on AI rollouts. Coupled with a mobile-first workforce and supportive policy regimes, this dynamic elevates Asia-Pacific to a primary engine of global expansion for the enterprise collaboration market. In Australia, Japan, and Singapore, digital-sovereignty frameworks align with open-cloud ecosystems, fostering hybrid architectures that blend local data residency with global AI resources.
Europe advances steadily on the back of the Digital Markets Act and strict GDPR enforcement, which favor local providers that can certify higher-than-standard data safeguards. Meanwhile, Latin America and the Middle East, and Africa benefit from improving broadband coverage and the proliferation of regional data centers. Edge PoP deployments in Mexico, Brazil, and the UAE reduce latency, supporting AI-heavy features even where international bandwidth is cost-prohibitive.
- Microsoft Corporation
- Cisco Systems Inc.
- Zoom Video Communications Inc.
- Slack Technologies Inc. (Salesforce)
- Google LLC
- IBM Corporation
- SAP SE
- Atlassian Corporation PLC
- Adobe Inc.
- Huawei Technologies Co. Ltd.
- Mitel Networks Corp.
- TIBCO Software Inc.
- Zoho Corp.
- Axero Solutions LLC
- Trello (Atlassian)
- monday.com Ltd.
- Asana Inc.
- Jive Software
- Poly (HP)
- RingCentral Inc.
Additional Benefits:
- The market estimate (ME) sheet in Excel format
- 3 months of analyst support
TABLE OF CONTENTS
1 INTRODUCTION
- 1.1 Study Assumptions and Market Definition
- 1.2 Scope of the Study
2 RESEARCH METHODOLOGY
3 EXECUTIVE SUMMARY
4 MARKET LANDSCAPE
- 4.1 Market Overview
- 4.2 Market Drivers
- 4.2.1 API integration to unify fragmented workflows
- 4.2.2 Mobile-first design accelerates frontline adoption
- 4.2.3 Generative-AI copilots automate repetitive tasks
- 4.2.4 Hybrid-work mandates boost UCaaS deployments
- 4.2.5 Verticalised "micro-suite" bundles
- 4.2.6 Low-latency edge PoPs in emerging markets
- 4.3 Market Restraints
- 4.3.1 Rising vendor lock-in and interoperability concerns
- 4.3.2 Tightening data-sovereignty regulations
- 4.3.3 "App-fatigue" lowers user-engagement KPIs
- 4.3.4 Escalating zero-day exploits on collaboration stacks
- 4.4 Value Chain Analysis
- 4.5 Regulatory Landscape
- 4.6 Technological Outlook
- 4.7 Porter's Five Forces Analysis
- 4.7.1 Threat of New Entrants
- 4.7.2 Bargaining Power of Suppliers
- 4.7.3 Bargaining Power of Buyers
- 4.7.4 Threat of Substitutes
- 4.7.5 Intensity of Competitive Rivalry
- 4.8 Assessment of the Impact of Macroeconomic Trends on the Market
5 MARKET SIZE AND GROWTH FORECASTS (VALUE)
- 5.1 By Component
- 5.1.1 Software
- 5.1.2 Services
- 5.2 By Deployment Type
- 5.2.1 Cloud-based
- 5.2.2 On-premise
- 5.3 By Application
- 5.3.1 Communication Tools
- 5.3.2 Conferencing Tools
- 5.3.3 Coordination / Project-Mgmt Tools
- 5.3.4 Social and Knowledge-Sharing Platforms
- 5.4 By Organisation Size
- 5.4.1 Large Enterprises
- 5.4.2 Small and Medium Enterprises (SMEs)
- 5.5 By End-user Industry
- 5.5.1 IT and Telecommunication
- 5.5.2 BFSI
- 5.5.3 Retail and Consumer Goods
- 5.5.4 Healthcare and Life Sciences
- 5.5.5 Education
- 5.5.6 Transportation and Logistics
- 5.5.7 Travel and Hospitality
- 5.5.8 Other Industries
- 5.6 By Geography
- 5.6.1 North America
- 5.6.1.1 United States
- 5.6.1.2 Canada
- 5.6.1.3 Mexico
- 5.6.2 Europe
- 5.6.2.1 Germany
- 5.6.2.2 United Kingdom
- 5.6.2.3 France
- 5.6.2.4 Italy
- 5.6.2.5 Spain
- 5.6.2.6 Russia
- 5.6.2.7 Rest of Europe
- 5.6.3 Asia-Pacific
- 5.6.3.1 China
- 5.6.3.2 Japan
- 5.6.3.3 South Korea
- 5.6.3.4 India
- 5.6.3.5 ASEAN
- 5.6.3.6 Australia and New Zealand
- 5.6.3.7 Rest of Asia-Pacific
- 5.6.4 South America
- 5.6.4.1 Brazil
- 5.6.4.2 Argentina
- 5.6.4.3 Rest of South America
- 5.6.5 Middle East and Africa
- 5.6.5.1 Middle East
- 5.6.5.1.1 Saudi Arabia
- 5.6.5.1.2 UAE
- 5.6.5.1.3 Turkey
- 5.6.5.1.4 Rest of Middle East
- 5.6.5.2 Africa
- 5.6.5.2.1 South Africa
- 5.6.5.2.2 Nigeria
- 5.6.5.2.3 Rest of Africa
- 5.6.1 North America
6 COMPETITIVE LANDSCAPE
- 6.1 Market Concentration
- 6.2 Strategic Moves
- 6.3 Market Share Analysis
- 6.4 Company Profiles (includes Global level Overview, Market level overview, Core Segments, Financials as available, Strategic Information, Market Rank/Share, Products and Services, Recent Developments)
- 6.4.1 Microsoft Corporation
- 6.4.2 Cisco Systems Inc.
- 6.4.3 Zoom Video Communications Inc.
- 6.4.4 Slack Technologies Inc. (Salesforce)
- 6.4.5 Google LLC
- 6.4.6 IBM Corporation
- 6.4.7 SAP SE
- 6.4.8 Atlassian Corporation PLC
- 6.4.9 Adobe Inc.
- 6.4.10 Huawei Technologies Co. Ltd.
- 6.4.11 Mitel Networks Corp.
- 6.4.12 TIBCO Software Inc.
- 6.4.13 Zoho Corp.
- 6.4.14 Axero Solutions LLC
- 6.4.15 Trello (Atlassian)
- 6.4.16 monday.com Ltd.
- 6.4.17 Asana Inc.
- 6.4.18 Jive Software
- 6.4.19 Poly (HP)
- 6.4.20 RingCentral Inc.
7 MARKET OPPORTUNITIES AND FUTURE OUTLOOK
- 7.1 White-space and Unmet-need Assessment
 企业协作市场(按组件、部署类型、组织规模和最终用户产业)—2025-2032 年全球预测
 全球虚拟协作市场
 企业协作服务市场(按解决方案、部署、类型、最终用途产业和地区)全球企业协作市场:市场规模、份额、趋势分析(按类型、组织规模、部署方式、最终用途和地区)、细分市场预测(2025-2030 年)美国企业协作市场:市场规模、份额、趋势分析(按类型、组织规模、部署方法和最终用途)、细分市场预测(2025-2030 年)2032 年企业协作市场预测:按类型、协作工具、部署类型、应用程式、最终用户和地区进行的全球分析
 企业协作市场规模、份额及成长分析(按类型、部署类型、公司规模、组件、垂直产业和地区)-2025 年至 2032 年产业预测
 2025年企业协作软体全球市场报告2025年企业协作全球市场报告
 亚太企业合作:市场占有率分析、产业趋势与统计、成长预测(2025-2030 年)