


 |
市场调查报告书
商品编码
1850978
休閒车:市场份额分析、行业趋势、统计数据和成长预测(2025-2030 年)Recreational Vehicle - Market Share Analysis, Industry Trends & Statistics, Growth Forecasts (2025 - 2030) |
||||||
※ 本网页内容可能与最新版本有所差异。详细情况请与我们联繫。
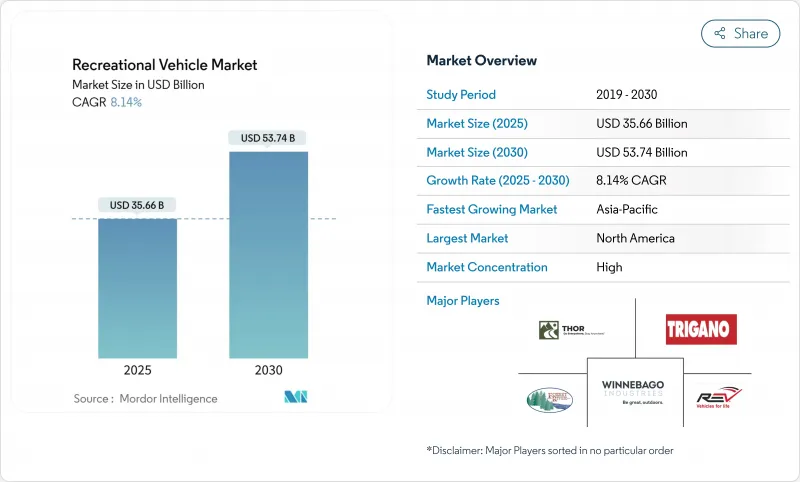
预计到 2025 年,休閒车市场规模将达到 356.6 亿美元,到 2030 年将达到 527.4 亿美元,年复合成长率为 8.14%。
混合办公模式推动了灵活出行方式的显着转变,扩大了客户群;露营地基础设施投资和P2P租赁平台则提升了车辆的可及性和利用率。主要汽车製造商的电气化项目和日益严格的排放气体法规正在加速产品创新,纯电动和混合模式有望成为未来的成长引擎。同时,利率波动和二手对短期市场情绪构成压力,而强劲的国内旅游业则支撑着稳健的需求。日益激烈的竞争核心在于软体定义汽车和直销管道,它们在挤压经销商利润的同时,也确保了订阅收入来源。
全球休閒车市场趋势与洞察
远距办公文化助长了人们对「移动生活」的需求。
到2024年,大多数露营者将在露营地工作,这意味着房车将兼具混合办公功能。冬季露营人数增加了40%,即使在疫情后也保持高位,推动了这一转变,并使全年需求趋于平稳。配备齐全的旅居车和旅行拖车,兼具可靠的网路连接和气候控制功能,因此更具优势。高所得地段的经销商报告称,每月销售稳定,降低了传统的季节性风险。汽车製造商正在增加可调式办公桌、更大容量的电池组和车顶天线,使连网生活成为核心卖点。
国内旅游业蓬勃发展,露营地基础设施也随之成长。
到2027年,计划新增超过18,000个露营地,扩大营地容量,使全套设施的运转率平均达到68%。电动车充电和光纤Wi-Fi等豪华设施将支撑每年5%的价格上涨,从而保护营运商的利润免受通货膨胀的影响。更密集的网路将缓解需要频繁维修的大型旅居车的里程焦虑。平均住宿延长至五晚将提高每个营位的收入,并吸引机构资本进入该行业。
高利率环境推高贷款成本
即使利率下降,信贷依然紧缩,抑制了对价格敏感的拖车类车辆的需求。平均交易价格超过10万美元的旅居车受到的影响最大,购买週期也随之延长。商用车队买家面临更长的投资回收期,导致车辆采购延迟。贷款机构正在实施更严格的承保标准,优先考虑优质借款人,并要求更高的首付。汽车製造商的专属式金融部门虽然提供了奖励,但利润压力限制了它们降低利率的幅度。
细分市场分析
到2024年,拖曳式旅居车将在2030年前以9.26%的复合年增长率显着增长。 B型厢式房车在大都会圈正蓬勃发展,因为那里停车位有限,人们更倾向于选择车长小于22英尺的车型。同时,旅行拖挂房车凭藉其强大的轴荷能力、灵活的拓展空间以及能够延长露营季的改进型保温系统,继续保持其销售主导。
高端第五轮拖车配备家用级电器和可与旅居车媲美的自动调平系统,巩固了其在豪华拖车细分市场的份额。折迭式露营车满足了储物空间有限的车主的需求,但来自小型旅居车的竞争抑制了其成长前景。 THOR 透过将 Entegra Coach 柴油动力房车生产线整合到 Tiffin 工厂,持续优化其高端旅居车产品线,提升规模效益。在各个产品类别中,积层製造和轻质复合材料在橱柜中的应用降低了车辆重量,提高了燃油经济性,并扩大了半吨级牵引车的适用范围。
到2024年,国内休閒销售额将占总收入的70.63%,反映出根深蒂固的露营文化以及寻求经济实惠度假方式的家庭数量的回升。同时,随着机构和企业买家扩大行动办公室、饭店套房和员工住房的车队规模,商业领域的复合年增长率将达到8.54%。
商用车的普及使汽车製造商的收入来源多元化,并降低了对週期性休閒的依赖。活动主办单位租赁A级豪华大巴作为高阶主管休息室,建设公司在偏远地区部署拖挂式房车作为现场住宿。续航里程达270英里的电动厢型车降低了短程接驳服务的总拥有成本。与清洁能源资产相关的税收优惠和加速折旧政策进一步提高了休閒车队的投资回报率,使车辆利用率远超平均每年18晚的休閒旅行。
休閒车市场按类型(拖曳式房车和旅居车)、用途(住宅和商用)、动力方式(内燃机、混合动力、纯电动房车)、长度(20英尺以下、20-30英尺、其他)和地区(北美、南美、欧洲、其他)进行细分。市场预测以价值(美元)和销售(辆)为单位。
区域分析
2024年,北美将占全球销量的59.52%,这主要得益于成熟的分销管道、资金筹措基础设施以及当地居民对公路旅行度假的热爱。随着市场日趋成熟,消费者将更加重视高阶配置(例如锂电池、智慧家庭系统、高级驾驶辅助系统),从而推高平均售价并提高盈利。远距办公模式将促进淡季销售的利用,缓解季节性波动,使经销商能够简化库存订购流程,并帮助财务部门降低营运成本。
德国、法国和英国占据了欧盟近三分之二的需求,但经济的不确定性和高昂的借贷成本正在抑製成长势头。製造商正在探索基于订阅的所有权模式,将保险、维护和露营地折扣打包在一起,从而降低领先门槛,并符合循环经济政策目标。在慷慨的公共投资支持下,斯堪地那维亚的露营地基础设施正在鼓励更多北部地区的企业采用这种模式,儘管这些地区的人口密度较低。
亚太地区将实现最快成长,到2030年复合年增长率将达到9.54%。中国和东南亚地区可支配收入的成长以及公路投资将扩大目标客户群体,而澳洲成熟的「露营车文化」将提供稳定且切实的需求。日本的人口结构将为基于轻型车的紧凑型露营车创造利基市场,这类露营车迎合了偏爱轻便、节能设备的年长旅行者的需求。韩国和泰国政府正在推出旅游促进津贴,以鼓励房车公园的开发,从而加快连接设施和污水处理站的建设。儘管外汇波动和奢侈品进口关税仍然是风险因素,但合资组装厂将有助于减轻关税的影响并缩短前置作业时间。
其他福利:
- Excel格式的市场预测(ME)表
- 3个月的分析师支持
目录
第一章 引言
- 研究假设和市场定义
- 调查范围
第二章调查方法
第三章执行摘要
第四章 市场情势
- 市场概览
- 市场驱动因素
- 远距办公文化支撑了人们对移动生活的需求
- 国内旅游业蓬勃发展,露营地基础设施也随之成长。
- 拓展房车融资和P2P租赁平台
- 零排放房车系列的OEM电气化蓝图
- 利用OTA连线解锁订阅收入来源
- 直接面向消费者的线上销售将压缩经销商的利润空间。
- 市场限制
- 高利率推高了贷款成本。
- 底盘和零件供应瓶颈依然存在
- 二手房车供应过剩导致价格下跌
- 市政当局严厉打击都市区夜间停车行为
- 价值链/供应链分析
- 监管环境
- 技术展望
- 波特五力分析
- 供应商的议价能力
- 买方的议价能力
- 新进入者的威胁
- 替代品的威胁
- 竞争对手之间的竞争
第五章 市场规模及成长预测(价值(美元)及销售量(单位))
- 按类型
- 拖曳式房车
- 旅行拖车
- 第五轮拖车
- 折迭式露营拖车
- 卡车露营车
- 露营车
- A级
- B级(露营车)
- C级
- 拖曳式房车
- 透过使用
- 首页/个人
- 商业用途(租赁车辆、移动办公室、活动)
- 透过推进力
- 内燃机(ICE)
- 杂交种
- 电池电电动房车
- 长度类别
- 20英尺或更短
- 20到30英尺
- 超过30英尺
- 按地区
- 北美洲
- 美国
- 加拿大
- 北美其他地区
- 南美洲
- 巴西
- 阿根廷
- 其他南美洲
- 欧洲
- 德国
- 英国
- 法国
- 西班牙
- 义大利
- 荷兰
- 其他欧洲地区
- 亚太地区
- 中国
- 日本
- 印度
- 韩国
- 澳洲和纽西兰
- 亚太其他地区
- 中东
- GCC
- 土耳其
- 其他中东地区
- 非洲
- 南非
- 奈及利亚
- 肯亚
- 其他非洲地区
- 北美洲
第六章 竞争情势
- 市场集中度
- 策略趋势
- 市占率分析
- 公司简介
- Thor Industries Inc.
- Forest River Inc.
- Winnebago Industries Inc.
- REV Group Inc.
- Trigano SA
- Knaus Tabbert AG
- Jayco Inc.
- Grand Design RV Co.
- Keystone RV Co.
- Airstream Inc.
- Hymer GmbH
- Burstner GmbH
- Dethleffs GmbH
- Hobby-Wohnwagenwerk
- Adria Mobil doo
- Triple E Recreational Vehicles
- Tiffin Motorhomes Inc.
- Coachmen RV
- Gulf Stream Coach Inc.
- Leisure Travel Vans
第七章 市场机会与未来展望
The recreational vehicle market is valued at USD 35.66 billion in 2025 and is forecast to advance to USD 52.74 billion by 2030, translating into an 8.14% CAGR.
A decisive shift toward flexible mobility enabled by hybrid work arrangements has broadened the customer base, while campground infrastructure investments and peer-to-peer rental platforms expand access and raise utilization rates. Electrification programs from leading OEMs and tightening emissions regulations accelerate product innovation, positioning battery-electric and hybrid models as future growth engines. At the same time, resilient domestic tourism supports steady demand, even as interest-rate volatility and a soft used-vehicle market weigh on short-term sentiment. Competitive intensity centers on software-defined vehicles and direct-to-consumer channels that compress dealer margins yet unlock subscription revenue streams.
Global Recreational Vehicle Market Trends and Insights
Remote-work culture sustaining "mobile-living" demand
Most of the campers worked from campsites in 2024, signalling that RVs now double as hybrid offices. The shift smooths demand across all seasons, supported by a 40% rise in winter camping that remains elevated after the pandemic. Motorhomes and well-equipped travel trailers gain an edge because they bundle reliable connectivity with climate control. Dealers in high-income corridors report steadier monthly throughput, reducing traditional seasonality risk. OEMs are adding adjustable desks, larger battery packs, and roof antennas, framing connected living as a core selling point.
Domestic tourism boom and campground infrastructure growth
More than 18,000 additional campsites are scheduled by 2027, expanding capacity where full hook-up occupancy averages 68%. Luxury amenities such as EV charging and fiber Wi-Fi support 5% yearly rate increases, protecting operator margins against inflation. Denser networks cut range anxiety for large motorhomes that need frequent service stops. Longer average stays of five nights boost revenue per pitch and attract institutional capital to the sector.
High interest-rate environment inflating loan costs
Credit remains tight even as rates ease, curbing demand in price-sensitive towable categories. Motorhomes, where average transaction values exceed USD 100,000, feel the squeeze most and purchase cycles lengthen. Commercial fleet buyers face extended payback periods that delay vehicle procurement. Lenders apply stricter underwriting, favoring prime borrowers and requiring higher down payments. OEM captive finance arms offer incentives, yet margin pressure limits how deeply they can buy down rates.
Other drivers and restraints analyzed in the detailed report include:
- Expansion of RV financing and peer-to-peer rentals
- OEM electrification road maps for zero-emission lines
- Oversupply of used RVs driving price depreciation
For complete list of drivers and restraints, kindly check the Table Of Contents.
Segment Analysis
Towable designs led revenue with 62.44% in 2024, retaining the broadest appeal among first-time buyers because they leverage existing tow vehicles and carry lower maintenance costs. Yet motorhomes are set to capture outsized value, advancing at a 9.26% CAGR through 2030 as connectivity, safety tech, and luxury finishes migrate from passenger car segments. The Class B van niche gains momentum in metro corridors where parking constraints and agile lifestyle needs favor sub-22 ft footprints. Travel trailers, meanwhile, sustain volume leadership thanks to robust axle capacity, slide-out versatility, and improved thermal packages that lengthen the camping season.
Premium fifth-wheel trailers consolidate share within the luxury towable subset, offering residential-grade appliances and auto-leveling systems that rival motorhomes. Folding campers cater to storage-challenged owners, but competition from micro motorhomes dampens growth prospects. THOR's move to consolidate Entegra Coach's diesel-pusher production under Tiffin enhances scale efficiencies and signals continued rationalization in high-price motorhome lines. Across categories, additive manufacturing of cabinetry and lightweight composites trim curb weight, boosting fuel economy, and expanding half-ton tow-vehicle compatibility.
Domestic leisure accounted for 70.63% revenue in 2024, reflecting entrenched camping culture and the post-pandemic re-engagement of families seeking affordable vacations. Still, institutional and corporate buyers are scaling fleets for mobile offices, hospitality suites and workforce housing, propelling the commercial segment to an 8.54% CAGR over the outlook period.
Commercial adoption diversifies revenue streams for OEMs and mitigates cyclical leisure exposure. Event organizers lease Class A coaches as executive green rooms, while construction firms deploy fifth-wheels for on-site accommodation in remote areas. Electric van-based models with 270-mile real-world range lower total cost of ownership for short-haul shuttle services. Tax incentives tied to clean-energy assets and accelerated depreciation schedules further sweeten ROI for corporate fleets, pushing utilization rates well above the leisure average of 18 nights per year.
The Recreational Vehicle Market Report Segmented by Type (Towable RVs and Motorhomes), Application (Domestic and Commercial), Propulsion (Internal Combustion Engine, Hybrid, and Battery Electric RVs), Length Category (Below 20-Ft, 20-30 Ft, and More), and Geography (North America, South America, Europe, and More). The Market Forecasts are Provided in Terms of Value (USD) and Volume (Units).
Geography Analysis
North America generated 59.52% of global revenue in 2024, underpinned by mature distribution, financing infrastructure, and cultural familiarity with road-trip vacations. Market maturation shifts focus toward premium features-lithium house batteries, smart-home interfaces, and advanced driver assistance systems-that raise ASPs and enhance profitability. Seasonal volatility moderates as remote-work patterns extend shoulder-season usage, allowing dealers to smooth inventory ordering and finance departments to reduce flooring costs.
Europe contributes a stable but slower-growing slice, where stringent emissions rules and road-size constraints favor compact motorcaravans under 6 m. Germany, France, and the United Kingdom represent nearly two-thirds of EU demand, but economic uncertainty and high borrowing costs temper momentum. Manufacturers explore subscription-based ownership models that bundle insurance, maintenance, and campground discounts, reducing upfront barriers and aligning with circular-economy policy goals. Scandinavian camping infrastructure-supported by generous public investment-nudges adoption northward despite sparse population density.
Asia-Pacific registers the fastest expansion at 9.54% CAGR through 2030. Rising disposable income and highway investment in China and Southeast Asia broaden the target customer pool, while Australia's entrenched "caravan culture" delivers consistent base demand. Japanese demographics create a niche for compact Kei-based campers that satisfy elder travelers who favor lightweight, fuel-efficient devices for regional trips. Governments in South Korea and Thailand introduce tourism stimulus grants for RV park development, accelerating supply of hookups and dump stations. Currency fluctuations and luxury-good import duties remain risk factors, but joint-venture assembly plants mitigate tariff exposure and shorten lead times.
- Thor Industries Inc.
- Forest River Inc.
- Winnebago Industries Inc.
- REV Group Inc.
- Trigano SA
- Knaus Tabbert AG
- Jayco Inc.
- Grand Design RV Co.
- Keystone RV Co.
- Airstream Inc.
- Hymer GmbH
- Burstner GmbH
- Dethleffs GmbH
- Hobby-Wohnwagenwerk
- Adria Mobil d.o.o
- Triple E Recreational Vehicles
- Tiffin Motorhomes Inc.
- Coachmen RV
- Gulf Stream Coach Inc.
- Leisure Travel Vans
Additional Benefits:
- The market estimate (ME) sheet in Excel format
- 3 months of analyst support
TABLE OF CONTENTS
1 Introduction
- 1.1 Study Assumptions and Market Definition
- 1.2 Scope of the Study
2 Research Methodology
3 Executive Summary
4 Market Landscape
- 4.1 Market Overview
- 4.2 Market Drivers
- 4.2.1 Remote-Work Culture Sustaining Mobile Living" Demand"
- 4.2.2 Domestic Tourism Boom and Campground Infrastructure Growth
- 4.2.3 Expansion Of RV Financing and Peer-To-Peer Rental Platforms
- 4.2.4 OEM Electrification Road-Maps For Zero-Emission RV Lines
- 4.2.5 OTA Connectivity Unlocking Subscription Revenue Streams
- 4.2.6 Direct-To-Consumer Online Sales Shrinking Dealer Margins
- 4.3 Market Restraints
- 4.3.1 High Interest-Rate Environment Inflating Loan Costs
- 4.3.2 Persistent Chassis and Component Supply Bottlenecks
- 4.3.3 Oversupply of Used RVs Driving Price Depreciation
- 4.3.4 Municipal Crack-Downs On Urban Overnight Parking
- 4.4 Value/Supply-Chain Analysis
- 4.5 Regulatory Landscape
- 4.6 Technological Outlook
- 4.7 Porter's Five Forces Analysis
- 4.7.1 Bargaining Power of Suppliers
- 4.7.2 Bargaining Power of Buyers
- 4.7.3 Threat of New Entrants
- 4.7.4 Threat of Substitutes
- 4.7.5 Competitive Rivalry
5 Market Size and Growth Forecasts (Value (USD) and Volume (Units))
- 5.1 By Type
- 5.1.1 Towable RVs
- 5.1.1.1 Travel Trailers
- 5.1.1.2 Fifth-Wheel Trailers
- 5.1.1.3 Folding Camp Trailers
- 5.1.1.4 Truck Campers
- 5.1.2 Motorhomes
- 5.1.2.1 Class A
- 5.1.2.2 Class B (Camper Vans)
- 5.1.2.3 Class C
- 5.1.1 Towable RVs
- 5.2 By Application
- 5.2.1 Domestic/Personal Use
- 5.2.2 Commercial (Rental Fleets, Mobile Offices, Events)
- 5.3 By Propulsion
- 5.3.1 Internal-Combustion Engine (ICE)
- 5.3.2 Hybrid
- 5.3.3 Battery-Electric RVs
- 5.4 By Length Category
- 5.4.1 Below 20 ft
- 5.4.2 20 - 30 ft
- 5.4.3 Above 30 ft
- 5.5 By Geography
- 5.5.1 North America
- 5.5.1.1 United States
- 5.5.1.2 Canada
- 5.5.1.3 Rest of North America
- 5.5.2 South America
- 5.5.2.1 Brazil
- 5.5.2.2 Argentina
- 5.5.2.3 Rest of South America
- 5.5.3 Europe
- 5.5.3.1 Germany
- 5.5.3.2 United Kingdom
- 5.5.3.3 France
- 5.5.3.4 Spain
- 5.5.3.5 Italy
- 5.5.3.6 Netherlands
- 5.5.3.7 Rest of Europe
- 5.5.4 Asia-Pacific
- 5.5.4.1 China
- 5.5.4.2 Japan
- 5.5.4.3 India
- 5.5.4.4 South Korea
- 5.5.4.5 Australia and New Zealand
- 5.5.4.6 Rest of Asia-Pacific
- 5.5.5 Middle East
- 5.5.5.1 GCC
- 5.5.5.2 Turkey
- 5.5.5.3 Rest of Middle East
- 5.5.6 Africa
- 5.5.6.1 South Africa
- 5.5.6.2 Nigeria
- 5.5.6.3 Kenya
- 5.5.6.4 Rest of Africa
- 5.5.1 North America
6 Competitive Landscape
- 6.1 Market Concentration
- 6.2 Strategic Moves
- 6.3 Market Share Analysis
- 6.4 Company Profiles (Includes Global level Overview, Market level Overview, Core Segments, Financials as available, Strategic Information, Market Rank/Share for key companies, Products and Services, Recent Developments)
- 6.4.1 Thor Industries Inc.
- 6.4.2 Forest River Inc.
- 6.4.3 Winnebago Industries Inc.
- 6.4.4 REV Group Inc.
- 6.4.5 Trigano SA
- 6.4.6 Knaus Tabbert AG
- 6.4.7 Jayco Inc.
- 6.4.8 Grand Design RV Co.
- 6.4.9 Keystone RV Co.
- 6.4.10 Airstream Inc.
- 6.4.11 Hymer GmbH
- 6.4.12 Burstner GmbH
- 6.4.13 Dethleffs GmbH
- 6.4.14 Hobby-Wohnwagenwerk
- 6.4.15 Adria Mobil d.o.o
- 6.4.16 Triple E Recreational Vehicles
- 6.4.17 Tiffin Motorhomes Inc.
- 6.4.18 Coachmen RV
- 6.4.19 Gulf Stream Coach Inc.
- 6.4.20 Leisure Travel Vans
7 Market Opportunities and Future Outlook
 全球休閒车金融市场休閒车复合板的全球市场。
 全球旅居车和拖挂式房车市场规模(按产品类型、应用、区域范围和预测)
 2025-2029年全球休閒车(RV)租赁市场
 北美休閒车:市场占有率分析、行业趋势和统计数据、成长预测(2025-2030 年)
 休閒车 (RV),全球市场,2025-2029 年
 2030 年休閒车市场预测:按车辆类型、燃料类型、价格分布、应用、最终用户和地区进行的全球分析休閒车市场机会、成长动力、产业趋势分析与 2025 - 2034 年预测全球休閒车 (RV) 市场:按产品类型、按组件、按 RV 外观、按 RV 内饰、按生活方式配件、按应用、按地区、范围和预测
 休閒车市场规模、份额、成长分析(按车辆类型、应用、按地区)- 产业预测,2024-2031 年