


 |
市场调查报告书
商品编码
1851074
美国货运经纪:市场份额分析、行业趋势、统计数据和成长预测(2025-2030 年)United States Freight Brokerage - Market Share Analysis, Industry Trends & Statistics, Growth Forecasts (2025 - 2030) |
||||||
※ 本网页内容可能与最新版本有所差异。详细情况请与我们联繫。
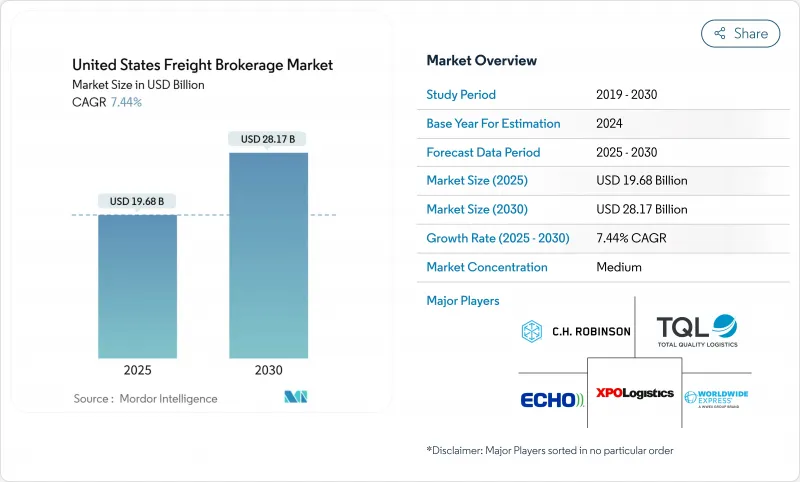
美国货运经纪市场预计到 2025 年将达到 196.8 亿美元,到 2030 年将达到 281.7 亿美元,预测期内复合年增长率为 7.44%。
成长动能主要得益于数位化货运平台的快速普及、持续的电子商务需求以及联邦政府对基础设施的持续投资。技术赋能的仲介正在扩大自动化程度以缩短交易时间,而传统仲介业者则转向整合以获得规模优势。司机短缺和对现货市场日益增长的依赖,使得那些拥有庞大承运商网路和即时定价引擎的仲介业者更具优势。同时,自有资产承运商正在增设经纪业务部门以维持利润率,迫使纯粹的货运仲介透过专业的合规服务、温控运力或运输管理合约等方式来脱颖而出。预测数位化、电子记录数据和创业融资的整合预计将进一步扩大数位成熟企业和落后企业之间的绩效差距,重塑美国货运代理市场的竞争格局。
美国货运经纪市场趋势与洞察
国内货车负载容量短缺及司机短缺
驾驶者的高流动率持续造成运力紧张,导致现货竞标被拒率不断上升。中型货主越来越依赖仲介业者来确保在合约承运商拒绝竞标时获得卡车。随着自动发布资讯缩短了紧急货运所需的时间,数位化货运平台正在吸引越来越多的货运量。远距冷藏运输线路的司机短缺问题最为严重,这提高了仲介在该细分市场的议价能力。承运商要求更高的运费以抵消留任奖金,而精明的仲介则将回程传输机会打包出售,以确保卡车持续运作。因此,即使自有车队扩大了直接销售,运力紧张仍然使仲介保持着重要的地位。
电子商务小包裹量增加
快速的线上订购正在改变货运模式,使其朝着更小、更频繁的运输方向发展,从而提升小件包裹的运输能力。预计到2025年,主要零担货运公司将把一般货运费率提高4.9%至7.9%,这表明托盘空间将受到限制。计划于2025年7月实施的基于密度的货运重新分类将增加较轻型电商小包裹的成本,并凸显仲介经纪人在货物分类方面的专业知识的重要性。随着托运人寻求即时成本可见性,提供动态报价的数位零担货运平台将获得更大的市场份额。能够将小包裹预先包装成零担货物的仲介可以透过降低单件运输成本来获得额外价值。因此,美国货运经纪市场正受惠于电子商务向中末端配送优化方向的根本性转变。
柴油价格波动
预计2024年美国柴油平均价格将在每加仑3.43美元至4.58美元之间波动,涨幅超过燃油额外费用的调整幅度,挤压了仲介的现货利润。大型仲介正在实施包含美国能源资讯署资料的避险模型来预测额外费用,而小型仲介往往定价错误,损害了收入净额的利润。冷藏运输线路受到冷藏车燃油消耗过高的严重衝击。一些仲介正在发布包含即时燃油条款的「全包」报价,以保持价格透明度并确保利润。价格波动的不确定性使得托运人不愿锁定年度运价,转而选择以交易为基础的现货经纪服务。
细分市场分析
美国货运经纪市场规模将继续以整车运输 (FTL) 为主,预计到 2024 年将占总收入的 63.75%,而零担运输 (LTL) 的复合年增长率 (CAGR) 到 2030 年将达到 9.0%。能够在几秒钟内提供托盘级报价的数位化平台正在从人工电话和传真工作流程中抢占业务量。将于 2025 年 7 月生效的基于密度的重新分类将奖励那些能够重新设计包装尺寸的仲介,使托运人能够避免将轻型大件产品归入较高等级的运费类别。
儘管整车运输 (FTL) 仍占据远距工业货运的大部分份额,但司机短缺和设备限制正促使托运人转向零担 (LTL) 多枢纽整合。包裹转零担 (LTL) 整合枢纽能够缓解最后一公里拥塞并降低单位成本,使仲介能够透过增值交叉转运服务获得新的利润。专业仲介也在利用「部分整车」服务来弥合零担 (LTL) 和整车 (FTL) 之间的差距。因此,多元化服务能力如今已成为在货运代理市场赢得各种招标项目 (RFP) 的基准。
到2024年,干货车将占总收入的44.65%,而冷藏车将以10.1%的复合年增长率成长,这将推动美国货运经纪市场在该设备细分领域的规模在预测期内扩大。食品和药品托运人对温度验证和电子封条的需求日益增长,这使得拥有配备远端资讯处理系统的承运商资源的仲介更具优势。
西海岸特色农产品出口的成长将推动对中西部和东部冷藏回程传输运输的需求。仲介正将温度监控和滞期费减免纳入定价溢价。平板车和阶梯式平板车设施将在春季施工期间激增,而油罐车仲介由于危险品垫合规方面的负担,仍处于小众市场。因此,设施的灵活性将是赢得2025年多模态合约的关键。
美国货运仲介市场报告按服务类型(例如整车运输)、设备/拖车类型(例如干货厢式货车)、运输距离(例如远距)、经营模式(例如传统货运仲介)、最终用户(例如製造业)、客户规模(例如大型企业)和地区(例如东北部)进行细分。该报告提供了上述所有细分市场的市场规模和预测(以美元计)。
其他福利:
- Excel格式的市场预测(ME)表
- 3个月的分析师支持
目录
第一章 引言
- 研究假设和市场定义
- 调查范围
第二章调查方法
第三章执行摘要
第四章 市场情势
- 市场概览
- 市场驱动因素
- 国内货车负载容量和司机短缺推高了现货仲介的活动。
- 电子商务小包裹量的成长推动了零担仲介的采用。
- 托运人对运输管理和第四方物流解决方案的需求
- 电子记录设备(ELD)强制令增加对合规承运商仲介的依赖
- 创业投资将加速数位化货运匹配平台的资金筹措
- 《基础设施投资与就业法案》(IIJA)重新运作建筑相关货物运输
- 市场限制
- 柴油价格波动对仲介的现货利润带来压力。
- 港口拥挤和底盘短缺威胁运输可靠性
- 资产型承运商扩大直接托运人中介业务(利润率承压)
- 仲介保证金要求和联邦政府对诈欺案件的监管力度加大
- 价值/供应链分析
- 主要政府法规与措施(HOS、AB5、限速器NPRM)
- 技术概览(数位货运经纪、物联网、人工智慧、视觉化API)
- 波特五力模型
- 供应商的议价能力
- 买方的议价能力
- 新进入者的威胁
- 替代品的威胁
- 竞争对手之间的竞争
- 美国物流业概览
- 现货卡车运费与合约卡车运费的分析
- 地缘政治事件如何影响市场
第五章 市场规模与成长预测
- 透过服务
- 整车运输 (FTL)
- 低于100%的运费(零担运输)
- 其他的
- 依设备/拖车类型
- 干货车
- 冷藏车
- 平板/阶梯式平板车
- 油轮(散装液体和化学品)
- 其他的
- 按运输距离
- 远距运输(超过 500 英里)
- 按地区(100-500英里)
- 本地(100英里以内)
- 按经营模式
- 传统货运代理
- 基于资产的货运经纪
- 代理模式货运经纪
- 数位货运经纪
- 按最终用户行业划分
- 製造业和汽车业
- 建筑和基础设施计划
- 石油、天然气、采矿和化工
- 农业和食品
- 零售、快速消费品和批发分销
- 医疗保健和製药
- 电子商务与第三方物流履约
- 其他终端用户产业
- 按客户规模
- 大型企业货主(货物使用量超过1亿美元)
- 中型货运公司(年营业额1000万美元至1亿美元)
- 小型企业(营业额低于1000万美元)
- 按地区
- 东北
- 中西部
- 东南
- 西南
- 西
第六章 竞争情势
- 市场集中度
- 策略性倡议(併购、资金筹措、伙伴关係)
- 市占率分析
- 公司简介
- CH Robinson Worldwide Inc.
- Total Quality Logistics(TQL)
- XPO Logistics Inc.
- Echo Global Logistics
- Worldwide Express
- Coyote Logistics(UPS)
- Landstar System Inc.
- Schneider FreightPlus
- GlobalTranz(WWEX)
- JB Hunt 3600
- Hub Group
- Uber Freight
- BNSF Logistics
- SunteckTTS
- Arrive Logistics
- Nolan Transportation Group
- Mode Global
- Convoy Inc.
- Red Technologies
- ArcBest Corporation
- Allen Lund Company
- Redwood Logistics
- BlueGrace Logistics
- Trinity Logistics
第七章 市场机会与未来展望
The United States freight brokerage market is valued at USD 19.68 billion in 2025 and is set to reach USD 28.17 billion by 2030, registering a 7.44% CAGR through the forecast period.
Growth momentum is supported by the rapid uptake of digital freight platforms, sustained e-commerce demand, and continued federal investment in infrastructure. Tech-enabled brokers are scaling automation to compress transaction time, while traditional intermediaries look to mergers for scale advantages. Driver shortages and heightened spot-market reliance continue to favor intermediaries that maintain deep carrier networks and real-time pricing engines. At the same time, asset-based carriers are bolting on brokerage desks to protect margins, forcing pure-play brokers to differentiate through specialized compliance, temperature-controlled capacity, or managed-transport contracts. The convergence of predictive analytics, electronic logging data, and venture funding is expected to widen the performance gap between digitally mature and lagging firms, thereby reshaping competitive hierarchies across the United States freight brokerage market.
United States Freight Brokerage Market Trends and Insights
Tight Domestic Truckload Capacity and Driver Shortage
Persistent driver turnover keeps capacity tight and lifts spot tender rejection rates, pushing more loads toward brokers with agile matching engines. Mid-sized shippers increasingly depend on intermediaries to secure trucks when contract carriers reject tenders. Digital load boards capture rising volume because automated postings reduce the time needed to cover urgent freight. Driver scarcity is most acute for long-haul refrigerated lanes, intensifying broker leverage in that sub-market. Carriers are demanding higher rates to offset retention bonuses, and savvy brokers bundle back-haul opportunities to keep trucks moving. Tight capacity, therefore, sustains brokerage relevance even as asset-based fleets expand direct sales.
Heightened E-Commerce Parcel Volumes
Rapid-fire online ordering pivots shipment profiles toward smaller, more frequent loads that favor Less-than-Truckload capacity. General rate increases of 4.9%-7.9% across major LTL carriers in 2025 signal constrained pallet space and bolster broker margins when they secure capacity in advance. Density-based freight re-classification slated for July 2025 will lift costs on lightweight e-commerce parcels, reinforcing the need for brokerage expertise in class assignment. Digital LTL portals offering dynamic quoting stand to gain market share as shippers seek rapid cost visibility. Brokers capable of pre-consolidating parcel freight into LTL moves can capture incremental value by reducing per-unit shipping costs. The United States freight brokerage market thus benefits from the structural e-commerce shift toward middle- and final-mile optimization.
Volatile Diesel Prices
Average U.S. diesel swung between USD 3.43 and USD 4.58 per gallon in 2024, outpacing fuel-surcharge recalibration and compressing broker spot margins. Large brokers deploy hedging models that ingest Energy Information Administration data to anticipate surcharges, but smaller players often misprice loads, eroding net revenue. Refrigerated lanes are hit hard because reefer units consume extra fuel. Some brokers now publish "all-in" offers with real-time fuel clauses to shield margins while maintaining price transparency. Fluctuation uncertainty discourages shippers from locking year-long rates, nudging them to transactional spot brokerage.
Other drivers and restraints analyzed in the detailed report include:
- Shipper Demand for Managed Transportation
- ELD Mandate Compliance Requirements
- Port Congestion and Chassis Shortages
For complete list of drivers and restraints, kindly check the Table Of Contents.
Segment Analysis
The United States freight brokerage market size for service lines continues to skew toward FTL, which generated 63.75% of revenue in 2024, yet the LTL corridor is on track for a 9.0% CAGR through 2030. Digital platforms that quote pallet-level rates within seconds are winning volume from manual call-and-fax workflows. The density-based re-classification in July 2025 will reward brokers able to re-engineer packaging dimensions so that shippers avoid higher classes for light bulky products.
FTL still commands the bulk of long-haul industrial freight, but driver scarcity and equipment constraints are nudging shippers to multistop LTL consolidations. Parcel-to-LTL consolidation hubs reduce last-mile congestion and cut per-unit cost, giving brokers new margins on value-added cross-dock services. Specialized brokers also exploit "partial truckload" offerings to bridge the gap between LTL and FTL. Consequently, multi-service capability is now a benchmark for winning diversified RFPs across the United States freight brokerage market.
Dry vans produced 44.65% of revenue in 2024, but refrigerated units are advancing at 10.1% CAGR, lifting the equipment segment's United States freight brokerage market size over the forecast horizon. Food-grade and pharmaceutical shippers require temperature verification and electronic seals, favoring brokers with telematics-equipped carrier pools.
Rising specialty produce exports out of the West Coast elevate back-haul demand for reefers into the Midwest and East. Brokers bundle harmonized temperature monitoring and detention mitigation into premium pricing. Flatbed and step-deck equipment remains cyclical, spiking during spring construction, while tanker brokerage stays niche due to hazmat compliance burdens. Equipment flexibility, therefore, became central to winning multi-modal contracts in 2025.
The US Freight Brokerage Market Report is Segmented by Service (FTL and More), by Equipment / Trailer Type (Dry Van and More), by Haul Length (Long-Haul and More), by Business Model (Traditional Freight Brokerage and More), by End User (Manufacturing and More), by Customer Size (Large Enterprise and More), and by Geography (Northeast and More). The Report Offers Market Size and Forecasts in Value (USD) for all the Above Segments.
List of Companies Covered in this Report:
- C.H. Robinson Worldwide Inc.
- Total Quality Logistics (TQL)
- XPO Logistics Inc.
- Echo Global Logistics
- Worldwide Express
- Coyote Logistics (UPS)
- Landstar System Inc.
- Schneider FreightPlus
- GlobalTranz (WWEX)
- J.B. Hunt 3600
- Hub Group
- Uber Freight
- BNSF Logistics
- SunteckTTS
- Arrive Logistics
- Nolan Transportation Group
- Mode Global
- Convoy Inc.
- Red Technologies
- ArcBest Corporation
- Allen Lund Company
- Redwood Logistics
- BlueGrace Logistics
- Trinity Logistics
Additional Benefits:
- The market estimate (ME) sheet in Excel format
- 3 months of analyst support
TABLE OF CONTENTS
1 Introduction
- 1.1 Study Assumptions & Market Definition
- 1.2 Scope of the Study
2 Research Methodology
3 Executive Summary
4 Market Landscape
- 4.1 Market Overview
- 4.2 Market Drivers
- 4.2.1 Tight Domestic Truckload Capacity & Driver Shortage Boosting Spot Brokerage Activity
- 4.2.2 Heightened E-Commerce Parcel Volumes Driving LTL Brokerage Penetration
- 4.2.3 Shipper Demand for Managed Transportation & 4PL Solutions
- 4.2.4 Electronic Logging Device (ELD) Mandate Increasing Reliance on Brokers for Compliance-Ready Carriers
- 4.2.5 Venture-Capital Funding Accelerating Digital Freight-Matching Platforms
- 4.2.6 Infrastructure Investment & Jobs Act (IIJA) Re-energising Construction-Related Freight Flows
- 4.3 Market Restraints
- 4.3.1 Volatile Diesel Prices Compressing Spot Margin for Brokers
- 4.3.2 Port Congestion & Chassis Shortages Disrupting Drayage Reliability
- 4.3.3 Asset-Based Carriers Expanding Direct-to-Shipper Brokerage (Margin Squeeze)
- 4.3.4 Increasing Federal Scrutiny on Broker Bond Requirements & Fraud Cases
- 4.4 Value / Supply-Chain Analysis
- 4.5 Key Government Regulations & Initiatives (HOS, AB5, Speed-Limiter NPRM)
- 4.6 Technology Snapshot (Digital Freight Brokerage, IoT, AI, Visibility APIs)
- 4.7 Porter's Five Forces
- 4.7.1 Bargaining Power of Suppliers
- 4.7.2 Bargaining Power of Buyers
- 4.7.3 Threat of New Entrants
- 4.7.4 Threat of Substitutes
- 4.7.5 Competitive Rivalry
- 4.8 US Logistics Industry Overview
- 4.9 Insights on Spot vs. Contract Truck Rates
- 4.10 Impact of Geopolitical Events on the Market
5 Market Size & Growth Forecasts (Value)
- 5.1 By Service
- 5.1.1 Full-Truckload (FTL)
- 5.1.2 Less-than-Truckload (LTL)
- 5.1.3 Others
- 5.2 By Equipment / Trailer Type
- 5.2.1 Dry Van
- 5.2.2 Refrigerated Van
- 5.2.3 Flatbed / Step-Deck
- 5.2.4 Tanker (Bulk Liquid & Chemical)
- 5.2.5 Others
- 5.3 By Haul Length
- 5.3.1 Long-Haul (More than 500 miles)
- 5.3.2 Regional (100-500 miles)
- 5.3.3 Local (Less than 100 miles)
- 5.4 By Business Model
- 5.4.1 Traditional Freight Brokerage
- 5.4.2 Asset-Based Freight Brokerage
- 5.4.3 Agent Model Freight Brokerage
- 5.4.4 Digital Freight Brokerage
- 5.5 By End-User Industry
- 5.5.1 Manufacturing & Automotive
- 5.5.2 Construction & Infrastructure Projects
- 5.5.3 Oil, Gas, Mining & Chemicals
- 5.5.4 Agriculture & Food / Beverage
- 5.5.5 Retail, FMCG & Wholesale Distribution
- 5.5.6 Healthcare & Pharmaceuticals
- 5.5.7 E-commerce & 3PL Fulfilment
- 5.5.8 Other End-User Industry
- 5.6 By Customer Size
- 5.6.1 Large Enterprise Shippers (More than $100 M Freight Spend)
- 5.6.2 Mid-Market Shippers ($10-100 M)
- 5.6.3 Small Businesses (Less than $10 M)
- 5.7 By Geography
- 5.7.1 Northeast
- 5.7.2 Midwest
- 5.7.3 Southeast
- 5.7.4 Southwest
- 5.7.5 West
6 Competitive Landscape
- 6.1 Market Concentration
- 6.2 Strategic Moves (M&A, Funding, Partnerships)
- 6.3 Market Share Analysis
- 6.4 Company Profiles (includes Global-level Overview, Market-level Overview, Core Segments, Financials, Strategic Information, Market Rank/Share, Products & Services, and Recent Developments)
- 6.4.1 C.H. Robinson Worldwide Inc.
- 6.4.2 Total Quality Logistics (TQL)
- 6.4.3 XPO Logistics Inc.
- 6.4.4 Echo Global Logistics
- 6.4.5 Worldwide Express
- 6.4.6 Coyote Logistics (UPS)
- 6.4.7 Landstar System Inc.
- 6.4.8 Schneider FreightPlus
- 6.4.9 GlobalTranz (WWEX)
- 6.4.10 J.B. Hunt 3600
- 6.4.11 Hub Group
- 6.4.12 Uber Freight
- 6.4.13 BNSF Logistics
- 6.4.14 SunteckTTS
- 6.4.15 Arrive Logistics
- 6.4.16 Nolan Transportation Group
- 6.4.17 Mode Global
- 6.4.18 Convoy Inc.
- 6.4.19 Red Technologies
- 6.4.20 ArcBest Corporation
- 6.4.21 Allen Lund Company
- 6.4.22 Redwood Logistics
- 6.4.23 BlueGrace Logistics
- 6.4.24 Trinity Logistics
7 Market Opportunities & Future Outlook
- 7.1 White-Space & Unmet-Need Assessment
 货运代理服务市场:依服务类型、运输方式、客户规模、货物类型、技术应用及最终用户产业划分-2026-2032年全球市场预测
 美国整车货运经纪市场:市场占有率分析、产业趋势与统计、成长预测(2026-2031 年)
 全球货运仲介市场规模、份额、趋势和成长分析报告(2026-2034)
 2026-2030年全球货运仲介市场
 2026-2030年全球数位货运经纪市场
 数位货运经纪市场机会、成长驱动因素、产业趋势分析及预测(2026-2035年)
 2032 年数位货运经纪市场预测:按平台类型、运输方式、服务类型、部署模式、最终用户和地区进行的全球分析
 2025年数位货运经纪全球市场报告全球数位货运经纪市场-以运输方式、垂直产业、区域范围、预测分類的市场规模
 全球数位货运经纪市场规模、份额、趋势分析报告(依客户类型、运输方式、服务类型、最终用户产业、地区、展望与预测,2025 年至 2032 年)