


 |
市场调查报告书
商品编码
1851221
英国可再生能源:市场份额分析、行业趋势、统计数据和成长预测(2025-2030 年)United Kingdom Renewable Energy - Market Share Analysis, Industry Trends & Statistics, Growth Forecasts (2025 - 2030) |
||||||
※ 本网页内容可能与最新版本有所差异。详细情况请与我们联繫。
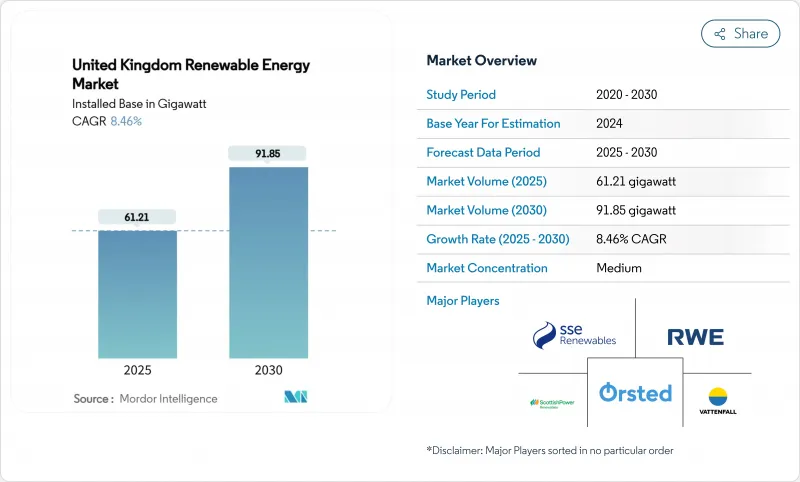
英国可再生能源装置容量预计将从 2025 年的 61.21 吉瓦成长到 2030 年的 91.85 吉瓦,预测期(2025-2030 年)复合年增长率为 8.46%。
快速部署符合《2030年清洁电力行动计画》,该计画旨在加强能源安全目标,同时减少石化燃料进口,并争取实现95%的清洁电力生产。到2024年,可再生能源将占全国电力供应的46.4%,首次超过天然气,凸显了对低碳电力的结构性需求。推动因素包括离岸风力发电的主导、光伏发电资本投资的下降以及透过差价合约(CfD)机制实现的长期收益保障。政策的明朗化、企业购电协议的签署以及加强输电网络的承诺提高了计划的融资可行性,投资意愿仍然强劲。
英国可再生能源市场趋势与洞察
北海管线建设加速,离岸风电差价合约执行价格重置
在前一次零竞标之后,政府在第六轮分配中提高了成交价,恢復了商业性可行性,并签订了 5.3 吉瓦的新产能合同,其中包括 Hornsea 3 和 4 号项目。每年 6-8 吉瓦的可预测竞标有助于扩大供应链规模,并将北海开发平臺提升至 37 吉瓦以上,从而支持到 2030 年实现 50 吉瓦的目标。
差价合约计画可提供确定的利润
自启动以来,双边差价合约机制目前已支持该国超过40%的可再生能源发电,并调动了超过1000亿英镑的私人资本。该机制扩展至潮汐能和浮动式风力发电,拓宽了其适用范围,并持续降低大型计划的加权平均资本成本。
国家电网连接排队导致五年连线延迟
连接队列已膨胀至 739 吉瓦,多个计划的截止日期定于 2035 年。英国天然气和电力市场管理局 (Ofgem) 的 TMO4+「先准备就绪,先连接」改革和耗资 310 亿英镑的「大电网升级」计画旨在释放 500 吉瓦的容量,但真正的缓解可能只有在短期加固措施(例如耗资 43 亿英镑的东部绿色连接 2 号电缆)实施后才能实现。
细分市场分析
到2024年,风能将占英国发电量的53%,这主要得益于高容量係数的离岸风电场,例如3.6兆瓦的道格滩(Dogger Bank)风电场。同时,太阳能光电发电在2025年至2030年间将以11.2%的复合年增长率(CAGR)成为成长最快的能源。先进的15兆瓦风力涡轮机以及固定式和浮体式基础将进一步巩固风能的主导地位,而从2025年起实施的简化规划和强制性屋顶光伏部署将有助于太阳能发电迎头赶上。水力发电和生质能源能将继续做出稳健贡献,其中生质能源的普及需要等到2030年后才能实现捕碳封存的商业性。对潮汐能和波浪能技术的创新融资正在推动英国可再生能源市场实现多元化的长期成长。
太阳能光电发电和经济实惠的屋顶光伏系统的激增将推动住宅和商业用户的采用,而潮汐能示范项目和浮动式风力发电原型项目将开闢新的能源领域。这些转变将使英国可再生能源市场继续平衡其发电贡献,不再仅以风能主导。
英国可再生能源市场报告按发电来源(风能、太阳能、水力、生质能源及其他)、装置容量(超过10兆瓦、超过100千瓦但小于10兆瓦、小于100千瓦)和终端用户产业(公共产业、商业/工业、住宅)进行细分。市场规模和预测以装置容量(吉瓦)为单位。
其他福利:
- Excel格式的市场预测(ME)表
- 3个月的分析师支持
目录
第一章 引言
- 研究假设和市场定义
- 调查范围
第二章调查方法
第三章执行摘要
第四章 市场情势
- 市场概览
- 市场驱动因素
- 离岸风电差价合约执行价格下跌加速北海管线建设
- 差价合约(CfD)系统提供收入确定性
- 英国资料中心与重工业购电方的企业购电协定(PPA)兴起
- Ofgem的RIIO-ED2电网升级承诺将促进分散式太阳能发电
- 绿色氢能战略将电解槽建设与可再生能源连结起来
- 降低苏格兰深水区浮体式海上风力涡轮机的成本。
- 市场限制
- 国家电网排队瓶颈导致五年连线延迟
- 智慧出口保障:关税削减衝击屋顶太阳能投资报酬率
- 英国脱欧后,离岸风力发电单桩基础的成本上升。
- 视觉影响问题阻碍了陆上风电授权
- 供应链分析
- 监理展望
- 技术展望
- 波特五力模型
- 新进入者的威胁
- 供应商的议价能力
- 买方的议价能力
- 替代品的威胁
- 产业间竞争
- PESTEL 分析
第五章 市场规模与成长预测
- 按能源来源
- 风力发电(陆域风力发电、离岸风力发电、浮体式海上风力发电)
- 太阳能发电(公共产业太阳能发电、商业/工业屋顶太阳能发电、住宅屋顶太阳能发电)
- 水力发电(小型、大型、抽水蓄能)
- 生质能源(生质能、沼气)
- 其他(地热、潮汐、波浪)
- 按安装规模
- 超过10兆瓦
- 100 kW~10 MW
- 小于100千瓦
- 按最终用户部门
- 公共产业
- 商业和工业
- 住房
第六章 竞争情势
- 市场集中度
- 策略性倡议(併购、伙伴关係、购电协议)
- 市场占有率分析(主要企业的市场排名/份额)
- 公司简介
- SSE Renewables
- Orsted A/S
- ScottishPower Renewables(Iberdrola SA)
- RWE Renewables GmbH
- Vattenfall AB
- EDF Energy
- Statkraft AS
- RES Group Ltd.
- Brookfield Renewable Partners
- Greencoat UK Wind PLC
- Bluefield Solar Income Fund
- Octopus Renewables Infrastructure Trust
- NextEnergy Solar Fund
- Equinor ASA
- TotalEnergies SE
- Siemens Gamesa Renewable Energy SA
- Vestas Wind Systems A/S
- GE Vernova
- Lightsource BP
- Drax Group PLC
第七章 市场机会与未来展望
The United Kingdom Renewable Energy Market size in terms of installed base is expected to grow from 61.21 gigawatt in 2025 to 91.85 gigawatt by 2030, at a CAGR of 8.46% during the forecast period (2025-2030).
Rapid deployment aligns with the Clean Power 2030 Action Plan that targets 95% clean electricity generation, reinforcing energy-security ambitions while cutting fossil-fuel imports . Renewables supplied 46.4% of national electricity in 2024, overtaking gas for the first time and underscoring structural demand for low-carbon power. Drivers include offshore wind leadership, falling solar PV capex, and long-dated revenue certainty from the Contracts-for-Difference (CfD) scheme. Investment appetite remains strong as policy clarity, corporate power-purchase agreements, and grid-upgrade commitments improve project bankability.
United Kingdom Renewable Energy Market Trends and Insights
Offshore-wind CfD strike-price resets accelerating the North Sea pipeline
After the previous zero-bid outcome, the government raised strike prices in Allocation Round 6, restoring commercial viability and contracting 5.3 GW of new capacity, including Hornsea 3 and 4. Predictable annual auctions of 6-8 GW underpin supply-chain scaling and have lifted the North Sea development pipeline above 37 GW, supporting the 50 GW by 2030 target .
Contracts-for-Difference scheme providing revenue certainty
Since its inception, the two-way CfD mechanism now backs over 40% of national renewable generation and has mobilized over GBP 100 billion of private capital. Expanding eligibility to tidal streams and floating wind broadens technology coverage and continues to lower the weighted cost of capital for large projects.
National Grid queue bottlenecks causing five-year connection delays
The connection queue has ballooned to 739 GW, with some projects assigned 2035 dates. Ofgem's TMO4+ "first ready, first connected" reforms and the GBP 31 billion Great Grid Upgrade aim to free 500 GW of capacity, yet material relief will appear only after near-term reinforcements such as the GBP 4.3 billion Eastern Green Link 2 cable.
Other drivers and restraints analyzed in the detailed report include:
- Rise of corporate PPAs from UK data-centre and industrial off-takers
- Ofgem RIIO-ED2 grid-upgrade commitments boosting distributed solar
- Reduced Smart-Export-Guarantee tariff hitting rooftop solar ROI
For complete list of drivers and restraints, kindly check the Table Of Contents.
Segment Analysis
Wind contributed 53% of 2024 generation, anchored by high-capacity-factor offshore sites such as the 3.6 GW Dogger Bank complex, while solar posts the fastest 2025-2030 CAGR at 11.2% . Advanced 15 MW turbines and fixed-plus-floating foundations extend wind's edge, but streamlined planning and mandated rooftop deployment from 2025 propel solar's catch-up. Hydro and bioenergy remain steady contributors; the latter awaits commercial bioenergy with carbon capture and storage after 2030. Innovation funding for tidal stream and wave technologies positions the UK renewable energy market for diversified long-term growth.
The solar surge and cost-effective rooftop systems encourage residential and corporate uptake, while tidal stream demonstrators and floating wind prototypes open new resource areas. These shifts ensure the UK renewable energy market continues to rebalance source contributions beyond the current wind-led profile.
The United Kingdom Renewable Energy Market Report is Segmented by Source (Wind, Solar, Hydro, Bioenergy, and Other), Installation Scale (Above 10 MW, 100 KW To 10 MW, and Below 100 KW), and End-User Sector (Utilities, Commercial and Industrial, and Residential). The Market Sizes and Forecasts are Provided in Terms of Installed Capacity (GW).
List of Companies Covered in this Report:
- SSE Renewables
- Orsted A/S
- ScottishPower Renewables (Iberdrola SA)
- RWE Renewables GmbH
- Vattenfall AB
- EDF Energy
- Statkraft AS
- RES Group Ltd.
- Brookfield Renewable Partners
- Greencoat UK Wind PLC
- Bluefield Solar Income Fund
- Octopus Renewables Infrastructure Trust
- NextEnergy Solar Fund
- Equinor ASA
- TotalEnergies SE
- Siemens Gamesa Renewable Energy SA
- Vestas Wind Systems A/S
- GE Vernova
- Lightsource BP
- Drax Group PLC
Additional Benefits:
- The market estimate (ME) sheet in Excel format
- 3 months of analyst support
TABLE OF CONTENTS
1 Introduction
- 1.1 Study Assumptions & Market Definition
- 1.2 Scope of the Study
2 Research Methodology
3 Executive Summary
4 Market Landscape
- 4.1 Market Overview
- 4.2 Market Drivers
- 4.2.1 Offshore-wind CfD Strike-Price Declines Accelerating North-Sea Pipeline
- 4.2.2 Contracts-for-Difference (CfD) Scheme Providing Revenue Certainty
- 4.2.3 Rise of Corporate PPAs from UK Data-Centre & Heavy-Industry Off-takers
- 4.2.4 Ofgem RIIO-ED2 Grid-Upgrade Commitments Boosting Distributed Solar
- 4.2.5 Green-Hydrogen Strategy Linking Electrolyser Build-out to Renewables
- 4.2.6 Cost Drop in Floating Offshore Turbines for Deep-water Scottish Sites
- 4.3 Market Restraints
- 4.3.1 National-Grid Queue Bottlenecks Causing 5-year Connection Delays
- 4.3.2 Reduced Smart-Export-Guarantee Tariff Hitting Rooftop Solar ROI
- 4.3.3 Offshore-Wind Monopile Cost Inflation Post-Brexit Steel Tariffs
- 4.3.4 Visual-Impact Objections Stalling Onshore Wind Permitting
- 4.4 Supply-Chain Analysis
- 4.5 Regulatory Outlook
- 4.6 Technological Outlook
- 4.7 Porter's Five Forces
- 4.7.1 Threat of New Entrants
- 4.7.2 Bargaining Power of Suppliers
- 4.7.3 Bargaining Power of Buyers
- 4.7.4 Threat of Substitutes
- 4.7.5 Industry Rivalry
- 4.8 PESTLE Analysis
5 Market Size & Growth Forecasts
- 5.1 By Source
- 5.1.1 Wind (Onshore Wind, Offshore Wind, and Floating Offshore Wind)
- 5.1.2 Solar (Utility-scale PV, Commercial and Industrial Rooftop PV, and Residential Rooftop PV)
- 5.1.3 Hydro (Small, Large, Pumped Storage)
- 5.1.4 Bioenergy (Biomass, Biogas)
- 5.1.5 Other (Geothermal, Tidal-Stream, Wave)
- 5.2 By Installation Scale
- 5.2.1 Above 10 MW
- 5.2.2 100 kW to 10 MW
- 5.2.3 Below 100 kW
- 5.3 By End-User Sector
- 5.3.1 Utilities
- 5.3.2 Commercial and Industrial
- 5.3.3 Residential
6 Competitive Landscape
- 6.1 Market Concentration
- 6.2 Strategic Moves (M&A, Partnerships, PPAs)
- 6.3 Market Share Analysis (Market Rank/Share for key companies)
- 6.4 Company Profiles (includes Global level Overview, Market level overview, Core Segments, Financials as available, Strategic Information, Products & Services, and Recent Developments)
- 6.4.1 SSE Renewables
- 6.4.2 Orsted A/S
- 6.4.3 ScottishPower Renewables (Iberdrola SA)
- 6.4.4 RWE Renewables GmbH
- 6.4.5 Vattenfall AB
- 6.4.6 EDF Energy
- 6.4.7 Statkraft AS
- 6.4.8 RES Group Ltd.
- 6.4.9 Brookfield Renewable Partners
- 6.4.10 Greencoat UK Wind PLC
- 6.4.11 Bluefield Solar Income Fund
- 6.4.12 Octopus Renewables Infrastructure Trust
- 6.4.13 NextEnergy Solar Fund
- 6.4.14 Equinor ASA
- 6.4.15 TotalEnergies SE
- 6.4.16 Siemens Gamesa Renewable Energy SA
- 6.4.17 Vestas Wind Systems A/S
- 6.4.18 GE Vernova
- 6.4.19 Lightsource BP
- 6.4.20 Drax Group PLC
7 Market Opportunities & Future Outlook
- 7.1 White-space & Unmet-Need Assessment
- 7.2 10 GW Floating-Wind Pipeline Beyond 2030 Target
 风电场变电站市场按组件类型、配置类型、连接类型、电压等级、最终用户和安装类型划分,全球预测(2026-2032年)
 全球节能设备市场:机会与策略展望(至2034年)
 节能微控制器市场分析及预测(至2035年):依类型、产品类型、服务、技术、组件、应用、最终用户、功能、安装类型、解决方案划分
 中国可再生能源:市场占有率分析、产业趋势与统计、成长预测(2026-2031年)新加坡可再生能源:市场占有率分析、产业趋势与统计、成长预测(2026-2031)美国可再生能源:市场份额分析、行业趋势和统计数据以及成长预测(2026-2031 年)
 全球太阳能上吸式塔市场规模、份额、趋势和成长分析报告(2026-2034年)
 日本节能变压器市场规模、份额、趋势及预测(按类型、冷却方式、效率等级、应用和地区划分,2026-2034年)2026年全球节能设备市场报告2026年全球可再生能源投资市场报告