


 |
市场调查报告书
商品编码
1906260
欧洲废弃物管理市场:市场占有率分析、产业趋势与统计、成长预测(2026-2031 年)Europe Waste Management - Market Share Analysis, Industry Trends & Statistics, Growth Forecasts (2026 - 2031) |
||||||
※ 本网页内容可能与最新版本有所差异。详细情况请与我们联繫。
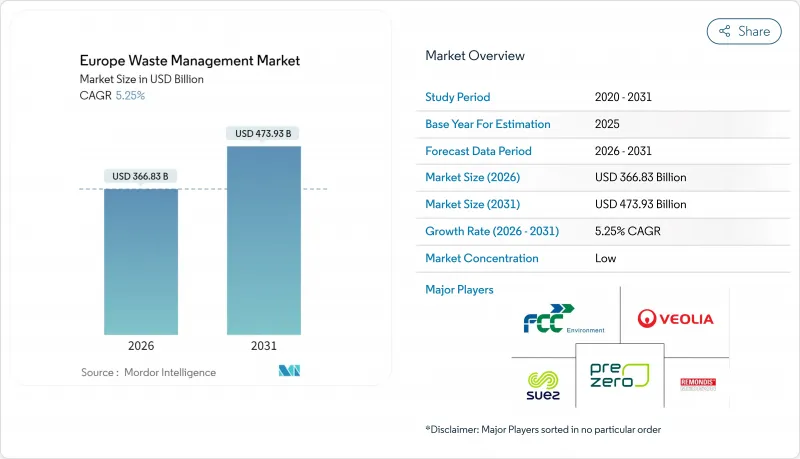
欧洲废弃物管理市场规模预计到 2026 年将达到 3,668.3 亿美元,高于 2025 年的 3,485.4 亿美元,预计到 2031 年将达到 4739.3 亿美元,2026 年至 2031 年的复合年增长率为 5.25%。
这一强劲的成长轨迹凸显了欧洲废弃物管理市场如何受益于严格的掩埋减量指令、对废弃物发电 (WtE) 资产的快速成长的投资以及向循环经济原则的明显转变。监管压力,特别是欧盟要求在 2035 年将城市垃圾掩埋限制在 10% 以内,正在加速资本流入回收、化学回收和人工智慧赋能的收集系统,同时也推动了对先进处理技术需求的显着转变。德国凭藉其成熟的生产者延伸责任制 (EPR) 和强大的垃圾发电网络,仍然是领先的市场;而西班牙正在崛起成为成长引擎,透过大型化学回收厂和智慧垃圾桶试点计画创造了新的产能。在整个价值链上,领先的营运商正在收购互补资产以建立完全一体化的服务,而以数据为中心的Start-Ups公司正在透过分析来减少卡车行驶里程、碳排放和营运成本,从而实现盈利。
欧洲废弃物管理市场趋势与洞察
欧盟10%的掩埋限值推动基础建设转型
10%的掩埋上限正在重塑欧洲废弃物市政预算和规划时间表。德国已将掩埋量降至接近零,而西班牙和义大利正在快速建造垃圾发电生产线和高容量分拣设施(物料回收设施),以期在2035年之前实现目标。不遵守规定的处罚,加上欧盟资金有限,迫使即使是行动落后的国家也开始将剩余废弃物转化为能源回收和高阶回收。像苏伊士集团这样的营运商已在图卢兹启动了一个区域供热垃圾发电计划,每年可从废弃物中转化360吉瓦时的热量,这表明遵守监管规定能够带来新的公共产业收入。随着成本最低的处置方案逐渐消失,所有相关人员都在优化高附加价值处理途径,以加强循环经济。
电子商务包装废弃物的快速成长催生了对专业处理的需求。
网路购物的激增催生了复杂的多层包装,这些包装难以以传统的回收方式进行处理。英国将于2025年3月生效的新规要求将食物废弃物和干燥可回收物分开,这将推动逆向物流合作关係和专用处理生产线的建立。化学回收工厂,例如莱昂内尔巴塞尔投资4,400万美元的韦瑟林工厂,专门处理传统系统无法处理的复合薄膜。掌握这一细分领域的业者可以收取高额的入场费,从而为欧洲废弃物管理市场创造新的收入来源。
废弃物发电基础设施在资金筹集和社会接受度方面面临许多障碍。
一座典型的废弃物焚化发电厂建设成本在2.2亿美元至4.4亿美元之间,审批流程可能需要七年时间,使得专案发起人面临政策变化和利率上升的风险。儘管排放气体控制技术已得到验证,但由于当地居民的反对,尤其是在人口稠密的地区,审批流程仍被延误。环保人士呼吁推行「零焚烧」政策,迫使开发商投资即时排放气体监测系统和二氧化碳捕集设备,这降低了计划的经济效益,并抑制了新计画的建设。
细分市场分析
到2025年,住宅废弃物将主导欧洲废弃物管理市场,占55.02%的市场。这表明,可预测的住宅废弃物产生模式是垃圾收集路线、收费系统和市政预算的基础。柏林和哥本哈根引入智慧垃圾桶后,优化了垃圾收集频率,减少了车辆行驶里程,从而抑制了成本上涨。虽然生活垃圾仍然是垃圾处理的主要来源,但商业废弃物正成为关键的成长要素,预计到2031年将以7.18%的复合年增长率成长。这一成长主要受电子商务包装和灵活办公空间普及的推动,这些因素会产生轻便但体积较大的废弃物,需要专门的打包技术和逆向物流。
商业废弃物的增加将纸板、多层薄膜和废弃IT设备等新型材料带入欧洲废弃物管理市场,这些都需要分类和高级处理。目前,马德里和米兰附近的物流中心正在试验使用机器人技术对纸板和塑胶进行预分拣,而巴黎的办公大楼则安装了全方位感测器,以实现即时收集。虽然工业废弃物仍然是一个稳定的来源,但其成长正受到製程效率提高和就近处理方式的限制。同时,随着人口老化,医疗废弃物的数量也相应增加,这为热消毒和高压釜服务等细分行业提供了支持。
其他福利:
- Excel格式的市场预测(ME)表
- 3个月的分析师支持
目录
第一章 引言
- 研究假设和市场定义
- 调查范围
第二章调查方法
第三章执行摘要
第四章 市场情势
- 市场概览
- 市场驱动因素
- 欧盟掩埋减量义务(2035 年)10%
- 扩大欧盟27国的生产者延伸责任制(EPR)
- 人工智慧/物联网智慧垃圾桶的普及率迅速提高
- 电子商务包装废弃物迅速增加
- 化学品回收计划填补了不可回收材料的缺口
- 水泥共加工中对废弃物衍生燃料(RDF)的需求
- 市场限制
- 废弃物焚化发电厂的资本支出和社会接受度障碍
- 塑胶回收再利用能力停滞不前
- 利用人工智慧解决废弃物处理作业中人力资源短缺问题
- 地方政府「零焚烧」运动限制了垃圾焚化发电管道的建设。
- 价值/供应链分析
- 监管环境
- 技术展望
- 产业吸引力-波特五力分析
- 新进入者的威胁
- 供应商的议价能力
- 买方的议价能力
- 替代品的威胁
- 竞争对手之间的竞争
第五章 市场规模及成长预测(价值,单位:十亿美元)
- 按来源
- 住宅
- 商业设施(零售商店、办公室等)
- 产业
- 医疗(健康和医药)
- 建筑和拆除废弃物
- 其他(引擎废弃物、农业废弃物等)
- 按服务类型
- 收集、运输、分类和分离
- 处理/处置
- 掩埋处置
- 回收和资源回收
- 焚烧和废弃物发电
- 其他(化学处理、堆肥等)
- 其他(咨询、审核、训练等)
- 依废物类型
- 都市固态废弃物
- 工业用危险废弃物
- 电子废弃物
- 塑胶废弃物
- 医疗废弃物
- 建筑和拆除废弃物
- 农业废弃物
- 其他特殊废弃物(放射性废弃物等)
- 按地区
- 英国
- 德国
- 法国
- 义大利
- 西班牙
- 比荷卢经济联盟(比利时、荷兰、卢森堡)
- 北欧国家(丹麦、芬兰、冰岛、挪威、瑞典)
- 其他欧洲地区
第六章 竞争情势
- 市场集中度
- 策略趋势
- 市占率分析
- 公司简介
- Veolia
- Suez
- Remondis
- FCC Environment
- PreZero
- Urbaser
- Renewi
- Biffa PLC
- Viridor
- ALBA Group
- Stena Recycling
- Cleanaway Germany
- AVR
- IAG-Ihlenberger
- Covanta Europe
- DS Smith Recycling
- Macquarie Asset Management
- Augean
- Energy Capital Partners
- Paprec Group
第七章 市场机会与未来展望
European Waste Management Market size in 2026 is estimated at USD 366.83 billion, growing from 2025 value of USD 348.54 billion with 2031 projections showing USD 473.93 billion, growing at 5.25% CAGR over 2026-2031.
This solid growth path underscores how the European waste management market is benefiting from strict landfill-reduction mandates, fast-rising investment in waste-to-energy (WtE) assets, and an unmistakable shift toward circular economy principles. Regulatory pressure, most notably the European Union's requirement to cap municipal landfilling at 10% by 2035, is accelerating capital inflows into recycling, chemical recovery, and AI-enabled collection systems, while creating a step-change in demand for advanced treatment technologies. Germany remains the anchor market, leveraging mature Extended Producer Responsibility (EPR) systems and robust WtE networks, yet Spain is now the headline growth story as large-scale chemical recycling plants and smart-bin pilots unlock new capacity. Across the value chain, leading operators are acquiring complementary assets to build fully integrated service offerings, and data-centric start-ups are monetizing analytics that cut truck mileage, carbon emissions, and operating costs.
Europe Waste Management Market Trends and Insights
EU Landfill-to-10% Mandate Drives Infrastructure Transformation
The 10% cap on landfilling is rewriting municipal budgets and planning calendars across the European waste management market. Germany already operates near-zero landfill levels, yet Spain and Italy are quickly adding WtE lines and high-throughput MRFs to stay on track for 2035 compliance. Penalties for non-compliance, coupled with restricted EU funding, are pushing even slower adopters to redirect residual waste toward energy recovery or advanced recycling. Operators such as SUEZ have responded with district-heating WtE projects that convert waste into 360 GWh of heat annually for Toulouse, demonstrating how compliance can unlock new utility revenue. As the lowest-cost disposal option disappears, every stakeholder now optimizes around higher-value treatment pathways that strengthen the circular economy.
E-commerce Packaging Waste Surge Creates Specialized Processing Demand
A spike in online shopping yields complex, multi-layer packages that frustrate conventional recycling. New UK rules starting March 2025 obligate firms to separate food waste and dry recyclables, forcing reverse-logistics partnerships and dedicated processing lines. Chemical recycling plants, such as LyondellBasell's USD 44 million Wesseling unit, target composite films that traditional systems reject. Operators who master this niche command premium gate fees, giving the European waste management market fresh revenue streams.
Waste-to-Energy Infrastructure Faces Capital and Social Acceptance Barriers
Typical WtE units cost USD 220-440 million, and permitting can stretch seven years, exposing sponsors to policy shifts and rising interest rates. Community push-back, especially in densely populated corridors, slows approvals despite proven emission controls. Activist pressure for "zero-incineration" policies has forced developers to invest in real-time emissions dashboards and carbon-capture add-ons, elevating project economics and capping capacity additions.
Other drivers and restraints analyzed in the detailed report include:
- Extended Producer Responsibility Scaling Accelerates Packaging Circularity
- AI and IoT Smart-Bin Deployments Optimize Collection Efficiency
- Plastic Recycling Capacity Stagnation Limits Circular Economy Progress
For complete list of drivers and restraints, kindly check the Table Of Contents.
Segment Analysis
Residential sources held a commanding 55.02% share of the European waste management market in 2025, underscoring how predictable household generation patterns underpin collection routes, fee structures, and municipal budgets. Smart-bin rollouts in Berlin and Copenhagen are optimizing collection frequency and cutting truck miles, keeping cost escalation in check. Although households remain the volume anchor, commercial sources are emerging as the primary growth lever with a forecast 7.18% CAGR through 2031. The surge is rooted in e-commerce packaging and the mushrooming of flexible workspaces that generate light but bulky streams requiring specialized baling and reverse logistics.
Commercial waste expansion injects new materials corrugated board, multi-layer films, and discarded IT equipment, into the European waste management market, demanding tailored segregation and advanced treatment. Logistics hubs near Madrid and Milan are piloting robotics that pre-sort cardboard and plastic, while office towers in Paris are embedding fill-level sensors to trigger just-in-time pickups. Industrial waste remains a steady contributor, yet its growth is tempered by process efficiency gains and near-sourcing, whereas healthcare waste scales in line with aging populations, supporting niche operators in thermal disinfection and autoclave services.
The European Waste Management Market Report is Segmented by Source (Residential, Commercial, Industrial, and More), by Service Type (Collection, Transportation, Sorting & Segregation, and More), by Waste Type (Municipal Solid, Industrial Hazardous, E-Waste, Plastic, and More), and by Geography (UK, Germany, France, Italy, Spain, BENELUX, NORDICS, and the Rest of Europe). The Market Forecasts are Provided in Terms of Value (USD).
List of Companies Covered in this Report:
- Veolia
- Suez
- Remondis
- FCC Environment
- PreZero
- Urbaser
- Renewi
- Biffa PLC
- Viridor
- ALBA Group
- Stena Recycling
- Cleanaway Germany
- AVR
- IAG-Ihlenberger
- Covanta Europe
- DS Smith Recycling
- Macquarie Asset Management
- Augean
- Energy Capital Partners
- Paprec Group
Additional Benefits:
- The market estimate (ME) sheet in Excel format
- 3 months of analyst support
TABLE OF CONTENTS
1 Introduction
- 1.1 Study Assumptions & Market Definition
- 1.2 Scope of the Study
2 Research Methodology
3 Executive Summary
4 Market Landscape
- 4.1 Market Overview
- 4.2 Market Drivers
- 4.2.1 EU landfill-to-10 % mandate (2035)
- 4.2.2 Extended Producer Responsibility (EPR) scaling across EU-27
- 4.2.3 Surge in AI/IoT smart-bin deployments
- 4.2.4 Rapid growth of e-commerce packaging waste
- 4.2.5 Chemical-recycling projects closing non-recyclable gap
- 4.2.6 Cement co-processing demand for Refuse-Derived Fuel (RDF)
- 4.3 Market Restraints
- 4.3.1 WtE incinerator CAPEX & social-license hurdles
- 4.3.2 Stagnation in plastic-recycling capacities
- 4.3.3 Talent shortage for AI-driven waste operations
- 4.3.4 Municipal "zero-incineration" activism curbing WtE pipelines
- 4.4 Value / Supply-Chain Analysis
- 4.5 Regulatory Landscape
- 4.6 Technological Outlook
- 4.7 Industry Attractiveness - Porter's Five Force Analysis
- 4.7.1 Threat of New Entrants
- 4.7.2 Bargaining Power of Suppliers
- 4.7.3 Bargaining Power of Buyers
- 4.7.4 Threat of Substitutes
- 4.7.5 Intensity of Competitive Rivalry
5 Market Size & Growth Forecasts (Values, In USD Billion)
- 5.1 By Source
- 5.1.1 Residential
- 5.1.2 Commercial (retail, office, etc.)
- 5.1.3 Industrial
- 5.1.4 Medical (Health and Pharmaceutical)
- 5.1.5 Construction & Demolition
- 5.1.6 Others (institutional, agricultural, etc)
- 5.2 By Service Type
- 5.2.1 Collection, Transportation, Sorting & Segregation
- 5.2.2 Disposal / Treatment
- 5.2.2.1 Landfill
- 5.2.2.2 Recycling & Resource Recovery
- 5.2.2.3 Incineration & Waste-to-Energy
- 5.2.2.4 Others (Chemical Treatment, Composting, etc.)
- 5.2.3 Others (Consulting, Audit & Training, etc.)
- 5.3 By Waste Type
- 5.3.1 Municipal Solid Waste
- 5.3.2 Industrial Hazardous Waste
- 5.3.3 E-waste
- 5.3.4 Plastic Waste
- 5.3.5 Biomedical Waste
- 5.3.6 Construction & Demolition Waste
- 5.3.7 Agricultural Waste
- 5.3.8 Other Specialized Waste (radio active, etc)
- 5.4 By Geography
- 5.4.1 United Kingdom
- 5.4.2 Germany
- 5.4.3 France
- 5.4.4 Italy
- 5.4.5 Spain
- 5.4.6 BENELUX (Belgium, Netherlands, and Luxembourg)
- 5.4.7 NORDICS (Denmark, Finland, Iceland, Norway, and Sweden)
- 5.4.8 Rest of Europe
6 Competitive Landscape
- 6.1 Market Concentration
- 6.2 Strategic Moves
- 6.3 Market Share Analysis
- 6.4 Company Profiles (includes Global level Overview, Market level overview, Core Segments, Financials as available, Strategic Information, Products & Services, Recent Developments)
- 6.4.1 Veolia
- 6.4.2 Suez
- 6.4.3 Remondis
- 6.4.4 FCC Environment
- 6.4.5 PreZero
- 6.4.6 Urbaser
- 6.4.7 Renewi
- 6.4.8 Biffa PLC
- 6.4.9 Viridor
- 6.4.10 ALBA Group
- 6.4.11 Stena Recycling
- 6.4.12 Cleanaway Germany
- 6.4.13 AVR
- 6.4.14 IAG-Ihlenberger
- 6.4.15 Covanta Europe
- 6.4.16 DS Smith Recycling
- 6.4.17 Macquarie Asset Management
- 6.4.18 Augean
- 6.4.19 Energy Capital Partners
- 6.4.20 Paprec Group
7 Market Opportunities & Future Outlook
- 7.1 White-space & Unmet-need Assessment
 废弃物管理市场:依服务类型、废弃物类型、处理技术和最终用户划分-2026-2032年全球市场预测
 智慧废弃物管理市场预测至2034年-全球分析(按组件、废弃物类型、解决方案类型、技术、最终用户和地区划分)
 全球 PFAS废弃物管理市场:按处理技术、服务类型、最终用途产业和地区划分 - 预测(至 2031 年)
 2026年全球多氟烷基物质(PFAS)废弃物管理市场报告2026年全球废弃物管理与回收服务市场报告2026年全球纺织废弃物管理市场报告2026年全球废弃物管理软体市场报告2026年全球放射性废弃物管理系统市场报告2026年全球水务和废弃物管理咨询服务市场报告
 全球废弃物管理软体市场规模、份额、趋势和成长分析报告(2026-2034年)