


 |
市场调查报告书
商品编码
1906908
作物保护化学品:市场占有率分析、产业趋势与统计、成长预测(2026-2031 年)Crop Protection Chemicals - Market Share Analysis, Industry Trends & Statistics, Growth Forecasts (2026 - 2031) |
||||||
※ 本网页内容可能与最新版本有所差异。详细情况请与我们联繫。
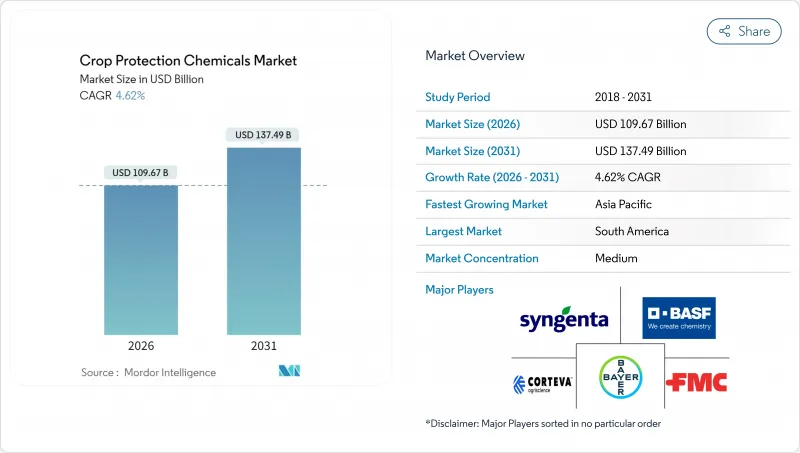
预计农业化学品市场规模将从 2025 年的 1,048.3 亿美元成长到 2026 年的 1,096.7 亿美元,到 2031 年将达到 1,374.9 亿美元,2026 年至 2031 年的复合年增长率为 4.62%。
儘管监管日益严格,但对高除草剂用量基因改造作物的稳定需求、精密农业的普及以及气候变迁导致的害虫迁移,仍支撑着农化市场的成长。精准喷雾器、无人机点喷和变数施药系统使种植者能够在保持药效的同时减少废弃物,帮助农化市场即使在劳动力短缺的地区也能实现生产力提升。南美洲占据最大市场份额,这主要归功于巴西大豆产量的不断增长;而亚太地区则保持着最高的复合年增长率,这主要归功于印度和中国商业农业的整合。叶面喷施仍然是最常见的施药方式,但土壤施用正呈现最高的增长速度,而再生农业实践正在推动芽前除草剂的使用。
全球作物保护化学品市场趋势与洞察
扩大基改作物的种植面积
如今,抗除草剂大豆、玉米和棉花在美洲的种植决策中占据主导地位,即使耕地总面积不断扩大,每公顷的化学品用量也随之增加。在巴西,到2024年,95%的种植面积将种植基改大豆,这将推动Glyphosate和麦草畏的销售量创下历史新高。种植者正在结合多种作用机制的除草剂以延缓抗药性的发展,并倾向于选择提供种子和农药一体化组合的供应商,以确保整个种植季节的盈利能力。阿根廷核准耐旱大豆「HB4」的种植进一步扩大了面积,尤其是在历史上受缺水限制的边缘地区。随着专利即将到期,品牌药生产商正在加速开发增强型化学製剂组合以维持利润率。同时,非专利生产商则专注于扩大专利到期活性成分的供应。基因改造技术的浪潮正在维持除草剂的整体需求,支撑组合产品的溢价,并鼓励对专注于特殊性能组合的配方技术进行更多投资。
抗除草剂杂草增多
抗Glyphosate除草剂的苋菜已蔓延至美国27个州,并正在南美洲蔓延,迫使种植者轮换使用除草剂并增加施药频率。抗性生物型如今对ALS抑制剂构成威胁,两到四种产品的混合使用成为新的标准。这场抗药性竞赛推动了对具有新型作用机制的除草剂和简化管理的优质预混合料的需求。在经历了停滞十年之后,化学创新研发的重要性日益凸显,数位化田间巡查工具也越来越受欢迎,成为在杂草失控前辨识虫害的有效手段。每英亩除草剂成本的上涨以及潜在产量损失带来的经济负担,促使种植者愿意投资于能够恢復杂草控制的解决方案,这为创新者在不久的将来创造了明确的收入来源。
严格禁止使用农药并收紧残留基准值(重点关注欧盟)
欧洲当局持续审查活性成分,预计2024年,将有15种关键化学品失去续约资格。同时,残留基准值也不断降低。南美和非洲的出口型生产商即使销往其他地区,也面临着为满足欧盟标准而产生的合规成本,因为全球粮食买家遵循着最严格的标准。小型生产商难以资金筹措新的数据包,这加速了有能力投资毒理学和环境影响评估的大型公司的市场份额成长。种植者开始转向使用残留量更低、价格更高的新型农药,但儘管每公顷的支出增加,疲软的商品价格却挤压了利润空间。由于缺乏有效的农药,一些农民被迫重新使用传统产品或增加施药频率,导致化学品总用量异常增长,这与政策初衷背道而驰。研究重点正转向生物基或低残留分子,这延长了研发週期,并提高了进入门槛。监管和商业性压力的综合影响将使预测的复合年增长率下降0.8个百分点,预计到2027年宽限期到期时,收入受到的影响最为严重。拥有强大的欧盟监管团队和具有快速核准潜力的在研活性物质的公司,在新规下将具有相对优势。
细分市场分析
到2025年,除草剂将占作物保护化学品市场的42.35%,占据市场规模的最大份额,并贡献大部分新增收入。长芒苋和飞蓬属植物持续存在的抗药性问题使得多点处理成为必要,促使种植者采用价格较高的复配製剂。虽然Glyphosate在销售方面仍然占据主导地位,但市场需求正转向HPPD抑制剂、PPO抑制剂以及用于抗药性后期控制的新型专利化学製剂。这种产品组合的持续丰富支撑了到2031年5.02%的强劲复合年增长率预测。
基因改造作物性状的持续应用导致每公顷除草剂用量居高不下,尤其是在巴西和阿根廷。种子和作物保护一体化解决方案使主要供应商能够将性状与客製化应用相结合,从而保护智慧财产权和毛利率。杀菌剂的市占率大致相当,这得益于与天气相关的病害发生率的增加以及2024年巴西上市的Revysol(一种具有新型大豆銹病防治机制的杀菌剂)。杀虫剂的需求会随着气候相关害虫的入侵而出现间歇性高峰。杀线虫剂和杀软体动物剂虽然属于小众市场,但在高价值园艺领域至关重要,因为即使是微小的产量损失也会侵蚀盈利。
作物保护化学品市场报告按功能(杀菌剂、除草剂、杀虫剂、杀贝剂等)、施用方法(化学灌根、叶面喷布、种子处理等)、作物类型(经济作物、水果和蔬菜、谷物、豆类和油籽等)以及地区(非洲、欧洲、北美等)进行结构划分。市场预测以价值(美元)和数量(公吨)为单位。
区域分析
到2025年,南美洲将占据全球作物保护化学品市场41.85%的份额,这主要得益于巴西塞拉多草原地区大豆和玉米的大规模生产。仅巴西一国就消耗了该地区总量的60%以上,主要得益于2024年连续种植週期中农药采购量的创纪录增长。出口导向农场也促进了阿根廷的成长,该国基因改造作物种植面积占全国种植面积的95%以上,强化了以除草剂为主导的农业模式。儘管港口偶尔会出现物流方面的挑战,但有利的气候条件和政府优先考虑外汇收入的政策,共同支撑着南美洲的稳定成长。
亚太地区是成长最快的市场,预计到2031年将以4.73%的年复合成长率(CAGR)成长。印度、中国和东南亚国家农业集约化和机械化程度的提高是推动这一增长的主要因素。印度大力发展商业化农业,预计2024年农药使用量将成长15%,这主要是由于规模较大的农场需要贯穿整个生长季的病虫害防治计画。中国的环境政策推动了农药工厂的密集生产,同时推广使用符合国家食品安全标准的高效低残留农药。此外,印尼、泰国和越南棕榈油和密集水稻种植系统的扩张,在潮湿气候下需要使用专门的杀菌剂和杀虫剂来保护作物,也促进了农药需求的增长。
北美占全球消费量的大部分,这得益于精密农业的普及(35%的大型农场采用精准农业来优化施药时间)。在美国,基改作物种植面积的扩大和杂草抗药性的增强,使得每英亩除草剂支出在利润率较低的情况下仍然保持稳定。欧洲也占了很大一部分需求,但严格的法规和残留限量促使投资转向低剂量化学品和生物解决方案。儘管有这些限制,特色果蔬产业仍保持着较高的市场价值。非洲仍然是最小的区域市场,但南非的商业农业计划和西非新兴农业中心正在开始实施现代作物保护方案,这表明长期需求将逐步成长。
其他福利:
- Excel格式的市场预测(ME)表
- 3个月的分析师支持
目录
第一章 引言
- 研究假设和市场定义
- 调查范围
- 调查方法
第二章 报告
第三章执行摘要和主要发现
第四章:主要产业趋势
- 每公顷农药消费量
- 活性成分价格分析
- 法律规范
- 阿根廷
- 澳洲
- 巴西
- 加拿大
- 智利
- 中国
- 法国
- 德国
- 印度
- 印尼
- 义大利
- 日本
- 墨西哥
- 缅甸
- 荷兰
- 巴基斯坦
- 菲律宾
- 俄罗斯
- 南非
- 西班牙
- 泰国
- 乌克兰
- 英国
- 美国
- 越南
- 价值炼和通路分析
- 市场驱动因素
- 扩大基改作物的种植面积
- 抗除草剂杂草增多
- 精密农业技术的应用
- 亚太和南美洲商业农业的快速发展
- 再生农业倾向于使用选择性化学物质
- 气候变迁导致害虫向温带地区迁移
- 市场限制
- 更严格的农药禁令和更严格的最大基准值(MRL)(重点关注欧盟)
- 加速杂草对Glyphosate和ALS抑制剂的抗药性
- 中国技术级供应链不稳定
- 生物农药的迅速普及蚕食了合成农药的市占率。
第五章 市场规模和成长预测(价值和数量)
- 功能
- 消毒剂
- 除草剂
- 杀虫剂
- 软体动物杀虫剂
- 杀线虫剂
- 应用模式
- 化学灌溉
- 叶面喷布
- 熏蒸
- 种子处理
- 土壤处理
- 作物类型
- 经济作物
- 水果和蔬菜
- 谷物和谷类
- 豆类和油籽
- 草坪和观赏植物
- 地区
- 非洲
- 南非
- 其他非洲地区
- 亚太地区
- 澳洲
- 中国
- 印度
- 印尼
- 日本
- 缅甸
- 巴基斯坦
- 菲律宾
- 泰国
- 越南
- 亚太其他地区
- 欧洲
- 法国
- 德国
- 义大利
- 荷兰
- 俄罗斯
- 西班牙
- 乌克兰
- 英国
- 其他欧洲地区
- 北美洲
- 加拿大
- 墨西哥
- 美国
- 北美其他地区
- 南美洲
- 阿根廷
- 巴西
- 智利
- 其他南美洲
- 非洲
第六章 竞争情势
- 关键策略倡议
- 市占率分析
- 公司概况
- 公司简介
- BASF SE
- Bayer AG
- Corteva Inc.
- FMC Corporation
- Jiangsu Yangnong Chemical Group Co., Ltd.
- Nufarm Limited
- Sumitomo Chemical Co., Ltd.
- Syngenta Group Co., Ltd.
- UPL Ltd.
- Lallemand Inc.(Animal Nutrition)
- EW Nutrition GmbH
- Kemin Industries Inc.
- Novus International Inc.
- Vitafor NV
第七章:CEO们需要思考的关键策略问题
The crop protection chemicals market is expected to grow from USD 104.83 billion in 2025 to USD 109.67 billion in 2026 and is forecast to reach USD 137.49 billion by 2031 at 4.62% CAGR over 2026-2031.
Steady demand for herbicide-intensive, genetically modified crops, the adoption of precision agriculture, and climate-driven pest migration continue to sustain the growth curve, despite tighter regulatory oversight. Precision sprayers, drone-based spot treatments, and variable-rate application systems enable growers to cut waste while maintaining efficacy, helping the crop protection chemicals market capture productivity gains even in regions facing labor shortages. South America accounts for the largest share, driven by Brazil's expansion of soybean production, while the Asia-Pacific region records the fastest CAGR, largely due to commercial farming consolidation in India and China. Foliar treatments remain the most common delivery mode, yet soil treatments post the highest growth, and regenerative practices encourage pre-emergent chemistries.
Global Crop Protection Chemicals Market Trends and Insights
GM-Crop Acreage Expansion
Herbicide-tolerant soybeans, corn, and cotton now dominate planting decisions in the Americas, lifting per-hectare chemical intensity even as overall farmland expands. Brazil planted GM soybeans on 95% of its area in 2024, which propelled glyphosate and dicamba sales to record highs. Growers stack multiple modes of action to delay resistance, favoring suppliers with integrated seed and chemical bundles that lock in season-long revenue. Argentina's approval of HB4 drought-tolerant soybeans further broadens the addressable acreage, especially in marginal regions that have been historically constrained by water stress. As patents expire, branded players accelerate the development of trait-plus-chemistry packages to protect their margins, while generic manufacturers focus on increasing volume in off-patent actives. Collectively, the GM wave sustains herbicide demand, supports premium pricing on combination products, and drives incremental investments in formulation technologies tailored to trait packages.
Rising Herbicide-Resistant Weeds
Glyphosate-resistant Palmer amaranth has spread to 27 U.S. states and is advancing across South America, forcing growers to rotate chemistries and increase application frequency. Resistant biotypes now challenge ALS inhibitors as well, making two- to four-way tank mixes the new norm. This resistance arms race elevates demand for novel modes of action and premium premixes that simplify stewardship. Chemical innovation pipelines regain urgency after a slow decade, while digital scouting tools gain traction to pinpoint outbreaks before they become unmanageable. The economic burden of higher herbicide costs per acre and potential yield loss keeps growers willing to pay for solutions that restore control, giving innovators a clear revenue runway in the near term.
Stringent Pesticide Bans and MRL Tightening (European Union focus)
European authorities continue to review active ingredients, with 15 key chemistries set to lose renewal in 2024, while maximum residue limits are being steadily lowered. Export-oriented producers in South America and Africa now face compliance costs to meet EU tolerances, even when selling to other destinations, because global grain buyers conform to the strictest standards. Smaller manufacturers struggle to finance new data packages, accelerating market share gains for top-tier firms that can invest in toxicology and environmental dossiers. Growers switch to newer, more expensive actives that carry lower residue profiles, lifting per-hectare spend but squeezing margins when commodity prices soften. Missing tools force some farmers to revert to older, more frequent applications, paradoxically increasing the overall chemical load despite the policy intent. Research priorities shift toward bio-based or low-residue molecules, lengthening development timelines and raising the bar for entry. The combined regulatory and commercial pressure subtracts 0.8 percentage points from the forecast CAGR, with the sharpest revenue impact projected to arrive before 2027 as grace periods expire. Companies with robust EU regulatory teams and pipeline actives positioned for fast approval gain a relative advantage under the new rules.
Other drivers and restraints analyzed in the detailed report include:
- Adoption of Precision-Ag Technologies
- Rapid Growth of Commercial Farming in Asia-Pacific and South America
- Fast Uptake of Biologicals Cannibalizing Synthetic Sales
For complete list of drivers and restraints, kindly check the Table Of Contents.
Segment Analysis
Herbicide captured a 42.35% market share of the crop protection chemicals market in 2025, representing the largest slice of the market size and generating the bulk of incremental revenue growth. Persistent resistance in Palmer amaranth and Conyza species necessitates multi-site programs, prompting growers to adopt stacked formulations that carry premium price points. Glyphosate still dominates the volume, but demand is increasingly shifting to HPPD inhibitors, PPO inhibitors, and new proprietary chemistries positioned for post-resistance control. The resulting mix upgrade underpins a robust 5.02% CAGR forecast to 2031.
Continued GM trait adoption, especially in Brazil and Argentina, sustains high herbicide intensity per hectare. Integrated seed-and-chemical offerings allow leading suppliers to bundle traits with tailored sprays, protecting both intellectual property and gross margins. Fungicides hold roughly significant share, supported by weather-linked disease flare-ups and the 2024 launch of Revysol in Brazil, which offers a new mode of action against soybean rust. Insecticides are seeing sporadic spikes when climate-driven pest incursions occur. Nematicides and molluscicides remain niche but essential for high-value horticulture, where even minor yield losses undermine profitability.
The Crop Protection Chemicals Market Report is Segmented by Function (Fungicide, Herbicide, Insecticide, Molluscicide, and More), Application Mode (Chemigation, Foliar, Seed Treatment, and More), Crop Type (Commercial Crops, Fruits & Vegetables, Grains & Cereals, Pulses & Oilseeds, and More), and Geography (Africa, Europe, North America, and More). The Market Forecasts are Provided in Terms of Value (USD) and Volume (Metric Tons).
Geography Analysis
South America accounted for 41.85% of the crop protection chemicals market share in 2025, driven by Brazil's extensive soybean and corn production in the Cerrado savanna. Brazil alone consumed over 60% of the regional volume, supported by record pesticide purchases for consecutive planting cycles during the 2024 season. Argentina's export-focused farms contributed to growth, with genetically modified (GM) crop adoption surpassing 95% of national acreage, reinforcing herbicide-intensive farming practices. Favorable weather conditions and government policies prioritizing foreign exchange earnings have supported steady growth in South America, despite occasional logistical challenges at ports.
The Asia-Pacific region is the fastest-growing market, with a compound annual growth rate (CAGR) of 4.73% projected through 2031. Growth is driven by land consolidation and increased mechanization in countries such as India, China, and Southeast Asia. In India, commercial farming initiatives led to a 15% increase in chemical usage in 2024, as larger field sizes required season-long pest control programs. In China, environmental policies have prompted pesticide plant consolidation while encouraging the use of higher-efficacy, lower-residue chemicals that align with national food safety standards. Additionally, Indonesia, Thailand, and Vietnam have contributed to incremental demand through expanding palm oil and intensive rice farming systems, which rely on specialized fungicides and insecticides to protect crops in humid climates.
North America represents a significant portion of global consumption, supported by the adoption of precision agriculture, which now covers 35% of large farms and optimizes application timing. In the United States, high GM-crop acreage and increasing weed resistance have sustained per-acre herbicide expenditures, despite tight profit margins. Europe accounts for a substantial share of demand, but stringent regulations and residue limits have shifted investments toward low-dose chemistries and biological solutions. Despite these restrictions, the specialty fruit and vegetable segments maintain high market value. Africa remains the smallest regional market; however, commercial farming projects in South Africa and emerging hubs in West Africa are beginning to adopt modern crop protection programs, indicating a gradual increase in long-term demand.
- BASF SE
- Bayer AG
- Corteva Inc.
- FMC Corporation
- Jiangsu Yangnong Chemical Group Co., Ltd.
- Nufarm Limited
- Sumitomo Chemical Co., Ltd.
- Syngenta Group Co., Ltd.
- UPL Ltd.
- Lallemand Inc. (Animal Nutrition)
- EW Nutrition GmbH
- Kemin Industries Inc.
- Novus International Inc.
- Vitafor N.V.
Additional Benefits:
- The market estimate (ME) sheet in Excel format
- 3 months of analyst support
TABLE OF CONTENTS
1 Introduction
- 1.1 Study Assumptions and Market Definition
- 1.2 Scope of the Study
- 1.3 Research Methodology
2 Report Offers
3 Executive Summary and Key Findings
4 Key Industry Trends
- 4.1 Consumption of Pesticide per Hectare
- 4.2 Pricing Analysis for Active Ingredients
- 4.3 Regulatory Framework
- 4.3.1 Argentina
- 4.3.2 Australia
- 4.3.3 Brazil
- 4.3.4 Canada
- 4.3.5 Chile
- 4.3.6 China
- 4.3.7 France
- 4.3.8 Germany
- 4.3.9 India
- 4.3.10 Indonesia
- 4.3.11 Italy
- 4.3.12 Japan
- 4.3.13 Mexico
- 4.3.14 Myanmar
- 4.3.15 Netherlands
- 4.3.16 Pakistan
- 4.3.17 Philippines
- 4.3.18 Russia
- 4.3.19 South Africa
- 4.3.20 Spain
- 4.3.21 Thailand
- 4.3.22 Ukraine
- 4.3.23 United Kingdom
- 4.3.24 United States
- 4.3.25 Vietnam
- 4.4 Value Chain and Distribution Channel Analysis
- 4.5 Market Drivers
- 4.5.1 GM-crop acreage expansion
- 4.5.2 Rising herbicide-resistant weeds
- 4.5.3 Adoption of precision-ag technologies
- 4.5.4 Rapid growth of commercial farming in Asia-Pacific and South America
- 4.5.5 Regenerative agriculture favoring selective chemistries
- 4.5.6 Climate-driven pest migration into temperate zones
- 4.6 Market Restraints
- 4.6.1 Stringent pesticide bans and MRL tightening (European Union focus)
- 4.6.2 Accelerating weed resistance to glyphosate and ALS inhibitors
- 4.6.3 Volatile Chinese technical-grade supply chain
- 4.6.4 Fast uptake of biologicals cannibalizing synthetic sales
5 Market Size and Growth Forecasts (Value and Volume)
- 5.1 Function
- 5.1.1 Fungicide
- 5.1.2 Herbicide
- 5.1.3 Insecticide
- 5.1.4 Molluscicide
- 5.1.5 Nematicide
- 5.2 Application Mode
- 5.2.1 Chemigation
- 5.2.2 Foliar
- 5.2.3 Fumigation
- 5.2.4 Seed Treatment
- 5.2.5 Soil Treatment
- 5.3 Crop Type
- 5.3.1 Commercial Crops
- 5.3.2 Fruits and Vegetables
- 5.3.3 Grains and Cereals
- 5.3.4 Pulses and Oilseeds
- 5.3.5 Turf and Ornamental
- 5.4 Geography
- 5.4.1 Africa
- 5.4.1.1 South Africa
- 5.4.1.2 Rest of Africa
- 5.4.2 Asia-Pacific
- 5.4.2.1 Australia
- 5.4.2.2 China
- 5.4.2.3 India
- 5.4.2.4 Indonesia
- 5.4.2.5 Japan
- 5.4.2.6 Myanmar
- 5.4.2.7 Pakistan
- 5.4.2.8 Philippines
- 5.4.2.9 Thailand
- 5.4.2.10 Vietnam
- 5.4.2.11 Rest of Asia-Pacific
- 5.4.3 Europe
- 5.4.3.1 France
- 5.4.3.2 Germany
- 5.4.3.3 Italy
- 5.4.3.4 Netherlands
- 5.4.3.5 Russia
- 5.4.3.6 Spain
- 5.4.3.7 Ukraine
- 5.4.3.8 United Kingdom
- 5.4.3.9 Rest of Europe
- 5.4.4 North America
- 5.4.4.1 Canada
- 5.4.4.2 Mexico
- 5.4.4.3 United States
- 5.4.4.4 Rest of North America
- 5.4.5 South America
- 5.4.5.1 Argentina
- 5.4.5.2 Brazil
- 5.4.5.3 Chile
- 5.4.5.4 Rest of South America
- 5.4.1 Africa
6 Competitive Landscape
- 6.1 Key Strategic Moves
- 6.2 Market Share Analysis
- 6.3 Company Landscape
- 6.4 Company Profiles (Includes Global Level Overview, Market Level Overview, Core Business Segments, Financials, Headcount, Key Information, Market Rank, Market Share, Products and Services, and Analysis of Recent Developments)
- 6.4.1 BASF SE
- 6.4.2 Bayer AG
- 6.4.3 Corteva Inc.
- 6.4.4 FMC Corporation
- 6.4.5 Jiangsu Yangnong Chemical Group Co., Ltd.
- 6.4.6 Nufarm Limited
- 6.4.7 Sumitomo Chemical Co., Ltd.
- 6.4.8 Syngenta Group Co., Ltd.
- 6.4.9 UPL Ltd.
- 6.4.10 Lallemand Inc. (Animal Nutrition)
- 6.4.11 EW Nutrition GmbH
- 6.4.12 Kemin Industries Inc.
- 6.4.13 Novus International Inc.
- 6.4.14 Vitafor N.V.
7 Key Strategic Questions for Crop Protection Chemicals CEOs
 越南农作物保护化学品:市场占有率分析、产业趋势与统计、成长预测(2026-2031)非洲作物保护化学品:市场占有率分析、产业趋势与统计、成长预测(2026-2031 年)
 全球作物保护化学品市场规模、份额、趋势和成长分析报告(2026-2034年)
 2026年全球作物保护化学品市场报告
 作物保护化学品市场-全球产业规模、份额、趋势、机会、预测:按类型、原料、应用方法、地区和竞争格局划分,2021-2031年
 农药暴露防护市场依产品、材料、技术、最终用途产业及通路划分,全球预测(2026-2032)化肥和农药市场按产品类型、作物类型、配方、原料、作用方式、施用方法、最终用户和分销管道划分-全球预测(2026-2032 年)呋虫胺技术市场按作物类型、製剂、应用、最终用途产业和分销管道划分,全球预测,2026-2032年烯效唑技术市场依作物类型、形态、应用和分销管道划分,全球预测(2026-2032年)北美作物保护化学品:市场份额分析、行业趋势、统计数据和成长预测(2026-2031 年)