


 |
市场调查报告书
商品编码
1906938
印尼可再生能源市场:市场占有率分析、产业趋势与统计、成长预测(2026-2031年)Indonesia Renewable Energy - Market Share Analysis, Industry Trends & Statistics, Growth Forecasts (2026 - 2031) |
||||||
※ 本网页内容可能与最新版本有所差异。详细情况请与我们联繫。
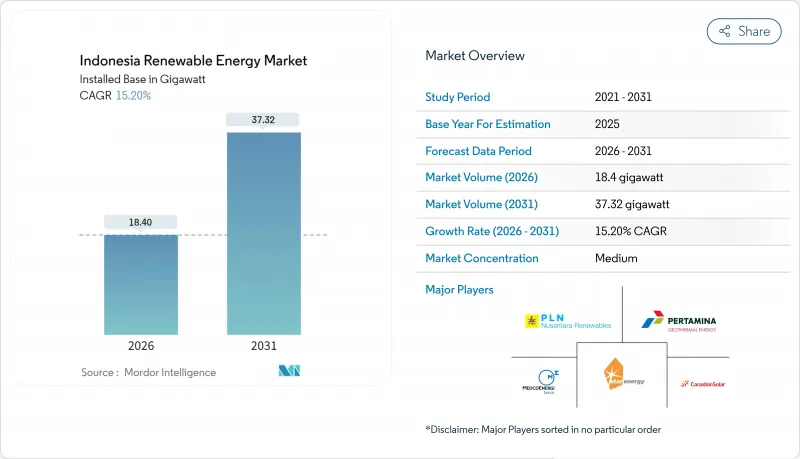
预计到 2026 年,印尼可再生能源市场规模将达到 18.4 吉瓦,高于 2025 年的 15.97 吉瓦,预计到 2031 年将达到 37.32 吉瓦,2026 年至 2031 年的复合年增长率为 15.20%。
强有力的政策支持、不断下降的技术成本以及日益增长的商业需求,正推动着这一发展势头,因为政府力求在实现气候目标的同时促进经济成长。普拉博沃·苏比安托总统于2025年1月为总投资72兆印尼币(约44亿美元)的37个电力计划举行了奠基仪式,这凸显了国家对电网升级和新增产能的支持。儘管水力发电在发电结构中仍占据主导地位,但由于计划经济效益的提升以及独立发电商(IPP)资产多元化经营,太阳能光电发电正经历最快的成长。随着包括200亿美元「公正能源转型伙伴关係」在内的气候融资的流入,资本约束正在缓解,但燃煤电厂产能过剩以及国有电力公司PLN的单一买家模式仍然阻碍着私人投资。
印尼可再生能源市场趋势与分析
太阳能和风能发电的平准化电成本(LCOE)下降
2024年,全球太阳能光电发电成本将降至平均每千瓦时0.044美元,陆域风电成本将降至每千瓦时0.033美元,均低于煤炭发电的基准值每千瓦时0.065美元。随着印尼于2024年8月放宽在地采购限制,允许开发商在保持国内组装的同时进口更便宜的组件,印尼的计划储备正在加速成长。这些经济因素促使印尼国家电力公司(PLN)将重点放在控制发电成本上,特别是燃料成本节约和碳价格风险,使得新建设的经济效益向可再生倾斜。因此,印尼的可再生能源市场正稳步转向太阳能和风能,以增加新增装置容量。正在进行的资金筹措改革透过降低开发商先前面临的溢价,进一步扩大了这种成本差距。
根据 RUPTL 2025-34 年计划,新增可再生能源装置容量为 53 吉瓦。
印尼电力供应计画要求2034年新增69.5吉瓦的电力装置容量,其中76%将来自可再生能源或储能。这将需要2,967兆印尼币(约1,825亿美元)的投资。该计画预计73%的资金将透过公私伙伴关係资金筹措,将推动印尼可再生能源市场走向更深层的技术多元化。蓝图规划了17.1吉瓦的太阳能、7.2吉瓦的风能和5.2吉瓦的地热能,旨在打破传统水力发电主导的局面,建造更灵活的电网。计划建造的两台250兆瓦核能发电机组标誌着印尼致力于实现长期低碳基本负载供电,而2040年可再生能源占比达到41%的目标则为投资者提供了更清晰的投资前景。
煤炭产能过剩及强制性营运购电协议
传统的燃煤购电协议(PPA)要求印尼国家电力公司(PLN)即使在电厂运作的情况下也需支付容量费,每年造成该公司超过80亿美元的损失。这些「主运行」条款阻碍了更廉价的可再生能源的普及,并限制了其近期成长,儘管再生能源在经济上具有优势。虽然预计随着能源转型机制下的提前退役机制获得资金筹措和合约重新谈判,煤炭的结构性锁定将有所缓解,但时间表仍不明朗,并继续制约着印尼可再生能源市场的成长。
细分市场分析
截至2025年,水力发电将占印尼可再生能源市场份额的47.70%,这主要得益于2020年前已运作的现有水坝。同时,预计2026年至2031年间,风力发电装置容量将以55.95%的复合年增长率成长,这主要得益于苏拉威西岛的离岸风力发电区域和南苏拉威西岛的优质陆上风电场。印尼水力发电领域的可再生能源市场规模预计将缓慢成长,因为未来的扩张将倾向于避免安置问题的小规模径流式水力发电计划。同时,在爪哇岛、峇里岛和浮动水库,太阳能光电发电装置正在快速扩张,这主要得益于符合容量支付条件的四小时储能係统的增加。
风电的快速成长得益于ACWA Power和Masdar的合资投资以及较高的装置容量利用率,但海底电缆连接和海上区域开发仍不成熟。地热计划虽然受到钻井风险和高昂前期成本的限制,但仍以每年200-300兆瓦的速度稳定成长,为印尼国家电力公司(PLN)的电网规划提供可调节的基本负载电源。生质能源的成长遵循B40和B50混合能源指令,该指令稳定了棕榈油生产的生物质原料需求。海洋能源仍处于试验阶段,收费系统尚待明确。预计到本世纪末,这种不断变化的能源构成比将使印尼的可再生能源市场向可变可再生和储能转型。
印尼可再生能源市场报告按技术(太阳能、风力发电、水力发电、生质能源、地热能和海洋能)和最终用户(公共产业、商业和工业以及住宅)进行细分。市场规模和预测以装置容量(吉瓦)为单位。
其他福利:
- Excel格式的市场预测(ME)表
- 3个月的分析师支持
目录
第一章 引言
- 研究假设和市场定义
- 调查范围
第二章调查方法
第三章执行摘要
第四章 市场情势
- 市场概览
- 市场驱动因素
- 太阳能和风能发电的平准化电成本(LCOE)下降
- RUPTL 2025-34 年计画引进 53 吉瓦的新增可再生能源
- JETP和多边气候融资流动
- 推广强制性B40/B50生质燃料掺混
- 资料中心和企业购电协议的快速成长
- 用于最后一公里电气化的离网微电网
- 市场限制
- 煤炭产能过剩及强制性营运购电协议
- 与东南亚国协相比,资本成本较高
- PLN的垄断地位限制了竞争。
- 风力发电厂和水力发电厂的土地征用争议
- 供应链分析
- 监管环境
- 技术展望
- 波特五力模型
- 供应商的议价能力
- 买方的议价能力
- 新进入者的威胁
- 替代品的威胁
- 竞争对手之间的竞争
- PESTEL 分析
第五章 市场规模与成长预测
- 透过技术
- 太阳能(光伏和聚光太阳能)
- 风力发电(陆上和海上)
- 水力发电(小规模、大型、抽水蓄能)
- 生质能源
- 地热
- 海洋能源(潮汐能和波浪能)
- 最终用户
- 电力公司
- 商业和工业
- 住宅
第六章 竞争情势
- 市场集中度
- 策略性倡议(併购、伙伴关係、购电协议)
- 市场占有率分析(主要企业的市场排名和份额)
- 公司简介
- PLN Renewables(PT Pembangkitan Jawa-Bali, PT Indonesia Power)
- Pertamina Geothermal Energy
- Star Energy Geothermal
- Medco Power Indonesia
- Canadian Solar Inc.
- Trina Solar Ltd
- PT Sumber Energi Sukses Makmur
- PT Barito Renewables Energy Tbk
- SEG Solar
- PT ATW Solar Indonesia
- Fourth Partner Energy Pvt Ltd
- Xurya Daya Indonesia
- TotalEnergies ENEOS
- ACWA Power
- Masdar
- Northstar PLTS
- Bright PLN Batam
- PT Supreme Energy
- PT Geo Dipa Energi
- PT Sarulla Operations
第七章 市场机会与未来展望
Indonesia Renewable Energy market size in 2026 is estimated at 18.4 gigawatt, growing from 2025 value of 15.97 gigawatt with 2031 projections showing 37.32 gigawatt, growing at 15.20% CAGR over 2026-2031.
Strong policy tailwinds, falling technology costs, and rising corporate demand drive this momentum while the government balances climate goals with economic growth. President Prabowo Subianto's January 2025 inauguration of 37 electricity projects worth IDR 72 trillion (USD 4.4 billion) underscored state backing for grid upgrades and new capacity. Hydropower still leads the generation mix, yet solar PV registers the fastest growth as project economics improve, and independent power producers diversify beyond legacy assets. Climate-finance inflows, including the USD 20 billion Just Energy Transition Partnership, are easing capital constraints, though coal over-capacity and PLN's single-buyer model continue to slow private investment.
Indonesia Renewable Energy Market Trends and Insights
Falling solar & wind LCOE
Global average solar costs fell to USD 0.044/kWh in 2024 and onshore wind to USD 0.033/kWh, undercutting coal's USD 0.065/kWh benchmark. Indonesia's August 2024 relaxation of local-content rules lets developers import cheaper modules while keeping assembly onshore, accelerating project pipelines. These economics sharpen PLN's focus on curbing generation costs, especially as avoided fuel outlays and carbon-pricing risks tilt new-build economics toward renewables. The result is a steady pivot in the Indonesian renewable energy market toward solar and wind for green-field capacity additions. Ongoing financing reforms further magnify this cost parity by narrowing the premium that developers once faced.
RUPTL 2025-34 Pipeline of 53 GW New Renewable Capacity
Indonesia's power-supply plan calls for 69.5 GW of new capacity by 2034, 76% of which is renewable or storage, requiring IDR 2,967 trillion (USD 182.5 billion) in investment. Private partnerships are expected to fund 73% of this pipeline, shifting the Indonesian renewable energy market toward deeper technology diversification. The roadmap earmarks 17.1 GW solar, 7.2 GW wind, and 5.2 GW geothermal, moving beyond hydropower's historic dominance and enabling a more flexible grid. Two planned 250 MW nuclear units underscore a longer-term quest for baseload low-carbon supply, while the 41% renewable target for 2040 offers clearer visibility for investors.
Coal Over-Capacity & Must-Run PPAs
Legacy coal PPAs obligate PLN to pay capacity charges even when plants are idle, costing the utility more than USD 8 billion annually. These must-run clauses crowd out procurement of cheaper renewables, limiting short-term additions despite favorable economics. Coal's structural lock-in is set to ease only as early-retirement schemes under the Energy Transition Mechanism secure funding and renegotiate contracts, but the timetable remains uncertain and continues to temper growth in the Indonesian renewable energy market.
Other drivers and restraints analyzed in the detailed report include:
- JETP & Multilateral Climate-Finance Inflows
- Mandatory B40/B50 Biofuel Blending Push
- High Cost of Capital versus ASEAN Peers
For complete list of drivers and restraints, kindly check the Table Of Contents.
Segment Analysis
Hydropower held 47.70% of Indonesia's Renewable Energy market share in 2025, owing to legacy dams commissioned before 2020. Conversely, wind capacity is forecast to post a 55.95% CAGR from 2026 to 2031, fueled by offshore zones in Sulawesi and robust onshore sites in South Sulawesi. The Indonesian Renewable Energy market size for hydropower will grow slowly as future additions skew to small run-of-river projects that skirt resettlement controversies. Solar installations are accelerating in Java, Bali, and on floating reservoirs, benefiting from 4-hour battery add-ons that qualify for capacity payments.
Wind's rapid rise rests on higher capacity factors and joint-venture finance from ACWA Power and Masdar, although subsea-cable links and marine-use zoning remain underdeveloped. Geothermal projects add a steady 200-300 MW annually, constrained by drilling risk and high upfront cost, yet provide dispatchable baseload that anchors PLN's system planning. Bioenergy growth follows B40 and B50 blending mandates that stabilize biomass feedstock demand in palm-oil provinces. Ocean energy stays at pilot scale pending tariff clarity. The evolving mix will pivot the Indonesian Renewable Energy market toward variable renewables plus storage by the late decade.
The Indonesia Renewable Energy Market Report is Segmented by Technology (Solar Energy, Wind Energy, Hydropower, Bioenergy, Geothermal, and Ocean Energy) and End-User (Utilities, Commercial and Industrial, and Residential). The Market Sizes and Forecasts are Provided in Terms of Installed Capacity (GW).
List of Companies Covered in this Report:
- PLN Renewables (PT Pembangkitan Jawa-Bali, PT Indonesia Power)
- Pertamina Geothermal Energy
- Star Energy Geothermal
- Medco Power Indonesia
- Canadian Solar Inc.
- Trina Solar Ltd
- PT Sumber Energi Sukses Makmur
- PT Barito Renewables Energy Tbk
- SEG Solar
- PT ATW Solar Indonesia
- Fourth Partner Energy Pvt Ltd
- Xurya Daya Indonesia
- TotalEnergies ENEOS
- ACWA Power
- Masdar
- Northstar PLTS
- Bright PLN Batam
- PT Supreme Energy
- PT Geo Dipa Energi
- PT Sarulla Operations
Additional Benefits:
- The market estimate (ME) sheet in Excel format
- 3 months of analyst support
TABLE OF CONTENTS
1 Introduction
- 1.1 Study Assumptions & Market Definition
- 1.2 Scope of the Study
2 Research Methodology
3 Executive Summary
4 Market Landscape
- 4.1 Market Overview
- 4.2 Market Drivers
- 4.2.1 Falling solar & wind LCOE
- 4.2.2 RUPTL 2025-34 pipeline of 53 GW new RE
- 4.2.3 JETP & multilateral climate-finance inflows
- 4.2.4 Mandatory B40/B50 biofuel blending push
- 4.2.5 Data-centre & corporate PPA boom
- 4.2.6 Off-grid microgrids for last-mile electrification
- 4.3 Market Restraints
- 4.3.1 Coal over-capacity & must-run PPAs
- 4.3.2 High cost of capital vs ASEAN peers
- 4.3.3 PLN single-buyer monopoly limits competition
- 4.3.4 Land-acquisition conflicts in wind/hydro sites
- 4.4 Supply-Chain Analysis
- 4.5 Regulatory Landscape
- 4.6 Technological Outlook
- 4.7 Porters Five Forces
- 4.7.1 Bargaining Power of Suppliers
- 4.7.2 Bargaining Power of Buyers
- 4.7.3 Threat of New Entrants
- 4.7.4 Threat of Substitutes
- 4.7.5 Competitive Rivalry
- 4.8 PESTLE Analysis
5 Market Size & Growth Forecasts
- 5.1 By Technology
- 5.1.1 Solar Energy (PV and CSP)
- 5.1.2 Wind Energy (Onshore and Offshore)
- 5.1.3 Hydropower (Small, Large, PSH)
- 5.1.4 Bioenergy
- 5.1.5 Geothermal
- 5.1.6 Ocean Energy (Tidal and Wave)
- 5.2 By End-User
- 5.2.1 Utilities
- 5.2.2 Commercial and Industrial
- 5.2.3 Residential
6 Competitive Landscape
- 6.1 Market Concentration
- 6.2 Strategic Moves (M&A, Partnerships, PPAs)
- 6.3 Market Share Analysis (Market Rank/Share for key companies)
- 6.4 Company Profiles (includes Global level Overview, Market level overview, Core Segments, Financials as available, Strategic Information, Products & Services, and Recent Developments)
- 6.4.1 PLN Renewables (PT Pembangkitan Jawa-Bali, PT Indonesia Power)
- 6.4.2 Pertamina Geothermal Energy
- 6.4.3 Star Energy Geothermal
- 6.4.4 Medco Power Indonesia
- 6.4.5 Canadian Solar Inc.
- 6.4.6 Trina Solar Ltd
- 6.4.7 PT Sumber Energi Sukses Makmur
- 6.4.8 PT Barito Renewables Energy Tbk
- 6.4.9 SEG Solar
- 6.4.10 PT ATW Solar Indonesia
- 6.4.11 Fourth Partner Energy Pvt Ltd
- 6.4.12 Xurya Daya Indonesia
- 6.4.13 TotalEnergies ENEOS
- 6.4.14 ACWA Power
- 6.4.15 Masdar
- 6.4.16 Northstar PLTS
- 6.4.17 Bright PLN Batam
- 6.4.18 PT Supreme Energy
- 6.4.19 PT Geo Dipa Energi
- 6.4.20 PT Sarulla Operations
7 Market Opportunities & Future Outlook
- 7.1 White-space & Unmet-Need Assessment
 农业可再生能源:生质燃料、太阳能发电厂和永续农业实践的全球市场—按应用、产品和地区分類的分析和预测(2025-2035 年)
 2026年全球可再生能源市场报告2026年全球多元能源系统市场报告2026年全球太阳能燃料市场报告
 风电场变电站市场按组件类型、配置类型、连接类型、电压等级、最终用户和安装类型划分,全球预测(2026-2032年)全球节能设备市场:机会与策略展望(至2034年)
 节能微控制器市场分析及预测(至2035年):依类型、产品类型、服务、技术、组件、应用、最终用户、功能、安装类型、解决方案划分
 中国可再生能源:市场占有率分析、产业趋势与统计、成长预测(2026-2031年)新加坡可再生能源:市场占有率分析、产业趋势与统计、成长预测(2026-2031)美国可再生能源:市场份额分析、行业趋势和统计数据以及成长预测(2026-2031 年)