


 |
市场调查报告书
商品编码
1906981
北美休閒车市场:市场占有率分析、产业趋势与统计、成长预测(2026-2031)North America Recreational Vehicle - Market Share Analysis, Industry Trends & Statistics, Growth Forecasts (2026 - 2031) |
||||||
※ 本网页内容可能与最新版本有所差异。详细情况请与我们联繫。
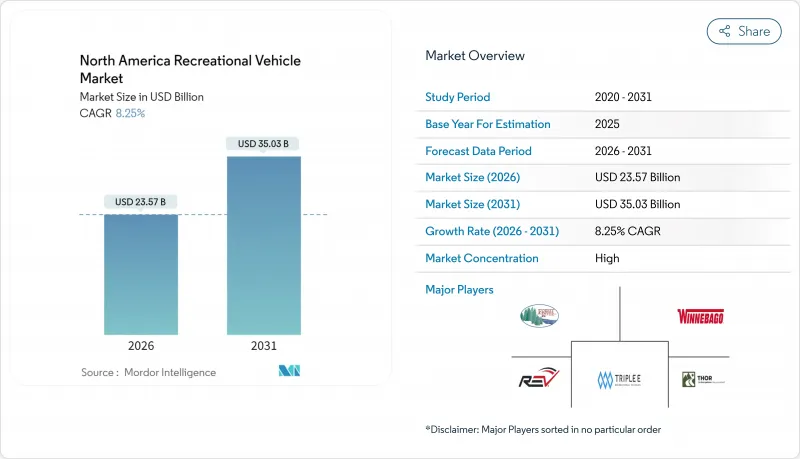
预计到 2025 年,北美休閒车市场价值将达到 217.7 亿美元,到 2026 年将成长至 235.7 亿美元,到 2031 年将成长至 350.3 亿美元,在预测期(2026-2031 年)内复合年增长率为 8.25%。
远距办公的柔软性正在加速房车需求,房车正从週末度假工具转变为实用的长期生活空间,而不断上升的家庭房车拥有率也扩大了消费群。年轻买家数量不断增长,产品设计也朝着更互联、科技感十足的方向发展。随着製造商加大对混合动力汽车动力和电池式电动车的投入,电动驱动系统正蓬勃发展。同时,点对点租赁的同步成长提供了新的使用管道,与拥有房车形成互补,提高了车辆的利用率。儘管宏观经济波动,但主要供应商的寡占格局正在加速创新週期,并缓解供应链衝击。
北美休閒车市场趋势与洞察
电动和混合动力房车车型的成长
纯电动和混合动力传动系统代表了北美休閒车市场正在发生的最具创新性的产品变革。 Thor Industries推出了一款A级混合动力房车,配备140度电池组和汽油增程器,总续航里程可达500英里。这种设计消除了里程焦虑,并符合新的低排放气体法规。电力扭力提升了爬坡性能,更安静的运作也提高了露营舒适度。製造商透过将大容量电池组与车顶太阳能板结合,强调了离讯息能力,使房车停放时也能为住宅提供辅助电源。 Thor自2019年以来在范围1和范围2排放方面取得的减排成果,以及其永续发展理念,增强了该品牌对具有环保意识的买家的吸引力。随着充电基础设施的扩展,电动房车的普及门槛也不断降低。
新冠疫情后国内自驾游旅游增加
即使边境限制放宽,国内公路旅行仍然是国际旅行的主要替代方案。大约有810万美国家庭拥有房车,预计未来五年这一数字将增长至1690万。平均年使用天数将从2021年的20天增加到2025年的30天,显示房车已深度融入人们的生活方式。 50岁以下的年轻消费者是新购屋的主导,这支撑了长期更换需求的持续性。品牌忠诚度很高,超过80%的疫情期间购屋者表示有意再次购买同一品牌,这为主要製造商带来了可预测的重复销售。即使旅游业恢復正常,人们对本地体验和社交距离的休閒的偏好也支撑着持续的需求。
燃油价格波动推高了旅游成本。
2024年美国汽油平均价格将为每加仑3.30美元,比2023年下降20美分。 A级旅居车每行驶6-10英里消耗1加仑汽油,两週的行程可能耗费1000美元的燃油费用,因此旅行计画对汽油价格波动非常敏感。柴油车的价格波动模式则有所不同,使得商用车队的预算编制更加复杂。持续高成本重新激发了消费者对混合动力系统和轻质复合材料的兴趣,这些材料能够提高燃油经济性。电气化是一种结构性解决方案,但由于充电基础设施建设需要大量投资,因此预计其广泛普及还需要数年时间。
细分市场分析
至2025年,拖曳式房车将占北美休閒车市场的63.52%,而旅居车预计将成为北美房车市场的主要成长引擎,年复合成长率将达到12.93%。高阶A型房车拥有媲美住宅的内装、拓展舱以及可减少排放气体并延长续航里程的混合动力传动系统。 B型露营车的目标客群是注重出行便利性和隐密露营体验的都市区白领。 C型房车则强调价格与生活空间的平衡,因此更受家庭用户的青睐。製造商正采用模组化生产方式来满足多样化的需求,并透过在不同车型之间灵活切换来保持规模经济效益。
由于购置成本低廉且皮卡车型普遍普及,拖曳式房车仍保持着市场地位。旅行拖车凭藉其灵活多样的布局和易于维护的特点,在该类别中占据主导地位。第五轮拖曳式房车提供多层布局和住宅,适合季节性旅行(例如候鸟族)。折迭式露营车和皮卡露营车分别迎合了入门预算市场和越野爱好者的需求。这种多功能性使得拖曳式房车的销售量保持强劲,即使越来越多的富裕消费者转向旅居车车。
到2025年,个人用途将占北美休閒车市场的69.48%,这反映了该行业的休閒起源。然而,预计到2031年,商业用途将以9.22%的复合年增长率成长,超过北美休閒车市场的整体成长率。企业正在使用客製化休閒车作为移动指挥中心、临时展示室或远端计划的临时员工住所。医疗系统正在使用自主型诊所来扩大农村地区的医疗覆盖范围。住宿公司正在开发豪华露营地,将豪华单位改造为高端住宿设施并收取高价。
商务旅行和休閒旅游界线的模糊化推动了双用途采购的兴起,使得相关支出既可以归入个人预算,也可以归入商用预算。某些州提供的税收优惠也进一步促进了商用车队的组成。如今,汽车製造商提供符合企业规格的工厂预装办公舱、卫星连接和发电机组。
其他福利:
- Excel格式的市场预测(ME)表
- 3个月的分析师支持
目录
第一章 引言
- 研究假设和市场定义
- 调查范围
第二章调查方法
第三章执行摘要
第四章 市场情势
- 市场概览
- 市场驱动因素
- 电动和混合动力房车车型的成长
- 新冠疫情后国内自驾游旅游增加
- 远距办公的日益普及使得长期房车生活成为可能。
- 透过先进的连结性和物联网技术提升使用者体验
- P2P房车共享平台的扩展
- 州政府对旅居车所有权提供优惠的税收优惠政策奖励措施
- 市场限制
- 燃油价格波动导致差旅成本增加
- 利率上升影响贷款负担能力
- 由于营地容量不足,使用受到限制
- 房车租赁平台的兴起
- 价值/供应链分析
- 监管环境
- 技术展望
- 波特五力模型
- 供应商的议价能力
- 买方/消费者的议价能力
- 新进入者的威胁
- 替代品的威胁
- 竞争对手之间的竞争
第五章 市场规模及成长预测(价值(美元)及销售量(单位))
- 按类型
- 拖曳式房车
- 旅行拖车
- 第五轮拖车
- 折迭式露营拖车
- 卡车露营车
- 旅居车
- A型
- B型
- C型
- 拖曳式房车
- 透过使用
- 对于个人
- 商业的
- 按燃料类型
- 汽油
- 柴油引擎
- 杂交种
- 电池式电动车
- 按销售管道
- 新房车销售
- 二手房车销售
- 按国家/地区
- 美国
- 加拿大
- 北美其他地区
第六章 竞争情势
- 市场集中度
- 策略趋势
- 市占率分析
- 公司简介
- Thor Industries Inc.
- Forest River Inc.
- Winnebago Industries Inc.
- REV Group
- Tiffin Motorhomes Inc.
- Entegra Coach Inc.
- NeXus RV
- Cruiser RV
- Triple E Recreational Vehicles
- Newmar Corporation
- Jayco Inc.
- Airstream Inc.
- Lance Camper Manufacturing Corp.
- Pleasure-Way Industries
- Keystone RV Company
- Coachmen RV
- Grand Design RV
- Roadtrek Inc.
- Fleetwood RV
- Holiday Rambler
第七章 市场机会与未来展望
The North America RV market was valued at USD 21.77 billion in 2025 and estimated to grow from USD 23.57 billion in 2026 to reach USD 35.03 billion by 2031, at a CAGR of 8.25% during the forecast period (2026-2031).
Demand accelerates as remote work flexibility converts RVs from weekend escapes into viable long-term living spaces, while rising household ownership broadens the consumer base. Younger buyers represent a growing share of purchases, nudging product design toward connected, tech-rich floor plans. Electrified drivetrains gather momentum, helped by manufacturer commitments to hybrid and battery-electric models. Parallel growth in peer-to-peer rentals adds an access alternative that complements ownership and increases vehicle utilization. Despite macro-economic swings, the oligopolistic structure of leading suppliers speeds innovation cycles and cushions supply-chain shocks.
North America Recreational Vehicle Market Trends and Insights
Growth in Electrified & Hybrid RV Models
Battery-electric and hybrid powertrains represent the most disruptive product shift underway in the North America recreational vehicle market. Thor Industries unveiled a hybrid Class A coach featuring a 140-kWh battery pack and a gasoline range extender that delivers a 500-mile total range. The design answers range anxiety and qualifies for emerging low-emission regulations. Electric torque improves hill-climbing performance, while silent operation raises campsite comfort. Manufacturers highlight off-grid capability by pairing large battery packs with roof solar arrays, enabling auxiliary power for residential needs when parked. Sustainability messaging aligns with the Scope 1 and 2 emissions cut Thor achieved since 2019, sharpening brand appeal to eco-conscious buyers. As charging infrastructure grows, electric RV ownership barriers continue to fall.
Increased Domestic Road-Trip Tourism Post-COVID
Domestic road travel remains the preferred alternative to international trips even after border restrictions eased. Approximately 8.1 million American households own an RV, and 16.9 million are expected to own an RV in the coming five years. Average annual usage days jumped from 20 in 2021 to 30 in 2025, signaling deeper lifestyle integration. Younger cohorts under 50 now dominate new purchases, reinforcing a long replacement-demand runway. With high brand loyalty, more than 80% of pandemic-era buyers intend to repurchase the same marque, which creates predictable repeat sales for leading OEMs. The shift toward localized experiences and socially distanced recreation underpins persistent demand even as broader tourism normalizes.
Volatile Fuel Prices Increasing Trip Costs
Average U.S. gasoline prices averaged USD 3.30 per gallon in 2024, down 20 cents from 2023. Class A motorhomes consume 1 gallon every 6-10 miles, so a two-week tour can require USD 1,000 in fuel, making travel decisions sensitive to pump swings. Diesel variants face separate volatility patterns that complicate budgeting for commercial fleets. Persistently high costs have revived consumer interest in hybrid drivetrains and lighter composite materials that improve mileage. Electrification provides a structural hedge but will take years to scale due to charging-site investments.
Other drivers and restraints analyzed in the detailed report include:
- Rising Popularity of Remote Work Enabling Long-Term RV Living
- Advanced Connectivity & IoT Enhancing User Experience
- Rising Interest Rates Impacting Financing Affordability
For complete list of drivers and restraints, kindly check the Table Of Contents.
Segment Analysis
Towable RVs held 63.52% of the North American Recreational Vehicle market share in 2025, while Motorhomes are forecast to log a 12.93% CAGR, positioning it as the principal growth engine for the North America RV market. Premium Type A models add residential finishes, slide-outs, and hybrid powertrains that reduce emissions and extend range. Type B camper vans target urban professionals who value maneuverability and stealth camping. Type C units balance price and livable space, widening appeal to families. Manufacturers deploy modular production that flexes between classes, preserving scale advantages while accommodating varied demand.
Towables retain relevance due to lower acquisition costs and the widespread availability of pickup trucks capable of towing. Travel trailers lead the category thanks to versatile floorplans and modest maintenance needs. Fifth-wheels add multi-level layouts and residential appliances suited for seasonal snowbird migration. Folding campers and truck campers serve entry-level budgets and off-road niches, respectively. This diversity keeps towable volume robust even as affluent cohorts shift into motorized products.
Private use captured 69.48% of the North American Recreational Vehicle market share in 2025, reflecting the recreational origins of the sector. Commercial usage, however, is forecast to compound at a 9.22% CAGR through 2031, outpacing the overall North America RV market size. Corporations deploy customized RVs as mobile command centers, pop-up showrooms, or temporary workforce housing on remote projects. Healthcare systems leverage self-contained clinics to expand rural reach. Hospitality firms outfit luxury units for glamping sites that command premium nightly rates.
The blurring of business and leisure travel fuels dual-use purchasing, allowing owners to classify expenses across personal and professional budgets. Tax advantages available in certain states further encourage commercial fleet formation. OEMs now offer factory-installed office pods, satellite connectivity, and generator packages that meet enterprise specifications.
The North America RV Market Report is Segmented by Type (Towable RVs and Motorhomes), Application (Private and Commercial), Fuel Type (Gasoline, Diesel, Hybrid, and Battery-Electric), Sales Channel (New RV Sales and Used RV Sales), and Geography (United States, Canada, and Rest of North America). The Market Forecasts are Provided in Terms of Value (USD) and Volume (Units).
List of Companies Covered in this Report:
- Thor Industries Inc.
- Forest River Inc.
- Winnebago Industries Inc.
- REV Group
- Tiffin Motorhomes Inc.
- Entegra Coach Inc.
- NeXus RV
- Cruiser RV
- Triple E Recreational Vehicles
- Newmar Corporation
- Jayco Inc.
- Airstream Inc.
- Lance Camper Manufacturing Corp.
- Pleasure-Way Industries
- Keystone RV Company
- Coachmen RV
- Grand Design RV
- Roadtrek Inc.
- Fleetwood RV
- Holiday Rambler
Additional Benefits:
- The market estimate (ME) sheet in Excel format
- 3 months of analyst support
TABLE OF CONTENTS
1 Introduction
- 1.1 Study Assumptions and Market Definition
- 1.2 Scope of the Study
2 Research Methodology
3 Executive Summary
4 Market Landscape
- 4.1 Market Overview
- 4.2 Market Drivers
- 4.2.1 Growth In Electrified and Hybrid RV Models
- 4.2.2 Increased Domestic Road-Trip Tourism Post-COVID
- 4.2.3 Rising Popularity Of Remote Work Enabling Long-Term RV Living
- 4.2.4 Advanced Connectivity and IoT Enhancing User Experience
- 4.2.5 Expansion Of RV-Sharing Peer-To-Peer Platforms
- 4.2.6 Favorable State Tax Incentives For Motorhome Ownership
- 4.3 Market Restraints
- 4.3.1 Volatile Fuel Prices Increasing Trip Costs
- 4.3.2 Rising Interest Rates Impacting Financing Affordability
- 4.3.3 Campground Capacity Shortages Limiting Usage
- 4.3.4 Proliferation Of RV Rental Platforms
- 4.4 Value / Supply-Chain Analysis
- 4.5 Regulatory Landscape
- 4.6 Technological Outlook
- 4.7 Porter's Five Forces
- 4.7.1 Bargaining Power of Suppliers
- 4.7.2 Bargaining Power of Buyers/Consumers
- 4.7.3 Threat of New Entrants
- 4.7.4 Threat of Substitute Products
- 4.7.5 Intensity of Competitive Rivalry
5 Market Size and Growth Forecasts (Value (USD) and Volume (Units))
- 5.1 By Type
- 5.1.1 Towable RVs
- 5.1.1.1 Travel Trailers
- 5.1.1.2 Fifth Wheel Trailers
- 5.1.1.3 Folding Camp Trailers
- 5.1.1.4 Truck Campers
- 5.1.2 Motorhomes
- 5.1.2.1 Type A
- 5.1.2.2 Type B
- 5.1.2.3 Type C
- 5.1.1 Towable RVs
- 5.2 By Application
- 5.2.1 Private
- 5.2.2 Commercial
- 5.3 By Fuel Type
- 5.3.1 Gasoline
- 5.3.2 Diesel
- 5.3.3 Hybrid
- 5.3.4 Battery-Electric
- 5.4 By Sales Channel
- 5.4.1 New RV Sales
- 5.4.2 Used RV Sales
- 5.5 By Country
- 5.5.1 United States
- 5.5.2 Canada
- 5.5.3 Rest of North America
6 Competitive Landscape
- 6.1 Market Concentration
- 6.2 Strategic Moves
- 6.3 Market Share Analysis
- 6.4 Company Profiles (includes Global level Overview, Market level overview, Core Segments, Financials as available, Strategic Information, Market Rank/Share for key companies, Products & Services, and Recent Developments)
- 6.4.1 Thor Industries Inc.
- 6.4.2 Forest River Inc.
- 6.4.3 Winnebago Industries Inc.
- 6.4.4 REV Group
- 6.4.5 Tiffin Motorhomes Inc.
- 6.4.6 Entegra Coach Inc.
- 6.4.7 NeXus RV
- 6.4.8 Cruiser RV
- 6.4.9 Triple E Recreational Vehicles
- 6.4.10 Newmar Corporation
- 6.4.11 Jayco Inc.
- 6.4.12 Airstream Inc.
- 6.4.13 Lance Camper Manufacturing Corp.
- 6.4.14 Pleasure-Way Industries
- 6.4.15 Keystone RV Company
- 6.4.16 Coachmen RV
- 6.4.17 Grand Design RV
- 6.4.18 Roadtrek Inc.
- 6.4.19 Fleetwood RV
- 6.4.20 Holiday Rambler
7 Market Opportunities and Future Outlook
- 7.1 Autonomous RVs to transform caravanning experience
- 7.2 Subscription-based RV ownership models
 休閒车市场:2026-2032年全球市场预测(依动力系统、车辆类型、购买方式、总长度、最终用户和销售管道)
 休閒车市场规模、份额和成长分析(按地区划分)-2026-2033年产业预测
 欧洲休閒车:市场占有率分析、产业趋势与统计、成长预测(2026-2031)
 全球休閒车市场:依类型、应用和地区划分 - 市场规模、行业趋势、机会分析和预测(2025-2033 年)
 全球休閒车金融市场休閒车复合板的全球市场。
 全球旅居车和拖挂式房车市场规模(按产品类型、应用、区域范围和预测)
 2025-2029年全球休閒车(RV)租赁市场
 2030 年休閒车市场预测:按车辆类型、燃料类型、价格分布、应用、最终用户和地区进行的全球分析
 休閒车市场机会、成长动力、产业趋势分析与 2025 - 2034 年预测