


 |
市场调查报告书
商品编码
1910601
危险品物流:市场占有率分析、产业趋势与统计、成长预测(2026-2031)Hazardous Goods Logistics - Market Share Analysis, Industry Trends & Statistics, Growth Forecasts (2026 - 2031) |
||||||
※ 本网页内容可能与最新版本有所差异。详细情况请与我们联繫。
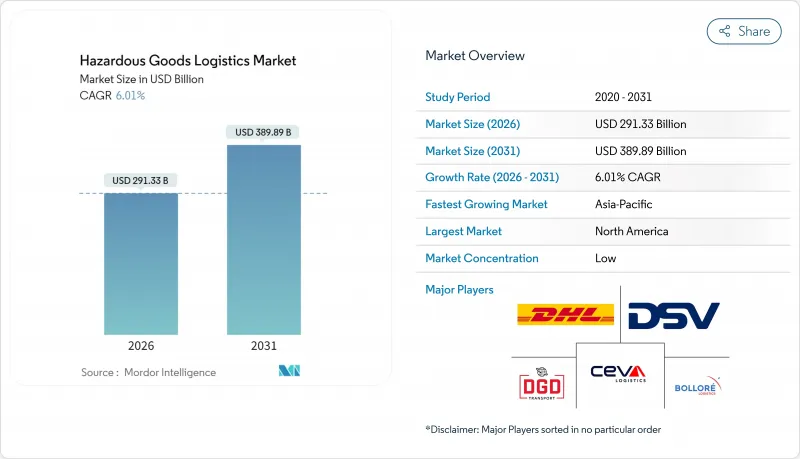
预计危险品物流市场规模将从 2025 年的 2,748 亿美元成长到 2026 年的 2,913.3 亿美元,到 2031 年将达到 3,898.9 亿美元,2026 年至 2031 年的复合年增长率为 6.01%。
这一上升趋势得益于化工和石化产品贸易量的增长、锂离子电池需求的增加,以及对需要在公路、铁路、航空和海运网络中进行特殊处理的温控生技药品的需求。数位化进步,特别是物联网感测器、基于区块链的监管链工具和人工智慧驱动的路线规划,正在提升营运视觉性,同时帮助营运商遵守日益严格的全球安全法规。北美、欧盟和亚太地区的监管机构正在协调包装、标籤和即时数据共用标准,迫使承运商对其车辆进行现代化改造,以符合欧盟6排放标准或采用零排放动力系统和灭火技术。同时,不断上涨的保险费和日益增加的跨境合规成本带来的持续压力,正推动产业整合,大型业者寻求规模经济效益。
全球危险品物流市场趋势与洞察
全球化工和石油产品贸易扩张
全球製造商目前正大量运输需要特定类别包装、通风和隔离的产品,例如特殊化学品、化肥和精炼产品。光是美国在2024年每天就将处理120万吨危险品货物,占所有货运吨英哩的12%。化学品将在2024年占危险品物流市场总收入的36%,显示需要压力罐车和ISO槽式货柜等大型资产。 3类易燃液体和8类腐蚀性物质占铁路运输的大部分,承运商的无事故交付率高达99.99%,从而维护了公众和监管机构的信任。管道、码头和铁路营运商正在加速部署负载感测器,将装载週期缩短至45分钟,从而在不影响安全的前提下提高吞吐量。墨西哥湾沿岸和亚太地区港口吞吐能力的持续扩张,促使托运人将危险液体散货与容器化危险品在附加价值服务协议中结合起来运输。这些因素共同推动了危险品物流市场潜在需求的成长。
日益严格的多模态安全法规与审核
世界各国政府都在加强对违规行为的处罚力度,迫使物流公司投资认证设备和员工训练。美国管线与危险物质安全管理局 (美国) 将于 2025 年起将民事罚款提高至每日 10 万美元以上,铁路业者将被要求根据《促进危险物质运输安全法案》(FAST Act) 向紧急应变机构提交电子编组资料。预计这十年的总成本将达到 1,770 万美元。与联合国示范规则进行跨境协调,每年可为托运人节省 5,000 万至 1.3 亿美元的文书工作成本,同时还能缩短 7 类放射性物质的清关时间。欧洲的《2023 年欧洲运输法规》(ADR 2023) 收紧了对氢氧化四甲基铵和再生塑胶 IBC 的限制,迫使承运人更新货柜内衬和密封垫。主要製造商安装的卫星追踪系统和ATEX认证感测器可确保700个槽式货柜内温度和压力资料的持续记录,从而进一步加强合规性。在监管力道加大的背景下,采用风险管理通讯协定的公司在危险品物流市场中正获得竞争优势。
跨司法管辖区合规的复杂性
各国法规的差异迫使运输公司掌握多种文件系统、训练计画和包装规范。美国虽然遵循联合国标准,但仍保留其独特的罐车规格,增加了外国车队的改装成本。中国的GB 6944-2012分类标准与ADR不同,因此从深圳运送到鹿特丹时需要包装转换。欧洲拟议的PFAS法规可能会扰乱半导体和印刷基板的供应链,因为企业将争相寻找替代化学品。驾驶人危险品运输资格认证时长、文件语言规则和紧急通讯程序方面的差异导致滞期费和缓衝库存增加。因此,物流业者需要设立多个合规团队,这增加了管理成本,并延缓了危险品物流市场新贸易路线的实施。
细分市场分析
运输仍将是核心环节,预计2025年将占危险物品物流市场收入的66.42%。业者使用专用油轮、不锈钢ISO罐、耐压铁路车辆和专用货机,近乎完美的安全性确保1类爆炸物、2类气体和3类易燃物的运输。儘管货运量成长保持稳定,但托运人对点对点运输以外的综合服务需求日益增长。这种转变解释了增值服务领域到2031年7.56%的复合年增长率,反映了对现场贴标、套件组装、清关和法规咨询的需求。例如,医疗保健公司需要具备资料记录功能的端到端低温运输路径,以满足GDP检查的要求。同样,化学品製造商也将SDS更新和多语言危险物品文件外包,以便专注于核心生产营运。物联网感测器包、区块链时间戳记和人工智慧风险评分引擎正被纳入高级合同,以提高可视性和主动异常管理能力。投资建设配备隔离区、防爆温控系统和惰性气体灭火系统的专用仓库,能够实现反应性货物的长期储存。这些综合能力有助于提高客户留存率,并支持危险品物流市场持续的收入成长。
为了法规,仓储和配送服务透过将不相容的物品存放在同一设施内,与运输服务相辅相成。设施配备了光达(LIDAR)机器人码垛机,以防止火花产生。即时气体侦测器会在蒸气浓度接近美国职业安全与健康管理局(OSHA)基准值时启动自动通风系统。区域配送模式缩短了最终交付距离,这对温度敏感型生技药品至关重要。承运商正在利用预测分析技术将库存部署在更靠近需求中心的位置,从而降低浪费风险并缩短前置作业时间。铁路公司正在推广散装货物转运枢纽,将罐车到货与中型散货箱(IBC)的填充连接起来,从而消除冗余的长途道路运输。随着客户追求范围3碳减排目标,物流供应商正在实施生命週期评估仪錶板,以量化从生产到运输过程中的隐含排放。这些指标反映在永续发展报告中,并影响供应商的选择标准。这些趋势共同推动了附加价值服务的成长,确保危险品物流市场持续发展,从简单的运输营运转向获利且数据丰富的解决方案。
区域分析
北美在危险品物流市场占据最大份额,这得益于其330万英里的受监管管道、一体化的铁路网络和先进的紧急应变基础设施。 BNSF和联合太平洋铁路等主要铁路公司保持着99.999%的零事故记录,并秉持着安全投资和预防性维护的文化。美国走廊正在利用统一的标牌代码和共用数据入口网站来加快清关速度,而美国墨走廊则在三方贸易便利化计划下进行优先升级。运输业者正在将自动化预算分配给轨道旁缺陷检测设备、预测性维护人工智慧以及联邦铁路管理局(FRA)核准的煞车健康分析,从而共同减少停机时间。立法者正在推动港口零排放短途运输卡车的津贴,帮助托运人减少碳排放,同时又不影响危险物品运输的监管合规性。
欧洲作为第二大区域,正受到严格的ADR法规和促进低碳多模态走廊的政策的影响。铁路货运业者正充分利用单一欧洲铁路区倡议,该倡议允许跨境机车交换,无需繁琐的官僚程序。鹿特丹和安特卫普等港口提供专用的7类同位素加註设施,而内河航运则使用配备蒸气回收系统的双壳驳船运送3类液体。欧洲绿色交易正在模式转换从公路转向铁路和内河航运,承运商也积极响应,投资建设45英尺可互换船体,以适应两种运输方式。 DSV以143亿欧元(157.8亿美元)收购Schenker,增强了其在90个国家的网路密度,确保为跨国托运人提供更广泛的服务覆盖。营运商也正在试点使用氢燃料干线卡车,以满足拟议的欧VII排放标准,这凸显了欧洲在危险品物流市场作为技术培养箱的作用。
亚太地区正展现出最快的成长速度,这主要得益于中国、东南亚和印度的工业扩张。中国持续推动管理体制现代化,强制要求2类气瓶运输车辆安装远端资讯处理系统,并在危险物品运输路线沿线建造隔离服务区。印度正投资兴建专用货运走廊,以缩短危险物品列车的停靠时间并采用电气化牵引。日本港口正在引进配备防爆电池的自动导引运输车(AGV),以缩短船舶週转时间。製造商正在实现供应链多元化,并将部分电子产品和电池生产转移到越南和泰国,加速了该地区对客製化物流的需求。澳洲和韩国正在升级其化学园区,配备园区消防队数位双胞胎模拟系统,以提升紧急应变能力。这些措施共同增强了亚太地区相关企业的竞争力,并提高了它们对危险品物流市场的总收入贡献。
其他福利:
- Excel格式的市场预测(ME)表
- 3个月的分析师支持
目录
第一章 引言
- 研究假设和市场定义
- 调查范围
第二章调查方法
第三章执行摘要
第四章 市场情势
- 市场概览
- 市场驱动因素
- 全球化工和石油产品贸易扩张
- 加强多模态安全法规与审核
- 危险物品B2B电子商务平台快速成长
- 利用区块链技术的监管链解决方案正引起人们的注意。
- 用于危险品运输的低碳铁路和水路联运走廊
- 工业回收对逆向物流的需求
- 市场限制
- 跨司法管辖区合规的复杂性
- 保险和责任险险保费飙升
- 欧盟6/零排放危险物品运输车辆短缺
- 电子危险品申报系统的网路安全漏洞
- 价值/供应链分析
- 监管环境
- 技术展望
- 相关人员分析(第三方物流业者、报关行、货运代理、顾问)
- 文件和许可证要求
- 设备和配件(IBC吨桶、联合国吨桶、追踪感测器)
- 危险品运输中的风险评估
- 包装知识
- 地缘政治事件对市场的影响
- 波特五力模型
- 供应商的议价能力
- 买方的议价能力
- 新进入者的威胁
- 替代品的威胁
- 竞争对手之间的竞争
第五章 市场规模与成长预测
- 透过服务
- 运输
- 路
- 铁路
- 航空
- 海路和内河航道
- 仓储/配送
- 附加价值服务(贴标籤、套件组装、咨询)
- 运输
- 按目的地
- 国内的
- 国际/跨境
- 按最终用途行业划分
- 石油和天然气
- 化学品/石油化工
- 医疗保健和製药
- 农业/肥料
- 采矿和金属
- 能源与公共产业
- 製造业(电子设备、汽车等)
- 废弃物管理和回收
- 其他的
- 地区
- 北美洲
- 美国
- 加拿大
- 墨西哥
- 南美洲
- 巴西
- 秘鲁
- 智利
- 阿根廷
- 其他南美洲
- 亚太地区
- 印度
- 中国
- 日本
- 澳洲
- 韩国
- 东南亚(新加坡、马来西亚、泰国、印尼、越南、菲律宾)
- 亚太其他地区
- 欧洲
- 英国
- 德国
- 法国
- 西班牙
- 义大利
- 比荷卢经济联盟(比利时、荷兰、卢森堡)
- 北欧国家(丹麦、芬兰、冰岛、挪威、瑞典)
- 其他欧洲地区
- 中东和非洲
- 阿拉伯聯合大公国
- 沙乌地阿拉伯
- 南非
- 奈及利亚
- 其他中东和非洲地区
- 北美洲
第六章 竞争情势
- 市场集中度
- 策略趋势
- 市占率分析
- 公司简介
- Deutsche Post DHL Group
- DSV
- CEVA Logistics
- Bollore Logistics
- DGD Transport
- Toll Group
- YRC Worldwide(USF HazMat)
- Hellmann Worldwide Logistics
- Kuehne+Nagel
- XPO Logistics
- GEODIS
- Rhenus Logistics
- FedEx Custom Critical
- UPS Healthcare/Hazmat
- CH Robinson
- Nippon Express
- Sinotrans
- Kintetsu World Express
- GXO Logistics
- SNCF Geodis Rail Freight*
第七章 市场机会与未来展望
The Hazardous Goods Logistics market is expected to grow from USD 274.80 billion in 2025 to USD 291.33 billion in 2026 and is forecast to reach USD 389.89 billion by 2031 at 6.01% CAGR over 2026-2031.
The upward trajectory is underpinned by expanding chemical and petrochemical trade flows, growing lithium-ion battery volumes, and the need for temperature-controlled biologics that demand specialized handling across road, rail, air, and maritime networks. Progressive digitalization-chiefly IoT sensors, blockchain-enabled chain-of-custody tools, and AI-driven routing-reinforces operational visibility while helping operators navigate tightening global safety mandates. Regulatory bodies in North America, the European Union, and Asia-Pacific are synchronizing standards around packaging, labeling, and real-time data sharing, which is prompting carriers to modernize fleets with Euro VI or zero-emission powertrains and fire-suppression technologies. Meanwhile, persistent pressure from rising insurance premiums and cross-border compliance costs is encouraging consolidation as large providers pursue economies of scale.
Global Hazardous Goods Logistics Market Trends and Insights
Expansion of Global Chemical & Petro-Product Trade
Global manufacturers now move larger volumes of specialty chemicals, fertilizers, and refined products that require class-specific packaging, ventilation, and segregation. The United States alone handled 1.2 million daily hazmat consignments in 2024, equal to 12% of all freight ton-miles . Chemicals represented 36% of overall 2024 revenues inside the Hazardous Goods Logistics market, demonstrating the need for scale assets such as pressurized tank cars and ISO tank containers. Class 3 flammable liquids and Class 8 corrosives dominate rail traffic, and carriers cite a 99.99% incident-free delivery rate that helps maintain public and regulatory confidence. Pipeline, terminal, and rail operators are accelerating load-sensor adoption that cuts loading cycles to 45 minutes, facilitating greater throughput without compromising safety. Capacity upgrades across Gulf Coast and Asia-Pacific ports continue, encouraging shippers to bundle hazardous liquid bulk with containerized dangerous goods inside value-added service contracts. These combined forces collectively expand addressable demand inside the Hazardous Goods Logistics market.
Tightening Multi-Modal Safety Regulations & Audits
Governments are elevating penalties for non-compliance, which compels logistics providers to invest in certified equipment and staff training. PHMSA raised civil fines above USD 100,000 per day in 2025, and railroads must now deliver electronic consist data to first responders under FAST Act mandates, a ten-year outlay estimated at USD 17.7 million. Cross-border harmonization with UN Model Regulations saves shippers USD 50-130 million annually in avoided paperwork while shrinking clearance times for Class 7 radioactive materials. Europe's ADR 2023 added stricter provisions for tetramethylammonium hydroxide and recycled-plastic IBCs, forcing fleets to upgrade container linings and gaskets. Compliance is further supported by satellite tracking and ATEX-certified sensors rolled out by major producers, ensuring continuous temperature and pressure logging on 700 tank containers. As oversight deepens, companies that embed risk-management protocols gain a competitive edge across the Hazardous Goods Logistics market.
Compliance Complexity Across Jurisdictions
A patchwork of national regulations compels carriers to master multiple documentation regimes, training schedules, and packaging codes. The United States aligns with UN standards yet retains country-specific tank car specifications that add retrofit costs for foreign fleets. China's GB 6944-2012 classification diverges from ADR, necessitating packaging conversions when shipments transit from Shenzhen to Rotterdam. Europe's pending PFAS restrictions could interrupt semiconductor and PCB supply chains as firms scramble for substitute chemistries. Varying driver-hazmat endorsement hours, document language rules, and emergency-contact protocols lead to detention fees and higher buffer inventories. Logistics providers therefore maintain parallel compliance teams, which inflates overhead and slows onboarding of new trade lanes inside the Hazardous Goods Logistics market.
Other drivers and restraints analyzed in the detailed report include:
- Rapid Growth of B2B E-Commerce Platforms for Hazmat
- Blockchain-Enabled Chain-of-Custody Solutions Gain Traction
- Escalating Insurance & Liability Premiums
For complete list of drivers and restraints, kindly check the Table Of Contents.
Segment Analysis
Transportation remains the backbone, responsible for 66.42% of 2025 revenues inside the Hazardous Goods Logistics market. Operators run dedicated road tankers, stainless ISO tanks, pressure-rated railcars, and specialized cargo aircraft that together guarantee arrival of Class 1 explosives, Class 2 gases, and Class 3 flammables with near-perfect safety statistics. While transport volume growth is steady, shippers increasingly request integrated services that extend beyond point-to-point haulage. This shift explains why the value-added segment posts a 7.56% CAGR to 2031, reflecting demand for on-site labeling, kit assembly, customs brokerage, and regulatory consulting. Healthcare firms, for example, require end-to-end cold chain pathways, complete with data-logger archiving that satisfies GDP inspections. Chemical producers similarly outsource SDS updates and multi-language hazard documentation, allowing them to focus on core production tasks. IoT sensor packages, blockchain timestamping, and AI risk-scoring engines are embedded into premium contracts, conferring enhanced visibility and proactive exception management. Investment in specialized warehouses equipped with segregated bays, explosion-proof HVAC, and inert-gas fire suppression supports longer dwell times for reactive cargoes. Together, these capabilities broaden customer stickiness and underpin sustained revenue momentum inside the Hazardous Goods Logistics market.
Warehouse and distribution services complement transportation by providing compliant storage for incompatible classes under one roof. Facilities now feature robotic pallet movers fitted with LIDAR to avoid spark generation, while real-time gas detectors trigger automated ventilation when vapor thresholds near OSHA limits. Regional distribution models shorten final-mile distances, which is essential for biologics requiring narrow temperature tolerances. Carriers tap predictive analytics to place inventory closer to demand clusters, thus lowering spoilage risks and shrinking lead times. Railroads promote bulk transload hubs that connect tank-car arrivals to intermediate bulk container refills, eliminating redundant long-haul road legs. As clients pursue scope 3 carbon-reduction targets, logistics providers roll out lifecycle assessment dashboards that quantify embedded emissions from cradle-to-gate. Those metrics feed sustainability reports and influence vendor selection criteria. All these trends collectively sustain growth in value-added offerings, ensuring the Hazardous Goods Logistics market continues to evolve from transactional hauling toward high-margin, data-rich solutions.
The Hazardous Goods Logistics Market is Segmented by Service (Transportation, Warehousing & Distribution and More), by Destination (Domestic and Cross-border/International), by End User Industry (Oil & Gas, Mining & Metals, Energy & Utilities, Manufacturing (Electronics, Automotive, Etc. ), and More), by Geography (North America, South America, Asia Pacific, and More). The Market Forecasts are Provided in Terms of Value (USD).
Geography Analysis
North America constitutes the largest share of the Hazardous Goods Logistics market, benefiting from 3.3 million miles of regulated pipelines, an integrated rail network, and sophisticated emergency-response infrastructure. Major railroads such as BNSF and Union Pacific continue to record 99.999% incident-free hazmat deliveries, underlining a culture of safety investment and proactive maintenance. The US-Canada corridor leverages harmonized placard codes and shared data portals that expedite customs clearance, while the US-Mexico lane earns priority upgrades under trilateral trade facilitation programs. Carriers allocate automation budgets to wayside defect detectors, predictive maintenance AI, and FRA-approved brake-health analytics that collectively reduce downtime. Legislators channel grants toward zero-emission drayage trucks at ports, helping shippers shrink carbon footprints without sacrificing compliant power for hazardous cargo.
Europe follows as the second-largest region, shaped by stringent ADR provisions and a policy push toward low-carbon multimodal corridors. Rail freight operators capitalize on Single European Railway Area initiatives that enable cross-border locomotive shifts without extensive administrative stops. Ports such as Rotterdam and Antwerp offer dedicated Class-7 isotope bunkers, while inland waterways handle Class 3 liquids on double-hulled barges fitted with vapor-recovery units. The European Green Deal incentivizes modal shifts from road to rail and inland waterway, and carriers respond by investing in 45-foot swap bodies compatible with both platforms. DSV's EUR 14.3 billion (USD 15.78 billion) acquisition of Schenker bolsters network density across 90 countries, ensuring broad service coverage for multinational shippers. Operators also trial hydrogen-powered line-haul trucks to comply with Euro VII proposals, demonstrating Europe's role as a technology incubator within the Hazardous Goods Logistics market.
Asia-Pacific delivers the fastest growth pace, propelled by industrial expansion in China, Southeast Asia, and India. China continues modernizing its regulatory regime, rolling out compulsory telematics on Class 2 cylinder trucks and constructing segregated service areas along hazardous routes. India invests in dedicated freight corridors that accommodate hazmat trains with reduced dwell times and electrified traction. Japanese ports host automated guided vehicles equipped with explosion-proof batteries, shortening vessel turnaround. Manufacturers diversify supply bases, redirecting some electronics and battery production toward Vietnam and Thailand, which in turn accelerates regional demand for compliant logistics. Australia and South Korea upgrade chemical parks with on-premise firefighting brigades and digital twin simulations that enhance preparedness. Collectively, these initiatives strengthen the competitive positioning of Asia-Pacific participants, expanding overall revenue contributions to the Hazardous Goods Logistics market.
- Deutsche Post DHL Group
- DSV
- CEVA Logistics
- Bollore Logistics
- DGD Transport
- Toll Group
- YRC Worldwide (USF HazMat)
- Hellmann Worldwide Logistics
- Kuehne + Nagel
- XPO Logistics
- GEODIS
- Rhenus Logistics
- FedEx Custom Critical
- UPS Healthcare / Hazmat
- C.H. Robinson
- Nippon Express
- Sinotrans
- Kintetsu World Express
- GXO Logistics
- SNCF Geodis Rail Freight*
Additional Benefits:
- The market estimate (ME) sheet in Excel format
- 3 months of analyst support
TABLE OF CONTENTS
1 Introduction
- 1.1 Study Assumptions & Market Definition
- 1.2 Scope of the Study
2 Research Methodology
3 Executive Summary
4 Market Landscape
- 4.1 Market Overview
- 4.2 Market Drivers
- 4.2.1 Expansion of global chemical & petro-product trade
- 4.2.2 Tightening multi-modal safety regulations & audits
- 4.2.3 Rapid growth of B2B e-commerce platforms for hazmat
- 4.2.4 Blockchain-enabled chain-of-custody solutions gain traction
- 4.2.5 Low-carbon intermodal rail-water corridors for hazmat shipments
- 4.2.6 Reverse-logistics demand from on-site industrial recycling
- 4.3 Market Restraints
- 4.3.1 Compliance complexity across jurisdictions
- 4.3.2 Escalating insurance & liability premiums
- 4.3.3 Shortage of Euro VI / zero-emission hazmat vehicles
- 4.3.4 Cyber-vulnerabilities in e-Dangerous Goods Declaration systems
- 4.4 Value / Supply-Chain Analysis
- 4.5 Regulatory Landscape
- 4.6 Technological Outlook
- 4.7 Stakeholder Mapping (3PLs, GHA, Carriers, Advisors)
- 4.8 Documentation & Permit Requirements
- 4.9 Equipment & Accessories (IBC, UN drums, track-&-trace sensors)
- 4.10 Risk Assessment in Hazmat Shipments
- 4.11 Packaging Insights
- 4.12 Impact of Geo-Political Events in the Market
- 4.13 Porter's Five Forces
- 4.13.1 Bargaining Power of Suppliers
- 4.13.2 Bargaining Power of Buyers
- 4.13.3 Threat of New Entrants
- 4.13.4 Threat of Substitutes
- 4.13.5 Intensity of Competitive Rivalry
5 Market Size & Growth Forecasts
- 5.1 By Service (Value)
- 5.1.1 Transportation
- 5.1.1.1 Road
- 5.1.1.2 Rail
- 5.1.1.3 Air
- 5.1.1.4 Sea and Inland Waterways
- 5.1.2 Warehousing & Distribution
- 5.1.3 Value-added Services (Labelling, Kitting, Consulting)
- 5.1.1 Transportation
- 5.2 By Destination (Value)
- 5.2.1 Domestic
- 5.2.2 International / Cross-border
- 5.3 By End-use Industry (Value)
- 5.3.1 Oil & Gas
- 5.3.2 Chemicals & Petrochemicals
- 5.3.3 Healthcare & Pharma
- 5.3.4 Agriculture & Fertilizers
- 5.3.5 Mining & Metals
- 5.3.6 Energy & Utilities
- 5.3.7 Manufacturing (Electronics, Automotive, etc.)
- 5.3.8 Waste Management & Recycling
- 5.3.9 Others
- 5.4 Geography (Value)
- 5.4.1 North America
- 5.4.1.1 United States
- 5.4.1.2 Canada
- 5.4.1.3 Mexico
- 5.4.2 South America
- 5.4.2.1 Brazil
- 5.4.2.2 Peru
- 5.4.2.3 Chile
- 5.4.2.4 Argentina
- 5.4.2.5 Rest of South America
- 5.4.3 Asia Pacific
- 5.4.3.1 India
- 5.4.3.2 China
- 5.4.3.3 Japan
- 5.4.3.4 Australia
- 5.4.3.5 South Korea
- 5.4.3.6 South East Asia (Singapore, Malaysia, Thailand, Indonesia, Vietnam, and Philippines)
- 5.4.3.7 Rest of Asia-Pacific
- 5.4.4 Europe
- 5.4.4.1 United Kingdom
- 5.4.4.2 Germany
- 5.4.4.3 France
- 5.4.4.4 Spain
- 5.4.4.5 Italy
- 5.4.4.6 BENELUX (Belgium, Netherlands, and Luxembourg)
- 5.4.4.7 NORDICS (Denmark, Finland, Iceland, Norway, and Sweden)
- 5.4.4.8 Rest of Europe
- 5.4.5 Middle East And Africa
- 5.4.5.1 United Arab of Emirates
- 5.4.5.2 Saudi Arabia
- 5.4.5.3 South Africa
- 5.4.5.4 Nigeria
- 5.4.5.5 Rest of Middle East And Africa
- 5.4.1 North America
6 Competitive Landscape
- 6.1 Market Concentration
- 6.2 Strategic Moves
- 6.3 Market Share Analysis
- 6.4 Company Profiles (includes Global level Overview, Market level overview, Core Segments, Financials as available, Strategic Information, Market Rank/Share, Products & Services, Recent Developments)
- 6.4.1 Deutsche Post DHL Group
- 6.4.2 DSV
- 6.4.3 CEVA Logistics
- 6.4.4 Bollore Logistics
- 6.4.5 DGD Transport
- 6.4.6 Toll Group
- 6.4.7 YRC Worldwide (USF HazMat)
- 6.4.8 Hellmann Worldwide Logistics
- 6.4.9 Kuehne + Nagel
- 6.4.10 XPO Logistics
- 6.4.11 GEODIS
- 6.4.12 Rhenus Logistics
- 6.4.13 FedEx Custom Critical
- 6.4.14 UPS Healthcare / Hazmat
- 6.4.15 C.H. Robinson
- 6.4.16 Nippon Express
- 6.4.17 Sinotrans
- 6.4.18 Kintetsu World Express
- 6.4.19 GXO Logistics
- 6.4.20 SNCF Geodis Rail Freight*
7 Market Opportunities & Future Outlook
 烟雾密度监测仪市场按产品类型、技术、应用、最终用户、连接方式和分销管道划分,全球预测(2026-2032年)
 2026年全球化学测量仪器市场报告
 全球化学浓度监测仪市场按介质、产品、技术、终端用户产业和地区划分-预测至2030年
 全球危险品物流市场2025年危险品物流全球市场报告
 危险品物流市场-全球产业规模、份额、趋势、机会及预测(按服务、应用、产品类型、地区、竞争细分,2020-2030 年)
 化学品浓度检测系统的全球市场:2024年
 危险品物流市场、机会、成长动力、产业趋势分析与预测,2024-2032
 日本的危险物质物流-市场占有率分析、产业趋势/统计、成长预测(2024-2029)