


 |
市场调查报告书
商品编码
1910942
海运:市场占有率分析、产业趋势与统计、成长预测(2026-2031)Maritime Freight Transport - Market Share Analysis, Industry Trends & Statistics, Growth Forecasts (2026 - 2031) |
||||||
※ 本网页内容可能与最新版本有所差异。详细情况请与我们联繫。
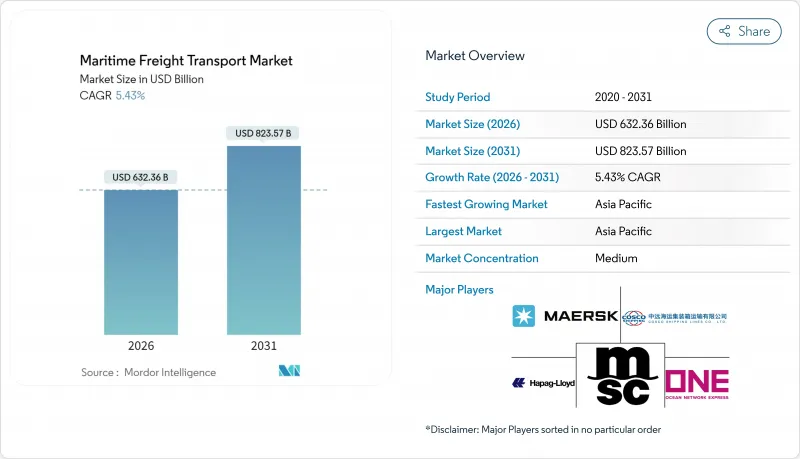
预计到 2025 年,海运市场规模将达到 5997.8 亿美元,预计在预测期(2026-2031 年)内将以 5.43% 的复合年增长率增长,从 2026 年的 6323.6 亿美元增长到 2031 年的 8235.7 亿美元。
持续成长的驱动力来自强劲的全球贸易量、船舶为避开拥塞区和衝突地区而改道导致的吨英里需求增加,以及货物运输加速向南南走廊转移,从而活性化了亚洲内部贸易。遵守欧盟排放权交易体系(EU ETS)将使营运成本在2025年增加206美元/吨,但同时,这将加速船队更新换代,使其达到低碳水平,并增强长期竞争力。重组合作伙伴关係,例如马士基和赫伯罗特之间的「双子座」合作,正在重新调整东西向航线的舱位分配,将班次可靠性目标提高到90%,并增强服务差异化。目前占货柜贸易80%以上的数位化货运平台,正在帮助实现即时运力平衡,将平均停留时间缩短12%,并实现空船航段的商业化。
全球海运市场趋势及展望
南亚内部贸易走廊的快速发展
2023年,东协将超越欧盟,成为中国最大的贸易伙伴,贸易额将达4,688亿美元。 10.5%的成长标誌着亚洲内部货运环线已成为新的成长引擎。亚太自由贸易协定(ACFTA)逐步取消关税将使物流绕过西方转运枢纽,从而简化运输流程。预计2026年完工的平陆运河全长84英里,预计每年可运输8,900万吨货物,并降低供应链成本7.25亿美元。製造业向东南亚的转移将加强港口附近的产业丛集,并扩大对二级门户港口的支线运输需求。由此带来的货物密度将支援对15000标准箱旗舰船舶的大规模投资,这些船舶专为短途运输和高周转率而设计。预计这些趋势将在预测期内为海运市场贡献约1.2个百分点的复合年增长率。
近岸外包推动了对短程支线的需求
2024年,美国和墨西哥之间的跨境卡车运输量创下历史新高,凸显了近岸外包对墨西哥湾沿岸和加勒比海地区支线运输的影响。大型航运公司现在绕过墨西哥湾沿岸小规模的港口,转而与区域性专业公司签订合同,运营枢纽辐射式短途运输服务,从而将门到门运输週期缩短两到四天。 X-Press Feeders与六个欧洲港口签署的「绿色走廊协议」就是一个很好的例子,它展示了营运商如何在实现范围3排放目标的同时,抓住短途远洋运输的成长机会。经营团队表示,降低物流成本是他们最主要的驱动力,其中41%的人优先考虑接近性而非全球规模。不断增长的需求推高了1500-2000标准箱船舶的运转率和日租费率,使海运市场成长率提高了0.8个百分点。
港口基础设施长期存在瓶颈
2025年,随着新加坡和科伦坡港接收大量开往好望角的船舶,壅塞达到顶峰,堆场运转率超过90%,平均泊位等待时间增加三倍。在美国关税生效前,上海港在2025年1月处理了创纪录的500万标准箱,即使新增了18个全自动码头,堆场设施仍然不堪重负。洛杉矶港和长滩港的底盘短缺问题日益严重,而麻六甲海峡则因地缘政治动盪和气候变迁而面临吃水限制。闸口自动化和内陆铁路连接投资不足阻碍了货物运输速度,使海运市场的长期复合年增长率下降了1.1个百分点。
细分市场分析
干散货运输将主导市场,预计2025年将占海运市场份额的28.65%,这主要得益于中国铁矿石和煤炭的需求,其库存量高达1.65亿吨。然而,儘管吨位需求强劲成长,但2025年计画交付的3,600万载重吨新船仍可能导致实际运价(TCE)疲软。为降低下行风险,业者正转向与指数挂钩的租船合约。运力过剩的担忧可能会促使小型船舶提前报废,从而限制特定航线的供应,并缓解运价下行压力。
液散货运输是一股特别显着的成长引擎,预计2031年将维持4.02%的复合年增长率,主要得益于液化天然气(LNG)产量的不断增长和化学品贸易的多元化发展。预计到2025年,现货超大型油轮(VLCC)的每日租金收入将达到51,600美元,将刺激大型能源公司对定期租船的需求。油轮船东正在部署双燃料运输能力以获取绿色高价货物,港口营运商也正在投资低温出口设备,以适应使用氨燃料的船舶。液散货运输的强劲成长动能为海运市场增添了必要的多元化,并能有效缓衝其他货物运输的波动。
区域分析
预计到2025年,亚太地区将占海运市场的37.65%,并在2031年之前以5.02%的复合年增长率持续成长。这主要得益于亚太地区57%的区域内贸易依赖度以及成长来源摆脱对欧美需求週期的依赖。上海的「18个全无人码头」自动化计画将减少起重机作业的波动,并为泊位效率树立新的标竿。预计到2026年,中国的平陆运河年吞吐能力将达到8,900万吨,将消除内陆运输瓶颈,每年节省7.25亿美元。
北美货柜吞吐量将面临前所未有的1%的萎缩,原因是关税调整和2025年10月起实施的301条款课税增加了中国製造船舶的成本。然而,墨西哥的贸易復苏带来了一些抵销效应,近岸外包也促进了墨西哥湾支线服务和内陆铁路的改善。在欧洲,每年100亿欧元(110.3亿美元)的排放权交易体系(ETS)合规成本迫使航运公司重新调整航线优先顺序并重新思考燃料策略。同时,「绿色走廊」试点计画正使欧洲港口成为替代燃料燃料库的先驱。
中东将利用沙乌地阿拉伯45亿美元的港口投资,力争2026年将区域物流收入提升至388亿美元。伊拉克-美索不达米亚走廊(IMEC)将透过铁路和港口一体化,把亚欧之间的运输时间缩短40%,凸显该地区在多极贸易流量中的重要性。南美洲正利用其中立地位,在供应链中断的情况下,促进巴西大豆对华出口。随着连接俄罗斯和奈及利亚的航线开闢了通往金砖国家(BRICS)的农业走廊,非洲的份额也逐渐成长。
其他福利:
- Excel格式的市场预测(ME)表
- 3个月的分析师支持
目录
第一章 引言
- 研究假设和市场定义
- 调查范围
第二章调查方法
第三章执行摘要
第四章 市场情势
- 市场概览
- 市场驱动因素
- 南亚内部贸易走廊的快速发展
- 近岸外包推动了对近岸支线的需求
- 欧盟排放交易体系(EU-ETS)航运排放法规将重塑船队经济格局
- 透过数位化货运平台实现即时运输能力匹配
- 替代燃料可降低长期营运成本。
- 由于苏伊士运河绕行工程和巴拿马运河扩建工程,运输吨英里数增加。
- 市场限制
- 港口基础设施长期存在瓶颈
- 2023-2026年货柜订单积压订单创历史新高,或将导致供应过剩
- 日益严重的海上网路安全威胁
- 通货膨胀导致燃油价格波动
- 价值/供应链分析
- 监管环境
- 技术展望
- 新冠疫情与地缘政治事件的影响
- 波特五力模型
- 买方的议价能力
- 供应商的议价能力
- 新进入者的威胁
- 替代品的威胁
- 竞争对手之间的竞争
第五章 市场规模与成长预测
- 按货物类型
- 货柜货物
- 干燥
- 冷藏
- 干散货
- 液体散货
- 普通货物
- 滚装货物
- 货柜货物
- 按最终用户行业划分
- 电子装置和半导体
- 化学品/石油化工产品
- 食品/饮料
- 製药和医疗保健
- 零售与电子商务
- 其他的
- 按地区
- 北美洲
- 美国
- 加拿大
- 墨西哥
- 南美洲
- 巴西
- 秘鲁
- 智利
- 阿根廷
- 其他南美洲
- 亚太地区
- 印度
- 中国
- 日本
- 澳洲
- 韩国
- 东南亚(新加坡、马来西亚、泰国、印尼、越南、菲律宾)
- 亚太其他地区
- 欧洲
- 英国
- 德国
- 法国
- 西班牙
- 义大利
- 比荷卢经济联盟(比利时、荷兰、卢森堡)
- 北欧国家(丹麦、芬兰、冰岛、挪威、瑞典)
- 其他欧洲地区
- 中东和非洲
- 阿拉伯聯合大公国
- 沙乌地阿拉伯
- 南非
- 奈及利亚
- 其他中东和非洲地区
- 北美洲
第六章 竞争情势
- 市场集中度
- 策略趋势
- 市占率分析
- 公司简介
- Mediterranean Shipping Company(MSC)
- AP Moller-Maersk
- COSCO Shipping Lines
- Hapag-Lloyd
- Ocean Network Express(ONE)
- Evergreen Marine Corp.
- HMM Co., Ltd.
- Yang Ming Marine Transport
- ZIM Integrated Shipping
- Pacific International Lines(PIL)
- SITC International
- X-Press Feeders
- Matson Inc.
- Swire Shipping
- NYK Line
- K Line
- MOL Logistics
- CMA CGM
- Wan Hai Lines
- Emirates Shipping Line
第七章 市场机会与未来展望
The Maritime Freight Transport Market was valued at USD 599.78 billion in 2025 and estimated to grow from USD 632.36 billion in 2026 to reach USD 823.57 billion by 2031, at a CAGR of 5.43% during the forecast period (2026-2031).
Sustained expansion springs from resilient global trade volumes, the rerouting of vessels around congestion and conflict zones that inflates ton-mile demand, and the accelerating shift of cargo toward South-South corridors that intensify intra-Asian flows. Compliance with the EU Emissions Trading System (EU ETS) adds USD 206 per metric ton to operating costs in 2025 but simultaneously accelerates fleet renewal toward low-carbon tonnage, supporting long-run competitiveness. Alliance realignments such as the Gemini Cooperation between Maersk and Hapag-Lloyd recalibrate slot allocation across East-West lanes, raising schedule reliability targets to 90% and sharpening service differentiation. Digital freight platforms that now govern more than 80% of container transactions provide real-time capacity balancing, cut average dwell time by 12%, and help carriers monetize empty repositioning legs.
Global Maritime Freight Transport Market Trends and Insights
Surge in South-South Intra-Asian Trade Corridors
ASEAN surpassed the European Union as China's top trading partner in 2023 at USD 468.8 billion, a 10.5% jump that cements intra-Asian cargo loops as the new growth engine. Progressive tariff eliminations under ACFTA streamline flows that bypass Western transshipment hubs, while China's 84-mile Pinglu Canal slated for 2026 will move 89 million tons annually and slice USD 725 million from supply-chain costs. Manufacturing migration toward Southeast Asia reinforces near-port industrial clusters, amplifying feeder demand to secondary gateways. The resulting cargo density underpins scale investments in 15,000 TEU workhorses optimized for shorter hauls yet higher turn-round frequencies. Collectively, these dynamics contribute an estimated 1.2 percentage-points to the Maritime freight transport market CAGR forecast period.
Near-shoring Drives Short-Sea Feeder Demand
U.S.-Mexico truck crossings hit record levels in 2024, validating near-shoring's spillover into Gulf and Caribbean feeder loops. Mainline carriers now skip smaller Gulf ports, contracting regional specialists for hub-and-spoke shuttles that compress door-to-door cycles by two to four days. X-Press Feeders' pact with six European ports to create green corridors exemplifies operators capturing rising short-sea volumes while satisfying Scope 3 emission objectives. Executives cite logistics cost reduction as the single largest incentive, with 41% prioritizing proximity over global scale. Elevated demand lifts vessel utilization and daily charter rates for 1,500-2,000 TEU ships, translating into a 0.8 percentage-point uptick in the Maritime freight transport market growth trajectory.
Chronic Port-Side Infrastructure Bottlenecks
Congestion peaked in 2025 as Singapore and Colombo absorbed Cape-routed vessels, causing yard utilization to exceed 90% and average berth wait times to triple. Shanghai processed a record 5 million TEU in January 2025 ahead of U.S. tariff enactments, stressing yard equipment even after adding 18 fully automated terminals. Los Angeles and Long Beach struggle with chassis shortages, while the Malacca Strait faces geopolitical disruptions and climate-driven draft limitations. Investment lags in gate automation and hinterland rail links hamper cargo velocity, subtracting 1.1 percentage-points from the Maritime freight transport market's long-run CAGR.
Other drivers and restraints analyzed in the detailed report include:
- EU-ETS on Maritime Emissions Reshapes Fleet Economics
- Digital Freight Platforms Enable Real-Time Capacity Matching
- Oversupply Risk from Record Container-Ship Orderbook 2023-26
For complete list of drivers and restraints, kindly check the Table Of Contents.
Segment Analysis
Dry bulk holds the lion's share, accounting for 28.65% of Maritime freight transport market size in 2025 on the back of China's 165 million-ton iron-ore and coal restocking drive. However, a 36 million dwt delivery slate scheduled for 2025 risks dampening TCE rates despite robust tonnage demand growth. Operators therefore pivot to index-linked charters to mitigate downside exposure. Overcapacity fears spur early scrapping of Handysize vessels, constraining supply in niche routes and moderating rate compression.
Liquid bulk is the standout growth engine, posting a 4.02% CAGR through 2031 as LNG liquefaction volumes scale and chemicals trades diversify. Spot VLCC earnings are forecast at USD 51,600 per day for 2025, stimulating time-charter interest among energy majors. Tanker owners install dual-fuel capability to capture green-premium cargoes, while port operators invest in cryogenic export arms to service ammonia-ready tonnage. The strengthening liquid bulk trajectory adds needed diversity to the Maritime freight transport market, cushioning volatility in other cargo streams.
The Maritime Freight Transport Market Report is Segmented by Cargo Type (Containerized Cargo, Dry Bulk Cargo, Liquid Bulk Cargo, General Cargo, Roll-On/Roll-Off Cargo), End-User Industry (Electronics & Semiconductors, Chemicals & Petrochemicals, Food & Beverage, and More), and Geography (North America, South America, Asia-Pacific, Europe, Middle East and Africa). The Market Forecasts are Provided in Terms of Value (USD).
Geography Analysis
Asia-Pacific commands 37.65% of Maritime freight transport market share in 2025 and is set to expand at a 5.02% CAGR to 2031, buoyed by 57% intra-regional trade dependence that diversifies growth away from Western demand cycles. Shanghai's automation blueprint-18 fully unmanned terminals-cuts crane moves per hour variance and sets new benchmarks for berth productivity. China's Pinglu Canal, capable of handling 89 million tons a year by 2026, will reduce inland transit bottlenecks and save USD 725 million annually.
North America confronts a rare 1% contraction in container throughput as tariff realignments and Section 301 levies raise costs on Chinese-built vessels beginning October 2025. Yet Mexico's trade renaissance offers partial offset, with near-shoring catalyzing Gulf feeder services and inland rail upgrades. Europe faces EUR 10 billion (USD 11.03 billion) annual ETS compliance costs that reprioritize corridor routing and bunker strategies. Simultaneously, green-corridor pilots position European ports as early-adoption nodes for alternative-fuel bunkering.
The Middle East leverages USD 4.5 billion in Saudi port investments to lift regional logistics revenue to USD 38.8 billion by 2026. IMEC promises to shorten Asia-Europe transit times by 40% via integrated rail-port linkages, underscoring the region's role in multipolar trade flows. South America capitalizes on its neutral stance; Brazilian soybean exports to China expand under disrupted supply chains. Africa's share gradually rises as Russia-Nigeria services unlock agricultural corridors for BRICS members.
- Mediterranean Shipping Company (MSC)
- A.P. Moller-Maersk
- COSCO Shipping Lines
- Hapag-Lloyd
- Ocean Network Express (ONE)
- Evergreen Marine Corp.
- HMM Co., Ltd.
- Yang Ming Marine Transport
- ZIM Integrated Shipping
- Pacific International Lines (PIL)
- SITC International
- X-Press Feeders
- Matson Inc.
- Swire Shipping
- NYK Line
- K Line
- MOL Logistics
- CMA CGM
- Wan Hai Lines
- Emirates Shipping Line
Additional Benefits:
- The market estimate (ME) sheet in Excel format
- 3 months of analyst support
TABLE OF CONTENTS
1 Introduction
- 1.1 Study Assumptions & Market Definition
- 1.2 Scope of the Study
2 Research Methodology
3 Executive Summary
4 Market Landscape
- 4.1 Market Overview
- 4.2 Market Drivers
- 4.2.1 Surge in South-South intra-Asian trade corridors
- 4.2.2 Near-shoring drives short-sea feeder demand
- 4.2.3 EU-ETS on maritime emissions reshapes fleet economics
- 4.2.4 Digital freight platforms enable real-time capacity matching
- 4.2.5 Alternative fuels adoption lowers long-term OPEX
- 4.2.6 Suez diversions & Panama expansion boost ton-miles
- 4.3 Market Restraints
- 4.3.1 Chronic port-side infrastructure bottlenecks
- 4.3.2 Oversupply risk from record container-ship orderbook 2023-26
- 4.3.3 Escalating maritime cyber-security threats
- 4.3.4 Inflation-driven bunker price volatility
- 4.4 Value / Supply-Chain Analysis
- 4.5 Regulatory Landscape
- 4.6 Technological Outlook
- 4.7 Impact of COVID-19 and Geo-Political Events
- 4.8 Porters Five Forces
- 4.8.1 Bargaining Power of Buyers
- 4.8.2 Bargaining Power of Suppliers
- 4.8.3 Threat of New Entrants
- 4.8.4 Threat of Substitutes
- 4.8.5 Competitive Rivalry
5 Market Size & Growth Forecasts (Value)
- 5.1 By Cargo Type
- 5.1.1 Containerized Cargo
- 5.1.1.1 Dry
- 5.1.1.2 Reefer
- 5.1.2 Dry Bulk Cargo
- 5.1.3 Liquid Bulk Cargo
- 5.1.4 General Cargo
- 5.1.5 Roll-On/Roll-Off Cargo
- 5.1.1 Containerized Cargo
- 5.2 By End-User Industry
- 5.2.1 Electronics & Semiconductors
- 5.2.2 Chemicals & Petrochemicals
- 5.2.3 Food & Beverage
- 5.2.4 Pharmaceuticals & Healthcare
- 5.2.5 Retail & E-commerce
- 5.2.6 Others
- 5.3 By Geography
- 5.3.1 North America
- 5.3.1.1 United States
- 5.3.1.2 Canada
- 5.3.1.3 Mexico
- 5.3.2 South America
- 5.3.2.1 Brazil
- 5.3.2.2 Peru
- 5.3.2.3 Chile
- 5.3.2.4 Argentina
- 5.3.2.5 Rest of South America
- 5.3.3 Asia-Pacific
- 5.3.3.1 India
- 5.3.3.2 China
- 5.3.3.3 Japan
- 5.3.3.4 Australia
- 5.3.3.5 South Korea
- 5.3.3.6 South East Asia (Singapore, Malaysia, Thailand, Indonesia, Vietnam, and Philippines)
- 5.3.3.7 Rest of Asia-Pacific
- 5.3.4 Europe
- 5.3.4.1 United Kingdom
- 5.3.4.2 Germany
- 5.3.4.3 France
- 5.3.4.4 Spain
- 5.3.4.5 Italy
- 5.3.4.6 BENELUX (Belgium, Netherlands, and Luxembourg)
- 5.3.4.7 NORDICS (Denmark, Finland, Iceland, Norway, and Sweden)
- 5.3.4.8 Rest of Europe
- 5.3.5 Middle East and Africa
- 5.3.5.1 United Arab of Emirates
- 5.3.5.2 Saudi Arabia
- 5.3.5.3 South Africa
- 5.3.5.4 Nigeria
- 5.3.5.5 Rest of Middle East And Africa
- 5.3.1 North America
6 Competitive Landscape
- 6.1 Market Concentration
- 6.2 Strategic Moves
- 6.3 Market Share Analysis
- 6.4 Company Profiles (includes Global level Overview, Market level overview, Core Segments, Financials as available, Strategic Information, Market Rank/Share for key companies, Products & Services, and Recent Developments)
- 6.4.1 Mediterranean Shipping Company (MSC)
- 6.4.2 A.P. Moller-Maersk
- 6.4.3 COSCO Shipping Lines
- 6.4.4 Hapag-Lloyd
- 6.4.5 Ocean Network Express (ONE)
- 6.4.6 Evergreen Marine Corp.
- 6.4.7 HMM Co., Ltd.
- 6.4.8 Yang Ming Marine Transport
- 6.4.9 ZIM Integrated Shipping
- 6.4.10 Pacific International Lines (PIL)
- 6.4.11 SITC International
- 6.4.12 X-Press Feeders
- 6.4.13 Matson Inc.
- 6.4.14 Swire Shipping
- 6.4.15 NYK Line
- 6.4.16 K Line
- 6.4.17 MOL Logistics
- 6.4.18 CMA CGM
- 6.4.19 Wan Hai Lines
- 6.4.20 Emirates Shipping Line
7 Market Opportunities & Future Outlook
- 7.1 White-space & Unmet-Need Assessment


