


 |
市场调查报告书
商品编码
1937352
海运货运代理:市场占有率分析、产业趋势与统计、成长预测(2026-2031)Sea Freight Forwarding - Market Share Analysis, Industry Trends & Statistics, Growth Forecasts (2026 - 2031) |
||||||
※ 本网页内容可能与最新版本有所差异。详细情况请与我们联繫。
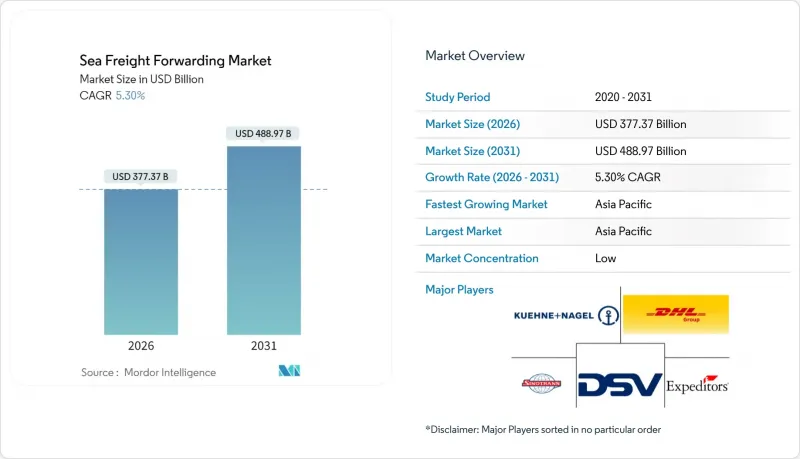
2025年,海运货运代理市场价值为3,583.1亿美元,预计到2031年将达到4,889.7亿美元,而2026年为3,773.7亿美元。
预计在预测期(2026-2031 年)内,复合年增长率将达到 5.30%。
强劲的货柜航运公司收入、向数位化订舱标准的转变以及全球库存策略从准时制转向以防万一,都支撑了这一前景。不断壮大的商船队、新的港口投资以及电子商务推动的货物分散化,为能够保证舱位、速度和可视性的服务供应商创造了更多机会。控制80%货柜航运能力的联盟已宣布2025年生效的新营运结构,进一步加强班次协调和舱位利用率。然而,2024年将有478艘新货柜船投入运营,超过了市场需求,给即期运价带来压力,并赋予托运人更大的议价优势。
全球海运货运代理市场趋势与洞察
2025年至2030年间货柜港吞吐能力快速成长
预计到2024年,中国八大港口的货柜吞吐量将达到2.24亿标准箱,比去年增加7%。其中,上海港的吞吐量将超过5000万标准箱,巩固其作为世界第一大货柜港口的地位。美国主要枢纽港口的吞吐量也不断刷新纪录,洛杉矶港的吞吐量达到1030万标准箱,并投资建造零排放堆场设备。南沙港、长开港和大士港的新大型企划有望重塑航运格局,并加剧货运代理商之间的货运量竞争。同时,船队规模的扩张(仅2024年就将交付478艘船舶)将为托运人提供更多选择,并使货运代理商在运费谈判中采取更积极的立场。
跨境履约网路快速扩张
预计到2027年,全球零售电商销售额将达到8兆美元,将推动小包裹级海运货运量激增。沃尔玛的「港到门」服务已为电商经销商处理了1988个标准箱(TEU),这充分证明了大型零售商自行整合物流的必要性。具备应用程式介面(API)的货运代理可以将来自不同卖家的订单整合到一个统一的拼箱(LCL)解决方案中,从而减少货物滞留时间和清关阻力。
由于国际海事组织 (IMO) 2023 年硫排放法规规定的燃油附加费,货运价格将会波动。
2024年,超低硫燃料油(VLSF)的平均价格为每吨608美元。自2025年起,经欧洲水域的航线将排放权交易体系(ETS)附加税而增加每吨170至210美元的费用。亚洲至美国西岸(USWC)航线的燃油调整係数(BAF)已跃升至每标准箱(FEU)623美元,占总运费的37%。货运代理需要对冲或转嫁这部分附加费,这在竞争激烈的竞标週期中构成了一种微妙的平衡。
细分市场分析
到2025年,整箱货运(FCL)将占海运货运代理市场的60.35%,继续保持其作为製造商主要运输方式的地位,这些製造商因疫情瓶颈而提前囤积库存。预计FCL海运货运代理市场规模将因港口扩容计划和联盟网络重组而扩大。同时,拼箱货运(LCL)虽然规模较小,但由于电经销商依赖拼箱来维持库存,其复合年增长率(CAGR)也达到了4.63%。随着API连接的订舱平台简化货物拼箱和海关预清关流程,拼箱货运的海运货运代理市场份额将逐步提升。
数位化报价工具可在数秒内提供最佳的整箱 (FCL) 与拼箱 (LCL) 决策,引导中型托运人选择每次航程最具成本效益的运输方式。提供 48 小时装箱保证和电子托运人帐单的货运代理商正日益受到直接面向消费者的 B2C 平台的青睐。随着现货指数波动持续,包含燃油价格波动条款和碳排放强度调整的整箱合约机制将影响 2025 年竞标的运费上限,进一步扩大大型业者和小规模仲介之间的定价能力差距。
区域分析
预计到2025年,亚太地区将占全球收入的40.55%,并在2031年之前保持5.02%的区域复合年增长率,这主要得益于中国出口、东南亚的近岸采购以及活跃的区域内贸易。上海港创纪录的5000万标准箱吞吐量以及华南南沙港的扩建,为货运代理商提供了充足的运输能力。
受耐用消费品库存补充的推动,预计到2024年,北美主要港口的进口总量将增加13%,达到2,820万标准箱。与美国和墨西哥之间的近岸外包走廊相关的海运货运代理市场规模正呈扩张趋势,尤其是在汽车、电子和电池供应链领域。
在欧洲,苏伊士运河绕行导致亚洲航线延误10至14天,儘管免收通行费,但货运量仍比尖峰时段下降了57%。欧盟排放交易体系(EU-ETS)和欧盟燃油海运法规强制要求的碳足迹审核,正逐渐成为一项服务差异化优势。
中东和非洲地区正受益于沿岸地区的大型计划和非洲之角走廊的改善,散货和计划货物货运代理预测,风力发电机和炼油厂模组将主导出口包机业务。
南美洲正利用其中立地位吸引多元化贸易。巴拿马运河在2025年1月至5月期间的船舶通行量达到创纪录的1,200艘,巩固了其作为国际门户的地位。
其他福利:
- Excel格式的市场预测(ME)表
- 分析师支持(3个月)
目录
第一章 引言
- 研究假设和市场定义
- 调查范围
第二章调查方法
第三章执行摘要
第四章 市场情势
- 市场概览
- 市场驱动因素
- 2025年至2030年间货柜港吞吐能力快速成长
- 跨境履约网路快速扩张
- 适用于许多航空公司的数位预订平台和API连接
- 扩大电池级原料的近岸外包
- 脱碳政策正在推动对端到端二氧化碳审核物流的需求。
- 透过在全球范围内推广海运保险参数产品来降低货物风险
- 市场限制
- 国际海事组织 (IMO) 2023 年燃油硫含量上限规定导致运费波动。
- 航运公司的垂直整合给独立货运代理商的利润率带来了压力。
- 传统交通管理系统 (TMS) 的网路安全风险
- 运河航线的地缘政治动盪(苏伊士运河和巴拿马运河的限制草案)
- 价值/供应链分析
- 监管环境
- 技术展望
- 对地缘政治因素及疫情影响的回顾
- 票价及附加费趋势分析
- 波特五力模型
- 供应商的议价能力
- 买方的议价能力
- 新进入者的威胁
- 替代品的威胁
- 竞争对手之间的竞争
第五章 市场规模及成长预测(价值,十亿美元)
- 按服务类型
- FCL
- LCL
- 按货物类型
- 干燥
- 冷藏
- 按最终用户行业划分
- 电子和半导体
- 化学品和石油化工
- 食品/饮料
- 製药和医疗保健
- 零售与电子商务
- 其他的
- 按地区
- 北美洲
- 我们
- 加拿大
- 墨西哥
- 南美洲
- 巴西
- 秘鲁
- 智利
- 阿根廷
- 其他南美洲
- 亚太地区
- 印度
- 中国
- 日本
- 澳洲
- 韩国
- 东南亚(新加坡、马来西亚、泰国、印尼、越南、菲律宾)
- 亚太其他地区
- 欧洲
- 英国
- 德国
- 法国
- 西班牙
- 义大利
- 比荷卢经济联盟(比利时、荷兰、卢森堡)
- 北欧国家(丹麦、芬兰、冰岛、挪威、瑞典)
- 其他欧洲地区
- 中东和非洲
- 阿拉伯聯合大公国
- 沙乌地阿拉伯
- 南非
- 奈及利亚
- 其他中东和非洲地区
- 北美洲
第六章 竞争情势
- 市场集中度
- 策略趋势
- 市占率分析
- 公司简介
- Kuehne+Nagel
- DHL Global Forwarding
- Sinotrans
- DSV A/S
- Expeditors International
- CH Robinson Worldwide
- CEVA Logistics
- Kerry Logistics
- Nippon Express
- Hellmann Worldwide Logistics
- Geodis
- Yusen Logistics
- Rhenus Logistics
- UPS Supply Chain Solutions
- Savino Del Bene
- Kintetsu World Express
- LX Pantos
- Ningbo Port Southeast Logistics Group
- Worldwide Logistics Group
- CTS International Logistics
第七章 市场机会与未来展望
The Sea Freight Forwarding Market was valued at USD 358.31 billion in 2025 and estimated to grow from USD 377.37 billion in 2026 to reach USD 488.97 billion by 2031, at a CAGR of 5.30% during the forecast period (2026-2031).
Robust earnings at container lines, the march toward digital booking standards, and a global pivot from just-in-time to just-in-case inventory strategies underpin this outlook. Merchant-fleet capacity additions, fresh port investments, and e-commerce-linked shipment fragmentation are widening the opportunity set for service providers that can guarantee space, speed, and visibility. Alliances controlling 80% of container capacity have announced new operating structures that take effect in 2025, further tightening schedule coordination and slot utilization. Yet the arrival of 478 new boxships in 2024 outpaced demand, pressuring spot rates and handing shippers negotiating leverage.
Global Sea Freight Forwarding Market Trends and Insights
Surge in container-port capacity additions 2025-2030
China's top eight gateways lifted 224 million TEU in 2024, up 7%, while Shanghai crossed 50 million TEU, cementing its rank as the world's busiest container port. Major U.S. hubs also broke throughput records; the Port of Los Angeles hit 10.3 million units and is investing in zero-emission yard gear. New megaprojects at Nansha, Chancay, and Tuas promise to reset sailing patterns, intensifying competition among freight forwarders for volume commitments. Parallel fleet growth-478 deliveries in 2024 alone hands shippers more slot choice, enabling forwarders to bargain harder for rates.
Rapid scaling of cross-border e-commerce fulfillment networks
Global retail e-commerce sales are tracking toward USD 8 trillion by 2027, producing a wave of parcel-sized ocean consignments. Walmart's "port-to-door" service has already cleared 1,988 TEU for marketplace sellers, exemplifying how major retailers are internalizing logistics. Forwarders embracing application-program-interface connectivity can batch disparate seller orders into cohesive Less-than-Container-Load solutions, trimming dwell time and customs friction.
Freight-rate volatility linked to IMO 2023 fuel-sulfur cap surcharges
Very-Low-Sulfur Fuel Oil averaged USD 608 per ton in 2024; ETS levies will add USD 170-210 per ton for voyages touching European waters from 2025. Bunker Adjustment Factors jumped to USD 623 per FEU on Asia-USWC contracts, consuming 37% of all-in rates. Forwarders must hedge or pass through surcharges, a delicate balancing act in competitive bid cycles.
Other drivers and restraints analyzed in the detailed report include:
- Widespread carrier digital booking platforms and API connectivity
- Growing near-shoring of battery-grade raw materials
- Ocean-carrier vertical integration squeezing independent forwarder margins
For complete list of drivers and restraints, kindly check the Table Of Contents.
Segment Analysis
Full-Container-Load shipments secured 60.35% of the sea freight forwarding market in 2025, upholding their status as the workhorse for manufacturers that frontloaded inventory during pandemic bottlenecks. The sea freight forwarding market size for FCL is forecast to climb alongside port-capacity projects and alliance network revamps. Conversely, Less-than-Container-Load, though smaller, benefits from a 4.63% CAGR as e-commerce sellers lean on LCL consolidations to maintain SKU availability. The sea freight forwarding market share of LCL will inch higher as API-linked booking platforms simplify cargo co-loading and customs pre-clearance steps.
Digital quoting tools now surface optimal FCL vs. LCL decisions in seconds, nudging mid-volume shippers toward the most cost-efficient mode per sailing. Consolidators that guarantee 48-hour container stuffing windows and electronic House Bills are attracting B2C platforms that ship direct to consumer. As volatility lingers in spot indexes, FCL contract mechanisms featuring bunker float clauses and carbon-intensity adjustments will shape rate ceilings for 2025 tenders, reinforcing the pricing sophistication gap between scale players and smaller brokers.
The Sea Freight Forwarding Market Report is Segmented by Service Type (Full-Container-Load, Less-Than-Container-Load), Cargo Type (Dry, Reefer), End-User Industry (Electronics & Semiconductors, Chemicals & Petrochemicals, Food & Beverage, Pharmaceuticals & Healthcare, and More), and Geography (North America, South America, Asia-Pacific, Europe, Middle East and Africa). The Market Forecasts are Provided in Terms of Value (USD).
Geography Analysis
Asia-Pacific generated 40.55% of 2025 revenue and posts a regional 5.02% CAGR to 2031, buoyed by Chinese exports, Southeast-Asian near-sourcing, and intense intra-Asian trade. Shanghai's record 50 million TEU milestone and South-China's Nansha expansion give forwarders abundant sailings to fill.
North America saw combined import volumes at its top ports jump 13% to 28.2 million TEU in 2024, aided by restocking in consumer durables AJOT. The sea freight forwarding market size tied to U.S.-Mexico near-shoring corridors is swelling, especially for automotive, electronics, and battery supply chains.
Europe wrestles with Suez detours that add 10-14 days to Asia rotations; traffic is still 57% below peak despite toll breaks. Carbon-footprint auditing, mandated by the EU-ETS and FuelEU Maritime rules, emerges as a service differentiator.
Middle East & Africa benefits from giga-projects across the Gulf and Horn of Africa corridor upgrades. Breakbulk and project forwarders anticipate wind-turbine and refinery modules to dominate outbound charters.
South America leverages its neutrality to court diversification trade; Panama Canal set a 1,200-transit record in the January-May 2025 window, cementing its gateway role.
- Kuehne + Nagel
- DHL Global Forwarding
- Sinotrans
- DSV A/S
- Expeditors International
- C.H. Robinson Worldwide
- CEVA Logistics
- Kerry Logistics
- Nippon Express
- Hellmann Worldwide Logistics
- Geodis
- Yusen Logistics
- Rhenus Logistics
- UPS Supply Chain Solutions
- Savino Del Bene
- Kintetsu World Express
- LX Pantos
- Ningbo Port Southeast Logistics Group
- Worldwide Logistics Group
- CTS International Logistics
Additional Benefits:
- The market estimate (ME) sheet in Excel format
- 3 months of analyst support
TABLE OF CONTENTS
1 Introduction
- 1.1 Study Assumptions and Market Definition
- 1.2 Scope of the Study
2 Research Methodology
3 Executive Summary
4 Market Landscape
- 4.1 Market Overview
- 4.2 Market Drivers
- 4.2.1 Surge in container-port capacity additions 2025-2030
- 4.2.2 Rapid scaling of cross-border e-commerce fulfilment networks
- 4.2.3 Widespread carrier digital booking platforms and API connectivity
- 4.2.4 Growing near-shoring of battery-grade raw-materials
- 4.2.5 Decarbonisation mandates driving demand for end-to-end CO2-audited logistics
- 4.2.6 Global roll-out of maritime-insurance parametric products lowering cargo risk
- 4.3 Market Restraints
- 4.3.1 Freight-rate volatility linked to IMO 2023 fuel-sulphur cap surcharges
- 4.3.2 Ocean-carrier vertical integration squeezing independent forwarder margins
- 4.3.3 Cyber-security exposure of legacy transport-management systems (TMS)
- 4.3.4 Canal-route geopolitical disruptions (Suez, Panama draught limits)
- 4.4 Value / Supply-Chain Analysis
- 4.5 Regulatory Landscape
- 4.6 Technological Outlook
- 4.7 Geopolitical and Pandemic Impact Review
- 4.8 Freight-Rate and Surcharges Trend Analysis
- 4.9 Porter's Five Forces
- 4.9.1 Bargaining Power of Suppliers
- 4.9.2 Bargaining Power of Buyers
- 4.9.3 Threat of New Entrants
- 4.9.4 Threat of Substitutes
- 4.9.5 Competitive Rivalry
5 Market Size and Growth Forecasts (Value, USD Bn)
- 5.1 By Service Type
- 5.1.1 Full-Container-Load (FCL)
- 5.1.2 Less-than-Container-Load (LCL)
- 5.2 By Cargo Type
- 5.2.1 Dry
- 5.2.2 Reefer
- 5.3 By End-User Industry
- 5.3.1 Electronics and Semiconductors
- 5.3.2 Chemicals and Petrochemicals
- 5.3.3 Food and Beverage
- 5.3.4 Pharmaceuticals and Healthcare
- 5.3.5 Retail and E-commerce
- 5.3.6 Others
- 5.4 By Geography
- 5.4.1 North America
- 5.4.1.1 United States
- 5.4.1.2 Canada
- 5.4.1.3 Mexico
- 5.4.2 South America
- 5.4.2.1 Brazil
- 5.4.2.2 Peru
- 5.4.2.3 Chile
- 5.4.2.4 Argentina
- 5.4.2.5 Rest of South America
- 5.4.3 Asia-Pacific
- 5.4.3.1 India
- 5.4.3.2 China
- 5.4.3.3 Japan
- 5.4.3.4 Australia
- 5.4.3.5 South Korea
- 5.4.3.6 South East Asia (Singapore, Malaysia, Thailand, Indonesia, Vietnam, and Philippines)
- 5.4.3.7 Rest of Asia-Pacific
- 5.4.4 Europe
- 5.4.4.1 United Kingdom
- 5.4.4.2 Germany
- 5.4.4.3 France
- 5.4.4.4 Spain
- 5.4.4.5 Italy
- 5.4.4.6 BENELUX (Belgium, Netherlands, and Luxembourg)
- 5.4.4.7 NORDICS (Denmark, Finland, Iceland, Norway, and Sweden)
- 5.4.4.8 Rest of Europe
- 5.4.5 Middle East and Africa
- 5.4.5.1 United Arab of Emirates
- 5.4.5.2 Saudi Arabia
- 5.4.5.3 South Africa
- 5.4.5.4 Nigeria
- 5.4.5.5 Rest of Middle East And Africa
- 5.4.1 North America
6 Competitive Landscape
- 6.1 Market Concentration
- 6.2 Strategic Moves
- 6.3 Market Share Analysis
- 6.4 Company Profiles (includes Global level Overview, Market level overview, Core Segments, Financials as available, Strategic Information, Market Rank/Share for key companies, Products and Services, and Recent Developments)
- 6.4.1 Kuehne + Nagel
- 6.4.2 DHL Global Forwarding
- 6.4.3 Sinotrans
- 6.4.4 DSV A/S
- 6.4.5 Expeditors International
- 6.4.6 C.H. Robinson Worldwide
- 6.4.7 CEVA Logistics
- 6.4.8 Kerry Logistics
- 6.4.9 Nippon Express
- 6.4.10 Hellmann Worldwide Logistics
- 6.4.11 Geodis
- 6.4.12 Yusen Logistics
- 6.4.13 Rhenus Logistics
- 6.4.14 UPS Supply Chain Solutions
- 6.4.15 Savino Del Bene
- 6.4.16 Kintetsu World Express
- 6.4.17 LX Pantos
- 6.4.18 Ningbo Port Southeast Logistics Group
- 6.4.19 Worldwide Logistics Group
- 6.4.20 CTS International Logistics
7 Market Opportunities and Future Outlook
- 7.1 White-space and Unmet-Need Assessment


