


 |
市场调查报告书
商品编码
1911713
北美化肥:市占率分析、产业趋势与统计、成长预测(2026-2031)North America Fertilizers - Market Share Analysis, Industry Trends & Statistics, Growth Forecasts (2026 - 2031) |
||||||
※ 本网页内容可能与最新版本有所差异。详细情况请与我们联繫。
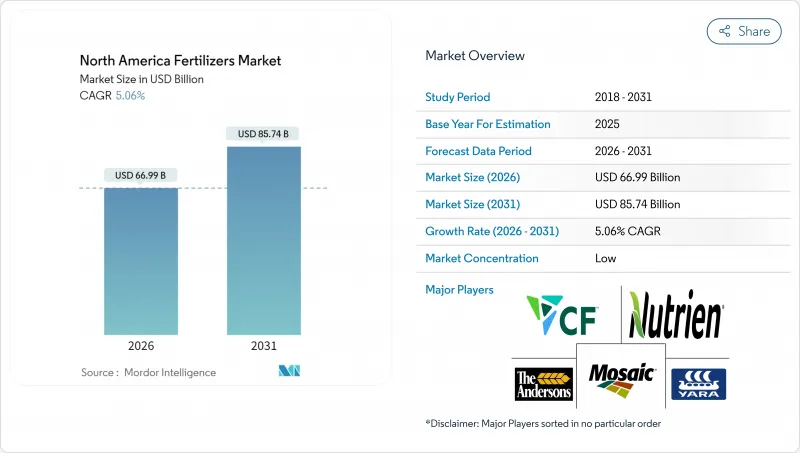
预计北美化肥市场规模将从 2025 年的 637.6 亿美元成长到 2026 年的 669.9 亿美元,到 2031 年将达到 857.4 亿美元,2026 年至 2031 年的复合年增长率为 5.06%。
目前成长动能主要得益于玉米和大豆种植面积的扩大、国内产能的提升以降低进口风险,以及精密农业工具的应用,这些工具提高了约2.7亿英亩农田的养分利用效率。种植者也面临日益严格的环境法规,这些法规倾向于使用包膜性肥料和缓释产品;同时,政府对绿色氨的激励措施也推动了对低碳生产设施的新资本投资。 2021-2022年的运输中断事件后,供应韧性有所提升。然而,物流的改善和货运成本的下降继续支持产品标准化,使进口氯化钾和磷酸盐保持成本竞争力。由于区域土壤特性和作物多样性限制了产品标准化,市场竞争仍然分散。这为专业混合商、农艺服务公司和基于平台的挑战者提供了空间,使他们能够在田间层面客製化解决方案。
北美化肥市场趋势与洞察
美国玉米和大豆种植面积扩大
预计到2026年,玉米和大豆种植面积将达到9,620万英亩。每增加100万面积,大约需要18万吨氮肥。可再生燃料标准和稳定的出口销售支撑了这一增长。新的杂交品种能更有效利用氮肥,但由于面积的扩大,总消费量仍呈现上升趋势。新增面积主要集中在爱荷华州、伊利诺州和内布拉斯加州,这些州依赖管道网路供应低成本的氨。连作玉米需要更高的氮肥施用量,这确保了未来十年的氮肥需求。
向高价值作物专用肥料过渡
加州中央谷地的果蔬种植者已在约280万英亩的土地上施用了特殊肥料。缓释颗粒肥料可减少人工投入,并持续供应营养,从而保护果实的大小、色泽和货架期。水溶性肥料系列可与灌溉系统搭配使用,优化酪梨和柑橘园的施肥管理。有机肥料的高价有助于抵销这些投入品的成本,其价格比标准肥料高出40%至60%。佛罗里达州的柑橘种植者也采用类似的策略,透过强化微量元素施用方案来应对病害压力。
天然气价格波动推高了氮气成本。
每吨氨的生产大约消耗2800万至3000万英热单位的天然气,因此化肥成本与亨利港天然气期货价格曾达到每百万英热单位9.50美元的高峰。季节性需求高峰和管道运输限制加剧了价格波动。製造商尽可能地对冲燃料成本,但农民在早春用气高峰期也会感受到更高的价格。
细分市场分析
截至2025年,单一成分肥料将占北美肥料市场份额的79.90%。这一数字表明,大型粮食生产商仍然依赖可靠且低成本的单一营养素产品。氮肥在该类别中占据主导地位,因为大平原和中西部地区的玉米和小麦面积推动了稳定的需求。复合肥料将多种营养素结合在单一颗粒肥料中,其成长率最高,到2031年将达到6.72%的复合年增长率,因为特种作物生产商更倾向于使用均衡配方,以减少施肥次数并降低人事费用。
钾肥市场也将维持6.72%的成长,这主要得益于加拿大钾矿的开采以及钾肥在抗旱和提高作物品质方面作用的广泛认可。所有三种肥料类型的包膜肥需求都在快速增长,因为聚合物和硫磺层可以减少养分流失,帮助农民满足水质法规的要求。随着严格的土壤检测发现锌、锰和硼的缺乏,在单一配方肥料中添加微量元素的做法也变得越来越普遍。这种转变,即采用变数施肥系统将适当的肥料施用于适当的区域,反映了高产量需要比传统的「固定剂量」NPK施肥方法更精准的养分管理。
到2025年,传统肥料将占总销售额的82.60%,因为注重成本的粮食生产商将继续采用久经考验的成熟肥料。特种肥料领域将以5.55%的复合年增长率引领产业,因为水质法规和不断上涨的劳动力成本使得单次施肥方案比多次施肥方案更受欢迎。高价值水果、坚果和蔬菜种植者愿意为缓释包衣肥料支付溢价,因为这种肥料可以提高养分利用率并保护产品品质。
液态肥料因其可透过输液设备实现高流动性而日益普及,操作人员可以随时调整施肥量。这些包膜技术的研发需要大量资金和专业知识,从而保护现有生产商免受仿冒者的侵害。目前,研发工作主要集中在开发更强的包膜和更稳定的释放曲线,以确保养分输送能每日满足作物需求。
北美肥料市场报告按类型(复合肥与单质肥)、形态(常规肥与特种肥)、施用方法(土壤施用、叶面喷布等)、作物类型(田间作物、园艺作物等)和地区(美国、加拿大、墨西哥等)进行细分。市场预测以价值(美元)和数量(公吨)为单位。
其他福利:
- Excel格式的市场预测(ME)表
- 3个月的分析师支持
目录
第一章 引言
- 研究假设和市场定义
- 调查范围
- 调查方法
第二章 报告
第三章执行摘要
第四章 主要产业趋势
- 主要农作物种植面积
- 田间作物
- 园艺作物
- 平均施肥量
- 微量营养素
- 田间作物
- 园艺作物
- 关键营养素
- 田间作物
- 园艺作物
- 次要大量营养元素
- 田间作物
- 园艺作物
- 微量营养素
- 具有灌溉设施的农田
- 法律规范
- 价值炼和通路分析
- 市场驱动因素
- 美国玉米和大豆种植面积扩大
- 向高价值作物专用肥料过渡
- 联邦和州政府对绿色氨厂的奖励措施
- 强制生质燃料燃料导致氮需求增加
- 再生农业推动了微量元素肥料的发展
- 需要水溶性氮磷钾肥的受控环境农业
- 市场限制
- 天然气价格波动推高了氮气成本。
- 加强对五大湖流域磷酸盐径流的监管
- 农场内对动物粪便进行养分循环利用,可以减少合成肥料的需求。
- 圣劳伦斯航道钾肥运输瓶颈
第五章 市场规模和成长预测(价值和数量)
- 类型
- 合成的
- 单身的
- 微量营养素
- 锌
- 锰
- 铜
- 铁
- 硼
- 钼
- 其他微量营养素
- 氮
- 尿素
- 硝酸铵
- 无水氨
- 其他氮
- 磷酸盐
- 磷酸一铵(MAP)
- 磷酸二铵(DAP)
- 单过磷酸钙(SSP)
- 三重过磷酸钙(TSP)
- 其他磷酸盐
- 钾
- 氯化钾(MoP)
- 硫酸钾(SoP)
- 其他钾
- 次要大量营养素
- 钙
- 镁
- 硫
- 微量营养素
- 按形式
- 传统的
- 特殊肥料
- 控制释放肥料(CRF)
- 缓效性肥料(SRF)
- 液体肥料
- 水溶性
- 透过应用方法
- 土壤
- 叶面喷布
- 施肥和灌溉
- 按作物类型
- 田间作物
- 园艺作物
- 草坪和观赏植物
- 按国家/地区
- 美国
- 加拿大
- 墨西哥
- 北美其他地区
第六章 竞争情势
- 关键策略倡议
- 市占率分析
- 公司概况
- 公司简介
- CF Industries Holdings, Inc.
- Nutrien Ltd.
- The Mosaic Company
- Yara International ASA
- The Andersons Inc.
- Haifa Chemicals Ltd.
- OCI Nitrogen
- Intrepid Potash, Inc.
- JR Simplot Company
- Koch Fertilizer LLC
- Wilbur-Ellis Company LLC
- K+S Aktiengesellschaft
- EuroChem Group AG
- IFFCO Canada Enterprise Ltd.
- ICL Group Ltd.
第七章:CEO们需要思考的关键策略问题
The North America fertilizers market is expected to grow from USD 63.76 billion in 2025 to USD 66.99 billion in 2026 and is forecast to reach USD 85.74 billion by 2031 at 5.06% CAGR over 2026-2031.
Current momentum is driven by expanding corn and soybean acreage, domestic capacity additions that reduce import risk, and precision agriculture tools that push nutrient use efficiency across roughly 270 million cultivated acres. Producers also face tightening environmental rules that reward coated and controlled-release products, while government incentives for green ammonia encourage fresh capital investment in low-carbon production assets. Supply resilience has improved after the 2021-2022 transport disruptions. However, logistics upgrades and freight cost declines continue to support the standardization of products, keeping imported potash and phosphates cost-competitive. Competitive intensity remains fragmented because regional soil variability and crop diversity limit product standardization. This opens space for specialty blenders, agronomy service firms, and platform-based challengers that tailor solutions at the field level.
North America Fertilizers Market Trends and Insights
Expansion of United States corn-and-soy acreage
Corn and soybean plantings are anticipated to reach 96.2 million acres by 2026. Each extra million acres calls for about 180,000 metric tons of nitrogen fertilizer. Growth is tied to renewable fuel standards and steady export sales. Although new hybrids use nitrogen more efficiently, the larger footprint keeps total consumption on an upward path. Most new acres sit in Iowa, Illinois, and Nebraska, where pipeline networks carry low-cost ammonia. When corn follows corn, fields need heavier nitrogen programs, which secures demand for the rest of the decade.
Shift toward specialty fertilizers for high-value crops
Fruit, nut, and vegetable growers in California's Central Valley have already adopted specialty products on roughly 2.8 million acres. Controlled-release granules cut labor and deliver steady nutrition that protects fruit size, color, and shelf life. Water-soluble lines work with fertigation systems that fine-tune feeding in avocado and citrus orchards. Organic premiums help offset the higher price of these inputs, which often run 40 to 60% above standard grades. Florida citrus growers employ the same strategy to fight disease pressure with intensive micronutrient programs.
Volatile natural-gas prices are inflating nitrogen costs
Ammonia production uses roughly 28 to 30 MMBtu of natural gas for every metric ton, so fertilizer costs rise and fall with Henry Hub futures that peaked at USD 9.50 per MMBtu during the 2024 winter heating season. Seasonal demand surges and pipeline constraints amplify the volatility. Manufacturers hedge fuel costs where possible, yet farmers still see higher prices in spring when usage spikes.
Other drivers and restraints analyzed in the detailed report include:
- Federal and state incentives for green-ammonia plants
- Biofuel blending mandates boosting nitrogen demand
- Stricter regulations on phosphate runoff in the Great Lakes basin
For complete list of drivers and restraints, kindly check the Table Of Contents.
Segment Analysis
Straight fertilizers accounted for 79.90% of North America fertilizers market share in 2025, a figure indicating that large-scale grain growers continue to rely on single nutrient products for dependable, low-cost coverage. Nitrogen grades dominate this group because the acres of corn and wheat across the Great Plains and Midwest drive steady demand. Complex blends, which combine several nutrients into one prill, post the fastest 6.72% CAGR through 2031, as specialty-crop growers favor balanced mixes that reduce application passes and lower labor costs.
Potassic grades match that 6.72% pace owing to Canada's potash mines and a wider appreciation of potassium's role in drought defense and quality gains. Coated versions of all three fertilizer types are gaining popularity rapidly because polymer and sulfur layers help curb nutrient losses and enable farms to meet water quality regulations. Precision soil tests flag growing gaps in zinc, manganese, and boron, so micronutrient add-ons within straight formulations are becoming more common. Variable rate rigs then drop the right product in the right zone, a shift that reflects an era when higher yields demand far more targeted nutrition than the old "blanket" NPK approach.
Conventional fertilizer accounted for 82.60% of revenue in 2025, as cost conscious grain producers stick with proven workhorses. The specialty fertilizer segment, is pacing the field with an 5.55% CAGR, driven by water-quality mandates and rising labor costs that favor single shot programs over multiple trips. Growers in high value fruit, nut, and vegetable sectors willingly pay premiums when slow-release coatings boost nutrient use efficiency and protect product quality.
Liquids also gain ground because they flow through injection equipment that lets operators tweak rates on the fly. Building those coatings requires significant capital and expertise, which shields established manufacturers from quick copycats. Most research now focuses on developing tougher shells and steadier release curves, ensuring that nutrient supply matches crop demand on a daily basis.
The North America Fertilizers Market Report is Segmented by Type (Complex and Straight), by Form (Conventional and Specialty), by Application Mode (Soil, Foliar, and More), by Crop Type (Field Crops, Horticultural Crops, and More), and by Geography (United States, Canada, Mexico, and More). The Market Forecasts are Provided in Terms of Value (USD) and Volume (Metric Tons).
List of Companies Covered in this Report:
- CF Industries Holdings, Inc.
- Nutrien Ltd.
- The Mosaic Company
- Yara International ASA
- The Andersons Inc.
- Haifa Chemicals Ltd.
- OCI Nitrogen
- Intrepid Potash, Inc.
- J. R. Simplot Company
- Koch Fertilizer LLC
- Wilbur-Ellis Company LLC
- K+S Aktiengesellschaft
- EuroChem Group AG
- IFFCO Canada Enterprise Ltd.
- ICL Group Ltd.
Additional Benefits:
- The market estimate (ME) sheet in Excel format
- 3 months of analyst support
TABLE OF CONTENTS
1 INTRODUCTION
- 1.1 Study Assumptions and Market Definition
- 1.2 Scope of the Study
- 1.3 Research Methodology
2 REPORT OFFERS
3 EXECUTIVE SUMMARY
4 KEY INDUSTRY TRENDS
- 4.1 Acreage of Major Crop Types
- 4.1.1 Field Crops
- 4.1.2 Horticultural Crops
- 4.2 Average Nutrient Application Rates
- 4.2.1 Micronutrients
- 4.2.1.1 Field Crops
- 4.2.1.2 Horticultural Crops
- 4.2.2 Primary Nutrients
- 4.2.2.1 Field Crops
- 4.2.2.2 Horticultural Crops
- 4.2.3 Secondary Macronutrients
- 4.2.3.1 Field Crops
- 4.2.3.2 Horticultural Crops
- 4.2.1 Micronutrients
- 4.3 Agricultural Land Equipped For Irrigation
- 4.4 Regulatory Framework
- 4.5 Value Chain and Distribution Channel Analysis
- 4.6 Market Drivers
- 4.6.1 Expansion of U.S. corn-and-soy acreage
- 4.6.2 Shift toward specialty fertilizers for high-value crops
- 4.6.3 Federal and state incentives for green-ammonia plants
- 4.6.4 Biofuel blending mandates boosting nitrogen demand
- 4.6.5 Regenerative farming driving micronutrient blends
- 4.6.6 Controlled-environment agriculture requiring water-soluble NPK
- 4.7 Market Restraints
- 4.7.1 Volatile natural-gas prices inflating nitrogen costs
- 4.7.2 Stricter regulations on phosphate runoff in the Great Lakes basin
- 4.7.3 On-farm manure nutrient recycling curbing synthetic demand
- 4.7.4 Potash logistics bottlenecks via St. Lawrence Seaway
5 MARKET SIZE AND GROWTH FORECASTS (VALUE AND VOLUME)
- 5.1 Type
- 5.1.1 Complex
- 5.1.2 Straight
- 5.1.2.1 Micronutrients
- 5.1.2.1.1 Zinc
- 5.1.2.1.2 Manganese
- 5.1.2.1.3 Copper
- 5.1.2.1.4 Iron
- 5.1.2.1.5 Boron
- 5.1.2.1.6 Molybdenum
- 5.1.2.1.7 Other Micronutrient
- 5.1.2.2 Nitrogenous
- 5.1.2.2.1 Urea
- 5.1.2.2.2 Ammonium Nitrate
- 5.1.2.2.3 Anhydrous Ammonia
- 5.1.2.2.4 Other Nitrogenous
- 5.1.2.3 Phosphatic
- 5.1.2.3.1 Monoammonium Phosphate (MAP)
- 5.1.2.3.2 Diammonium Phosphate (DAP)
- 5.1.2.3.3 Single Super Phosphate (SSP)
- 5.1.2.3.4 Triple Super Phosphate (TSP)
- 5.1.2.3.5 Other Phosphatic
- 5.1.2.4 Potassic
- 5.1.2.4.1 Muriate of Potash (MoP)
- 5.1.2.4.2 Sulfate of Potash (SoP)
- 5.1.2.4.3 Other Potassic
- 5.1.2.5 Secondary Macronutrients
- 5.1.2.5.1 Calcium
- 5.1.2.5.2 Magnesium
- 5.1.2.5.3 Sulfur
- 5.1.2.1 Micronutrients
- 5.2 By Form
- 5.2.1 Conventional
- 5.2.2 Specialty
- 5.2.2.1 Controlled Release Fertilizer (CRF)
- 5.2.2.2 Slow Release Fertilizer (SRF)
- 5.2.2.3 Liquid Fertilizers
- 5.2.2.4 Water-Soluble
- 5.3 By Application Mode
- 5.3.1 Soil
- 5.3.2 Foliar
- 5.3.3 Fertigation
- 5.4 By Crop Type
- 5.4.1 Field Crops
- 5.4.2 Horticultural Crops
- 5.4.3 Turf and Ornamental
- 5.5 By Country
- 5.5.1 United States
- 5.5.2 Canada
- 5.5.3 Mexico
- 5.5.4 Rest of North America
6 COMPETITIVE LANDSCAPE
- 6.1 Key Strategic Moves
- 6.2 Market Share Analysis
- 6.3 Company Landscape
- 6.4 Company Profiles (Includes Global Overview, Market Overview, Core Segments, Financials, Strategic Information, Market Rank/Share, Products and Services, and Recent Developments)
- 6.4.1 CF Industries Holdings, Inc.
- 6.4.2 Nutrien Ltd.
- 6.4.3 The Mosaic Company
- 6.4.4 Yara International ASA
- 6.4.5 The Andersons Inc.
- 6.4.6 Haifa Chemicals Ltd.
- 6.4.7 OCI Nitrogen
- 6.4.8 Intrepid Potash, Inc.
- 6.4.9 J. R. Simplot Company
- 6.4.10 Koch Fertilizer LLC
- 6.4.11 Wilbur-Ellis Company LLC
- 6.4.12 K+S Aktiengesellschaft
- 6.4.13 EuroChem Group AG
- 6.4.14 IFFCO Canada Enterprise Ltd.
- 6.4.15 ICL Group Ltd.
7 KEY STRATEGIC QUESTIONS FOR FERTILIZER CEOS
 缓释肥料市场:2026-2032年全球市场预测(以包膜类型、作物类型、释放週期、养分类型、施用方法、最终用途和销售管道)
 2026年全球生物炭肥料市场报告几丁质肥料市场:2026-2032年全球市场预测(按应用、类型、原料、配方和分销管道划分)肥料包膜市场:2026-2032年全球市场预测(以包膜化学、释放机制、包膜养分类型、外形规格、製造流程、最终用途及通路划分)化肥市场:2026-2032年全球市场预测(依产品类型、作物类型、包装、施用方法、最终用户和分销管道划分)复合肥料市场:按产品类型、作物类型、物理形态和应用分類的全球市场预测,2026-2032年
 海藻土壤改良剂市场预测至 2034 年—按产品类型、海藻种类、形态、应用、养殖方法、通路和地区进行全球分析。藻类肥料市场:2026-2032年全球市场预测(依原料、产品类型、通路及应用划分)
 全球缓释肥料市场规模、份额、趋势和成长分析报告(2026-2034)全球肥料造粒助剂市场规模、份额、趋势和成长分析报告(2026-2034年)