


 |
市场调查报告书
商品编码
1937273
汽车租赁:市场占有率分析、产业趋势与统计、成长预测(2026-2031)Car Rental - Market Share Analysis, Industry Trends & Statistics, Growth Forecasts (2026 - 2031) |
||||||
※ 本网页内容可能与最新版本有所差异。详细情况请与我们联繫。
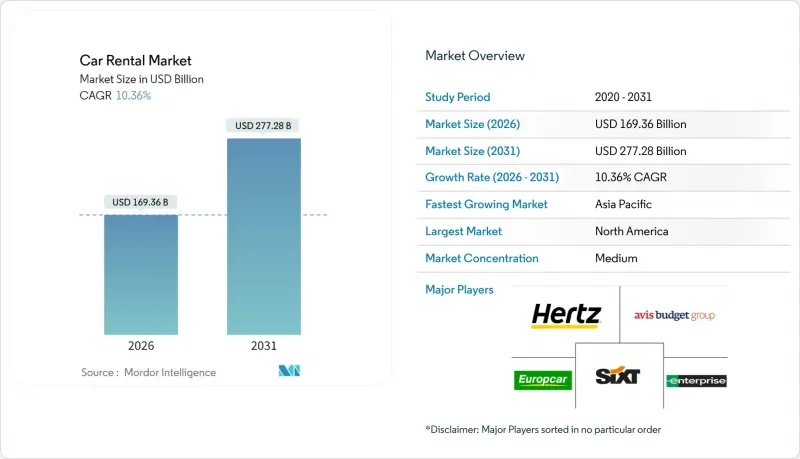
2025年汽车租赁市场价值1534.7亿美元,预计到2031年将达到2772.8亿美元,高于2026年的1693.6亿美元。
预计在预测期(2026-2031 年)内,复合年增长率将达到 10.36%。
这一成长轨迹表明,市场已从疫情引发的低迷中稳步復苏。新兴经济体可支配收入的成长、机场基础设施的持续扩张以及数位化预订管道的普及,都在推动持续的需求。营运商正利用动态定价引擎,结合航班到达、高速公路拥塞和当地活动等数据,来促进收入成长。曾经被视为次要参与者的点对点平台,如今正加强安全保障和忠诚度奖励,以吸引更多房东加入其生态系统。儘管车辆电气化仍不均衡,但企业永续性措施正稳步推动低排放车型的采购,即便一些老牌企业出现了高额减记。
全球汽车租赁市场趋势与洞察
疫情后休閒旅游业迅速復苏
休閒旅客数量已超过新冠疫情前的峰值,美国运输安全局的安检数量同比增幅不到十分之一,欧洲机场也出现了类似的增长。更高的客座率直接转化为更高的租车柜檯吞吐量,尤其是在週末,混合办公模式允许旅客停留更长时间。旅客倾向于提前预订并延长租车期限,这为以每日利用率目标为导向的营运商带来了更高的单笔交易收入。 「Breezea」旅行模式将商务和休閒结合,由于高阶主管增加了私人旅游日,平均租车期限也随之延长。公司会议的常态化推高了工作日的需求密度,使车队负责人能够更平衡地分配一週的车辆资源。儘管车队运力增加,但美国运通全球商务旅游预测,到2025年,美国每日租车价格仍将小幅上涨,价格韧性仍显着。
线上和行动预订平台的渗透率不断提高
随着数位化管道重塑客户获取方式,Avis Budget Group 的云端原生定价系统能够快速为忠诚会员量身打造专属优惠。行动应用简化了办理入住流程,促进了保险提升销售,并支援一键延时,从而缩短了柜檯等待时间。流畅的支付流程鼓励交叉销售道路救援系统和通行费套餐,提高了辅助服务的使用率。在部分城市,Uber 用户现在可以直接透过 Uber 应用程式预订 Turo 车辆,实现了两个平台的无缝整合。此举以极低的成本将数百万月有效用户引入 Turo 租车管道。预测分析收集点选流和航班数据,优化城市间的需求曲线,使营运商能够在需求高峰到来之前重新调整库存。
共乘和汽车共享替代方案的兴起
随着基于应用程式的叫车服务在地面交通支出中主导,Uber 和 Lyft 等平台主导城市交通,传统租车业务正在衰落。叫车服务因其价格透明、无现金支付以及「礼宾司机」服务对饱受交通拥堵和停车难题困扰的城市游客的吸引力而日益流行。P2P平台正在形成新的竞争格局。这些模式规避了机场特许经营费,因此可以收取更低的标价。传统业者正透过设立优先登机通道和白牌合作关係来应对,以期重夺在城市中心的市场份额。然而,都市区日租车业务仍面临着来自按需出行方式的结构性压力。
细分市场分析
截至2025年,线下平台占据了汽车租赁市场54.12%的份额。同时,预计线上平台在预测期(2026-2031年)内将以10.42%的强劲复合年增长率成长。这种格局的变化正在削弱传统实体门市的影响力,但矛盾的是,它也促使一些中型品牌拓展其全球业务。对于会员而言,便利性显而易见:预先填写的个人资料和安全的行动钥匙让客户可以完全绕过柜檯,简化流程。此外,推播通知功能可告知客户航班延误状况,方便客户轻鬆调整取车时间,进而提升整体满意度。在智慧型手机普及率较低的地区,线下实体店体验仍然发挥作用,但由于人员配备和设施成本较高,预订成本也较高。
Digital Traffic 正在加强与航空公司应用程式、饭店平台和第三方线上旅行社的合作,以推动旅游方案的交叉销售。这种整合降低了获客成本,并透过配套服务开闢了新的收入来源。此外,这些交易产生的数据资源为车队负责人提供了预测城际需求的洞察,从而实现车辆的及时调度并减少閒置天数。因此,在租车行业中,那些采用 API 优先策略的营运商在利用率指标方面显着优于竞争对手。
根据体验式旅游趋势,预计到2025年,休閒旅客将占汽车租赁市场55.68%的份额,并在预测期(2026-2031年)内维持10.45%的复合年增长率。规划多城市自驾游的家庭重视车辆的自由度和行李的柔软性,而这些正是团体旅行所缺乏的。疫情期间推出的非接触式取车方式因其便利性而备受欢迎,乘客可以避免拥挤的接驳巴士,直接从行李提取处前往停车场。高燃油效率和宽敞的货物空间也是休閒旅客关注的重点,推动了跨界车型的销售。
商务旅行量正在恢復到2019年的水平,混合办公模式让员工有更多带薪休假时间,从而延长了平均租期。这种商务与休閒结合的模式支撑了工作日和週末的需求,使收入曲线趋于平缓。具备整合排放报告功能的可程式设计企业帐户有助于吸引註重永续性发展的公司,即使商务旅行量趋于平稳,也能增强需求的韧性。
区域分析
到2025年,北美将占据全球租车市场35.02%的份额,反映出该地区成熟的旅行基础设施和强大的汽车拥有文化。 Avis Budget Group在2023年实现了120亿美元的营收,主要得益于机场客流量的復苏和忠诚度计画续订率的提高。其动态定价引擎利用航班延误资料来捕捉最后一刻的预订需求。虽然在缺乏充电基础设施的乡村州际公路沿线地区,电动车的普及率仍然有限,但纽约和洛杉矶等城市中心已开始强制要求低排放车辆。儘管在以共乘平台为主导的都市区走廊地带竞争日益激烈,但租车仍然是单程州际旅行的主要交通方式。
预计亚太地区在预测期(2026-2031年)将以10.62%的复合年增长率成长。中产阶级日益增长的旅行需求、落地签政策以及强劲的航空座位成长正在推动市场发展。 Enterprise Mobility正积极拓展其网络,计划于2024年在泰国开设10分店,目前在日本拥有97个服务点。印尼、越南和印度的入境旅游人数均实现了两位数成长,由于公共运输能力紧张,游客纷纷转向自驾游。中国电动车製造商正透过与租赁公司合作,以折扣价提供电动跨界车,进军旅游市场,以低成本的方式提升国际品牌知名度。
欧洲是一个成熟但竞争异常激烈的市场。 SIXT与Stellantis签订的多年期25万辆汽车供应合同,在半导体短缺的情况下确保了供应,并推进了该公司的电气化蓝图。阿姆斯特丹计划于2025年设立零排放区,促使营运商为电动车预留高价值停车位。欧洲大陆内部边境的开放扩大了跨境汽车租赁业务,但道路收费系统的差异使车辆追踪变得复杂。 Europcar重返美国市场,并在亚特兰大和达拉斯设立基地,显示其对跨大西洋业务的兴趣重燃。同时,拉丁美洲和中东地区受益于高速公路网络的改善以及沙乌地阿拉伯「2030愿景」等旅游推广活动的推动,但货币波动和进口限制要求企业灵活配置资金。
其他福利:
- Excel格式的市场预测(ME)表
- 分析师支持(3个月)
目录
第一章 引言
- 研究假设和市场定义
- 调查范围
第二章调查方法
第三章执行摘要
第四章 市场情势
- 市场概览
- 市场驱动因素
- 疫情后休閒旅游业迅速復苏
- 线上和行动预订平台的渗透率不断提高
- 廉价航空的扩张创造了多模态需求。
- 企业ESG政策加速电动租车车队的普及
- 利用数据驱动的动态定价工具提高运转率
- 新兴市场机场基础设施升级
- 市场限制
- 叫车和共享汽车等出行方式越来越普遍。
- 快速的电动车技术迭代週期增加了残值风险
- 机场收费给营运商利润率带来压力。
- 都市区内燃机车辆的上限
- 价值/供应链分析
- 监管环境
- 技术展望
- 波特五力模型
- 新进入者的威胁
- 买方的议价能力
- 供应商的议价能力
- 替代品的威胁
- 竞争对手之间的竞争
第五章 市场规模及成长预测(金额)
- 透过预约方式
- 离线
- 在线的
- 透过使用
- 休閒
- 商业
- 最终用户
- 自驾游个人
- 专车接送服务
- 企业车队订阅
- P2P租赁
- 按车辆类型
- 紧凑型/经济型轿车
- 小型车和中型车
- 标准尺寸和全尺寸汽车
- SUV 和 MPV
- 豪华/高级汽车
- 按租赁期限
- 短期
- 中期
- 长期
- 按地区
- 北美洲
- 我们
- 加拿大
- 北美其他地区
- 南美洲
- 巴西
- 阿根廷
- 南美洲其他地区
- 欧洲
- 德国
- 英国
- 法国
- 西班牙
- 义大利
- 俄罗斯
- 其他欧洲
- 亚太地区
- 中国
- 印度
- 日本
- 韩国
- 亚太其他地区
- 中东和非洲
- 阿拉伯聯合大公国
- 沙乌地阿拉伯
- 土耳其
- 埃及
- 南非
- 其他中东和非洲地区
- 北美洲
第六章 竞争情势
- 市场集中度
- 策略趋势
- 市占率分析
- 公司简介
- Avis Budget Group Inc.
- Hertz Global Holdings Inc.
- Enterprise Holdings Inc.
- Europcar Mobility Group
- Sixt SE
- Localiza Rent a Car SA
- ALD Automotive
- Beijing CAR Inc.(CAR Inc.)
- GIG Car Share
- Lyft Rental
- Uber Rentals
- Silvercar by Audi
- Getaround
- Zoomcar
- Ola Drive
- Fast Rent A Car
- Bettercar Rental
- TT Car Transit
- Renault Eurodrive
- Shenzhen Supreme Car Rental Co., Ltd.
第七章 市场机会与未来展望
The Car Rental Market was valued at USD 153.47 billion in 2025 and estimated to grow from USD 169.36 billion in 2026 to reach USD 277.28 billion by 2031, at a CAGR of 10.36% during the forecast period (2026-2031).
This trajectory confirms the sector's decisive rebound from its pandemic trough. Rising disposable income in emerging economies, continued airport infrastructure upgrades, and wider access to digital booking channels are steering sustained demand. Operators are capturing incremental revenue by matching dynamic pricing engines with data on flight arrivals, highway congestion, and local events. Peer-to-peer platforms, once considered fringe, have doubled down on safety guarantees and loyalty perks, drawing new hosts into the ecosystem. Fleet electrification remains uneven, yet corporate sustainability mandates have ensured steady procurement of low-emission models despite headline-grabbing write-downs at some incumbents.
Global Car Rental Market Trends and Insights
Rapid Rebound Of Post-Pandemic Leisure Travel
Leisure passenger volumes have eclipsed pre-covid peaks, with U.S. Transportation Security Administration screenings up less than one-tenth year over year and mirrored surges seen at European airports. Higher seat factors translate directly into stronger rental counter throughput, particularly on weekends when hybrid work allows extended stays. Travelers are booking earlier and keeping cars longer, a pattern that lifts revenue per transaction for operators employing day-based utilization targets. Bleisure trips lengthen average rental duration as executives tack on personal days. Normalizing corporate meetings add weekday demand density, allowing fleet planners to deploy assets more evenly through the week. Price resilience remains evident, with American Express Global Business Travel forecasting U.S. daily rates to inch up slightly across 2025 despite rising fleet capacity.
Growing Penetration Of Online And Mobile Booking Platforms
As digital channels redefine customer acquisition, Avis Budget Group's cloud-native pricing system swiftly tailors offers for its loyalty members. Mobile apps streamline check-in, upsell insurance, and permit mid-trip extensions with one tap, shrinking counter dwell time. Seamless payment flows encourage cross-selling roadside assistance, toll packages, and lifting attachment rates. Uber riders in select cities can now reserve Turo vehicles directly through the Uber app, seamlessly integrating the two platforms. This move channels millions of monthly active users into Turo's rental funnel, all at a marginal cost. Predictive analytics harvests clickstream and flight data to refine city-pair demand curves, allowing operators to rebalance inventory before peak surges hit.
Popularity Of Ride-Hailing And Car-Sharing Substitutes
App-based rides are taking the lead in ground transport spending, with platforms like Uber and Lyft dominating urban travel, marking a decline for traditional rentals. Fare transparency, cashless payment, and driver-as-concierge appeal to city visitors reluctant to navigate traffic and parking. Peer-to-peer platforms layer another competitive vector: These models dodge airport concession fees, allowing lower headline prices. Traditional operators have responded with fast-pass pick-up lanes and entering white-label partnerships to regain relevance in downtown corridors. Nonetheless, urban day rentals continue to face structural pressure from on-demand alternatives.
Other drivers and restraints analyzed in the detailed report include:
- Expansion Of Low-Cost Airlines Creating Multi-Modal Travel Demand
- Corporate ESG Mandates Accelerating Adoption Of EV Rental Fleets
- Rising Residual-Value Risk Amid Rapid EV Technology Cycles
For complete list of drivers and restraints, kindly check the Table Of Contents.
Segment Analysis
In 2025, offline platforms commanded a 54.12% share of the car rental market. Meanwhile, online platforms are projected to experience a robust growth rate of 10.42% CAGR during the forecast period (2026-2031). This evolving landscape has diminished the prominence of traditional brick-and-mortar counters, yet paradoxically broadened the global reach of even mid-tier brands. The convenience is palpable for loyalty members: pre-populated profiles and secure mobile keys allow them to bypass counters entirely, streamlining their experience. Moreover, with push notifications alerting them to flight delays, customers can effortlessly adjust pick-up times, enhancing overall satisfaction. While offline walk-ups still play a role in areas with limited smartphone access, they grapple with higher booking costs due to staffing and facility expenses.
Digital traffic is increasingly converging with airline applications, hotel platforms, and third-party online travel agencies, now cross-selling mobility options. This integration reduces customer acquisition costs and paves the way for additional revenue through bundled services like insurance and GPS add-ons. Furthermore, the data reservoirs generated from these transactions provide fleet planners with foresight into city-pair demands, enabling timely fleet transfers and reducing idle days. As a result, operators adopting API-first strategies have significantly outpaced their competitors in utilization metrics within the car rental sector.
Based on experiential tourism trends, leisure travelers generated a 55.68% share of the car rental market in 2025 and will sustain a 10.45% CAGR during the forecast period (2026-2031). Families designing multi-stop road vacations prize vehicle control and luggage flexibility unavailable on group tours. Contactless delivery options introduced during the pandemic remain popular as they let renters proceed directly from baggage claim to parking bay, avoiding crowded shuttle buses. Higher fuel efficiency and spacious cargo areas rank at the top of leisure renters' preference lists, directing procurement toward crossover models.
Business travel is regaining 2019 trip counts, as the average length of rental has increased due to hybrid work policies that allow employees to add personal days. This blend of business and leisure supports weekday and weekend utilization, smoothing the revenue curve. Programmable corporate accounts that bundle emissions reporting help operators attract sustainability-minded firms, reinforcing demand resilience even if corporate trip volumes plateau.
The Car Rental Market Report is Segmented by Booking Mode (Offline and Online), Application (Leisure and Business), End User (Self-Drive Individual and More), Vehicle Type (Mini & Economy Cars, Compact & Intermediate Cars, and More), Rental Length (Short-Term, Medium-Term, and Long-Term), and Geography. The Market Forecasts are Provided in Terms of Value (USD).
Geography Analysis
North America comprises a 35.02% share in the car rental market in 2025, reflecting mature travel infrastructure and a high vehicle ownership culture. Avis Budget Group posted USD 12 billion in 2023 sales as airport passenger flows regained momentum and loyalty program re-enrollments climbed. Dynamic pricing engines exploited flight disruption data to capitalize on last-minute bookings. Electric vehicle uptake remains tempered by charging deserts along rural interstates, yet corporate clients have begun mandating low-emission classes for city centers such as New York and Los Angeles. Competitive intensity is elevated in urban corridors where ride-hailing platforms maintain a stronghold, though rentals still dominate one-way interstate journeys.
Asia-Pacific is forecast to grow with a 10.62% CAGR during the forecast period (2026-2031). Rising middle-class travel, visa-on-arrival schemes, and vigorous airline seat growth underpin market momentum. Enterprise Mobility opened ten Thai branches in 2024 and now operates ninety-seven Japanese sites, illustrating aggressive network build-out. Indonesia, Vietnam, and India report double-digit inbound tourism growth, straining public transit capacity and directing visitors toward self-drive solutions. Chinese EV makers enter the tourist segment by offering discounted electric crossovers via rental partnerships, creating a low-cost path to overseas brand exposure.
Europe remains a sophisticated yet fiercely competitive arena. SIXT's multi-year deal for 250000 Stellantis vehicles secures supply amid chip shortages and advances its electrification roadmap. Amsterdam introduces zero-emission zones in 2025, prompting operators to reserve high-value parking slots for electric fleets. Cross-border rentals flourish on the continent's open internal borders, though differing road toll regimes complicate fleet tracking. Europcar's re-entry into the United States with Atlanta and Dallas outlets signals renewed transatlantic ambitions. Elsewhere, Latin America and the Middle East benefit from improving highway networks and inbound events such as Saudi Arabia's Vision 2030 tourism push, yet currency volatility and import restrictions require agile capital allocation.
- Avis Budget Group Inc.
- Hertz Global Holdings Inc.
- Enterprise Holdings Inc.
- Europcar Mobility Group
- Sixt SE
- Localiza Rent a Car S.A.
- ALD Automotive
- Beijing CAR Inc. (CAR Inc.)
- GIG Car Share
- Lyft Rental
- Uber Rentals
- Silvercar by Audi
- Getaround
- Zoomcar
- Ola Drive
- Fast Rent A Car
- Bettercar Rental
- TT Car Transit
- Renault Eurodrive
- Shenzhen Supreme Car Rental Co., Ltd.
Additional Benefits:
- The market estimate (ME) sheet in Excel format
- 3 months of analyst support
TABLE OF CONTENTS
1 Introduction
- 1.1 Study Assumptions & Market Definition
- 1.2 Scope of the Study
2 Research Methodology
3 Executive Summary
4 Market Landscape
- 4.1 Market Overview
- 4.2 Market Drivers
- 4.2.1 Rapid Rebound Of Post-Pandemic Leisure Travel
- 4.2.2 Growing Penetration Of Online And Mobile Booking Platforms
- 4.2.3 Expansion Of Low-Cost Airlines Creating Multi-Modal Travel Demand
- 4.2.4 Corporate Esg Mandates Accelerating Adoption Of Ev Rental Fleets
- 4.2.5 Data-Driven Dynamic Pricing Tools Boosting Utilisation Rates
- 4.2.6 Airport Infrastructure Upgrades In Emerging Markets
- 4.3 Market Restraints
- 4.3.1 Popularity Of Ride-Hailing And Car-Sharing Substitutes
- 4.3.2 Rising Residual-Value Risk Amid Rapid Ev Technology Cycles
- 4.3.3 Airport Concession Fees Squeezing Operator Margins
- 4.3.4 Regulatory Caps On Ice Vehicles In Urban Cores
- 4.4 Value / Supply-Chain Analysis
- 4.5 Regulatory Landscape
- 4.6 Technological Outlook
- 4.7 Porter's Five Forces
- 4.7.1 Threat of New Entrants
- 4.7.2 Bargaining Power of Buyers
- 4.7.3 Bargaining Power of Suppliers
- 4.7.4 Threat of Substitutes
- 4.7.5 Competitive Rivalry
5 Market Size & Growth Forecasts (Value (USD))
- 5.1 By Booking Mode
- 5.1.1 Offline
- 5.1.2 Online
- 5.2 By Application
- 5.2.1 Leisure
- 5.2.2 Business
- 5.3 By End User
- 5.3.1 Self-Drive Individual
- 5.3.2 Chauffeur-Drive
- 5.3.3 Corporate Fleet Subscription
- 5.3.4 Peer-to-Peer Rental
- 5.4 By Vehicle Type
- 5.4.1 Mini & Economy Cars
- 5.4.2 Compact & Intermediate Cars
- 5.4.3 Standard & Full-Size Cars
- 5.4.4 SUVs & MPVs
- 5.4.5 Luxury / Premium Cars
- 5.5 By Rental Length
- 5.5.1 Short-Term
- 5.5.2 Medium-Term
- 5.5.3 Long-Term
- 5.6 By Geography
- 5.6.1 North America
- 5.6.1.1 United States
- 5.6.1.2 Canada
- 5.6.1.3 Rest of North America
- 5.6.2 South America
- 5.6.2.1 Brazil
- 5.6.2.2 Argentina
- 5.6.2.3 Rest of South America
- 5.6.3 Europe
- 5.6.3.1 Germany
- 5.6.3.2 United Kingdom
- 5.6.3.3 France
- 5.6.3.4 Spain
- 5.6.3.5 Italy
- 5.6.3.6 Russia
- 5.6.3.7 Rest of Europe
- 5.6.4 Asia-Pacific
- 5.6.4.1 China
- 5.6.4.2 India
- 5.6.4.3 Japan
- 5.6.4.4 South Korea
- 5.6.4.5 Rest of Asia-Pacific
- 5.6.5 Middle East and Africa
- 5.6.5.1 United Arab Emirates
- 5.6.5.2 Saudi Arabia
- 5.6.5.3 Turkey
- 5.6.5.4 Egypt
- 5.6.5.5 South Africa
- 5.6.5.6 Rest of Middle East and Africa
- 5.6.1 North America
6 Competitive Landscape
- 6.1 Market Concentration
- 6.2 Strategic Moves
- 6.3 Market Share Analysis
- 6.4 Company Profiles (includes Global Level Overview, Market Level Overview, Core Segments, Financials as Available, Strategic Information, Market Rank/Share for Key Companies, Products and Services, SWOT Analysis, and Recent Developments)
- 6.4.1 Avis Budget Group Inc.
- 6.4.2 Hertz Global Holdings Inc.
- 6.4.3 Enterprise Holdings Inc.
- 6.4.4 Europcar Mobility Group
- 6.4.5 Sixt SE
- 6.4.6 Localiza Rent a Car S.A.
- 6.4.7 ALD Automotive
- 6.4.8 Beijing CAR Inc. (CAR Inc.)
- 6.4.9 GIG Car Share
- 6.4.10 Lyft Rental
- 6.4.11 Uber Rentals
- 6.4.12 Silvercar by Audi
- 6.4.13 Getaround
- 6.4.14 Zoomcar
- 6.4.15 Ola Drive
- 6.4.16 Fast Rent A Car
- 6.4.17 Bettercar Rental
- 6.4.18 TT Car Transit
- 6.4.19 Renault Eurodrive
- 6.4.20 Shenzhen Supreme Car Rental Co., Ltd.
7 Market Opportunities & Future Outlook
- 7.1 White-Space Analysis & Unmet Needs
 租车市场:2026年至2032年全球市场预测(依租赁期限、燃料类型、服务功能、用户层、车辆类型及预订方式划分)汽车租赁市场:2026-2032年全球市场预测(依租赁期限、驱动方式、车辆等级、车辆类型、销售管道及客户类型划分)
 2026年全球自驾汽车租赁市场报告2026年全球乘用车租赁市场报告2026年全球汽车租赁市场报告
 租车及租赁市场规模、份额、成长率及全球产业分析:按类型、应用和地区分類的洞察,2026-2034 年预测租车及租赁市场:2026年至2032年全球预测(依车辆类型、型号、租赁时长、动力系统、应用领域、最终用户及预订模式划分)
 2026-2030年全球汽车租赁市场
 汽车租赁市场分析及预测(至2035年):依类型、产品类型、服务、技术、最终用户、部署类型、用途、模式及功能划分
 欧洲中中型卡车租赁:市场份额分析、行业趋势和统计数据、成长预测(2026-2031)