


 |
市场调查报告书
商品编码
1940588
撒哈拉以南非洲汽车市场:市场份额分析、行业趋势和统计数据、成长预测(2026-2031 年)Sub-Saharan Africa Automotive - Market Share Analysis, Industry Trends & Statistics, Growth Forecasts (2026 - 2031) |
||||||
※ 本网页内容可能与最新版本有所差异。详细情况请与我们联繫。
预计到 2026 年,撒哈拉以南非洲汽车市值将达到 235.2 亿美元,高于 2025 年的 224.5 亿美元。
预计到 2031 年将达到 297 亿美元,2026 年至 2031 年的复合年增长率为 4.77%。
儘管货币波动和基础设施不足,但加速的都市化、共乘汽车的激增以及政府对本地组装的激励措施共同维持了市场成长势头。衣索比亚和南非的电气化倡议显示市场需求结构趋于多元化,但由于柴油物流和服务网络的完善,柴油平台仍占据主导地位。平行输入活动持续抑制授权经销商的销售,但结构化的车队融资计画正在推动共享汽车营运商购买新车。在非洲大陆自由贸易协定(AfCFTA)关税减让的推动下,原始设备製造商(OEM)与本地组装的策略合作正在加强区域供应链整合。
撒哈拉以南非洲汽车市场趋势与洞察
中产阶级收入成长与都市化
随着都市区以每年4.1%的速度成长,购买力正向经销商网路、融资管道和售后服务更为集中的大都会圈转移。尼日利亚、肯亚和加纳的中等收入家庭正在寻找价格适中的车型,加剧了中国和印度汽车製造商之间的竞争。紧凑型SUV和掀背车因其在拥堵道路上的灵活性而备受欢迎,而城郊消费者则依赖于二手车供应,这主要得益于都市区不断增长的旧车置换需求。贷款机构也倾向于选择就业集中的地区,在人口超过百万的都市区,汽车贷款产品的供应量是农村地区的五倍之多。疲软的该地货币降低了进口车的购买力,而与采矿业相关的工资上涨则在一定程度上抵消了价格压力,并维持了市场需求。
共享出行平台的激增正在加速车辆更新换代。
来自 Moove 等供应商提供的结构化车队融资方案,使叫车司机能够绕过传统的信用审核障碍,从而提振撒哈拉以南非洲汽车市场的多年基准需求。叫车每天运作8-12 小时,大约是私家车队的运转率,因此更新週期缩短至三到四年。这种可预测的周期使汽车製造商能够将库存计划与平台采购计划相匹配,即使在消费者信心减弱的情况下也能保障销售量。预计到 2025 年,尼日利亚、肯亚和南非的活跃叫车司机总合将超过 45 万,随着平台向农村城市的扩张,潜在需求将进一步成长。政府机构日益认识到这些车队是推动交通服务正规化的催化剂,衣索比亚和加纳已为低排放叫车提供税收优惠。由此带来的车队成长降低了许多市场零售融资管道有限的风险。
进口二手车的优势
根据非洲汽车製造商协会(AAAM)预测,到2024年,撒哈拉以南非洲地区83%的轻型车辆註册量将为二手。南非税务局的海关数据显示,二手和新车之间存在45%至60%的价格差距,影响了消费者的购买偏好。当该地货币贬值导致新车价格上涨时,这一差距会进一步扩大。预计2030年,富裕国家註销内燃机(ICE)车辆的计画每年将新增1,500万辆符合出口条件的车辆。除非制定更严格的进口品质标准,否则这可能会延长该地区高排放气体车辆的比例。联合国欧洲经济委员会(UNECE)的道路适航性通讯协定旨在遏制不合格车辆的流入,但边境口岸执法不力的问题持续削弱了该议定书的有效性。
细分市场分析
到2025年,乘用车将占撒哈拉以南非洲汽车市场总量的73.80%,预计到2031年,随着中等收入阶层的壮大,乘用车市场将以5.56%的复合年增长率成长。轻型商用车(LCV)受益于电子商务的快速发展,尤其是在奈及利亚和肯亚,两国的末端配送业者正在租赁专为密集城市路线优化的小型货车。在南非、尚比亚和安哥拉,中型和重型卡车的成长落后于整体市场成长,这与大宗商品出口週期密切相关。共乘车队透过降低前期成本的结构化融资方案,帮助稳定乘用车需求并消化轿车和掀背车的库存。
政策主导的电气化正在改变埃塞俄比亚乘用车的组成。一项规定,新註册车辆中必须有60%是电动车,这推动了专门的电动车组装的建设和公共部门的采购。同时,由于负载容量和续航里程的限制,商用车电气化较为滞后,儘管约翰尼斯堡目前正在城市物流循环中测试纯电动货车。乘用车市场的持续成长取决于货币稳定以及撒哈拉以南非洲汽车市场信贷改革的进展。
柴油平台凭藉着卓越的燃油经济性和完善的服务基础设施,在2025年占据了撒哈拉以南非洲汽车市场54.60%的份额,预计到2031年将维持6.02%的复合年增长率。汽油车在都市区的普及率正在上升,因为成本差异正在缩小,排放气体法规也不断加强。正如尼日利亚的压缩天然气(CNG)计画所表明的那样,由于奖励鼓励计程车和公车改装,CNG和液化石油气(LPG)等替代燃料正在小众车队中获得应用。利用当地原料的生质燃料计画在加纳和肯亚正在兴起,但政策协调和对混合设施的投资是其发展壮大的关键。
由于建筑和矿业车辆需求不断增长,撒哈拉以南非洲柴油动力系统汽车的市场规模正在扩大。然而,随着电动车推广政策的实施,新的需求转向电动平台,柴油动力汽车的市场份额正在逐渐下降。政府在燃油价格自由化方面的进展也将影响电动车的普及速度。那些较早取消柴油补贴的国家可能会加速汽油和混合动力汽车的普及。
其他福利:
- Excel格式的市场预测(ME)表
- 3个月的分析师支持
目录
第一章 引言
- 研究假设和市场定义
- 调查范围
第二章调查方法
第三章执行摘要
第四章 市场情势
- 市场概览
- 市场驱动因素
- 中产阶级收入成长与都市化
- 共享出行平台的激增正在加速车辆更新换代。
- 政府对CKD/SKD组装的奖励措施
- 透过基础设施建设改善道路连通性
- 透过非洲大陆自由贸易区(AfCFTA)降低关税,扩大区域内贸易
- 中国製造的微型电动车进口量不断成长,填补了超低成本市场的空白。
- 市场限制
- 在二手车进口领域占据主导地位
- 消费贷款的限制和高利率
- 由于该地货币波动,进口成本增加。
- 社会安全署认证标准分散
- 价值/供应链分析
- 监管环境
- 技术展望
- 波特五力模型
- 新进入者的威胁
- 买方和消费者的议价能力
- 供应商的议价能力
- 替代品的威胁
- 竞争对手之间的竞争
第五章 市场规模及成长预测(价值及数量)
- 按车辆类型
- 搭乘用车
- 轻型商用车
- 中型和重型商用车辆
- 按燃料类型
- 汽油
- 柴油引擎
- 替代燃料(压缩天然气、液化石油气、生质燃料)
- 透过推进技术
- 内燃机(ICE)
- 混合动力电动车(HEV)
- 电池电动车(BEV)
- 插电式混合动力车(PHEV)
- 按销售管道
- 汽车製造商(OEM)授权经销商
- 灰色进口/平行输入
- 按国家/地区
- 南非
- 奈及利亚
- 肯亚
- 衣索比亚
- 迦纳
- 坦尚尼亚
- 安哥拉
- 尚比亚
第六章 竞争情势
- 市场集中度
- 策略趋势
- 市占率分析
- 公司简介
- Toyota Motor Corporation
- Volkswagen AG
- Hyundai Motor Company
- Nissan Motor Corporation
- Isuzu Motors Ltd.
- Ford Motor Company
- Groupe Renault
- Honda Motor Corporation
- Suzuki Motor Corporation
- Subaru Corporation
- Stellantis NV
- Daimler AG(Mercedes-Benz)
- BYD Co.
- Geely Auto Group
- Changan Auto
- JAC Motors
- BAIC Group
- Tata Motors
- Mahindra & Mahindra
- Innoson Vehicle Manufacturing(Nigeria)
第七章 市场机会与未来展望
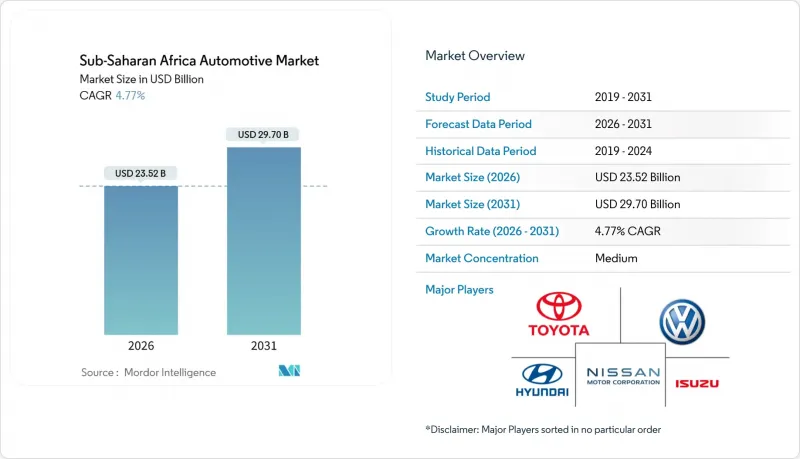
The Sub-Saharan Africa automotive market size in 2026 is estimated at USD 23.52 billion, growing from the 2025 value of USD 22.45 billion, with projections for 2031 showing USD 29.7 billion, representing a 4.77% CAGR over the 2026-2031 period.
Accelerating urbanization, surging ride-hailing fleets, and government incentives for local assembly collectively sustain momentum despite persistent currency volatility and infrastructure gaps. Electrification initiatives in Ethiopia and South Africa signal a structurally diversifying demand mix, while diesel platforms remain dominant because of established fuel logistics and service networks. Grey-import activity continues to temper authorized-dealer volumes, yet structured fleet financing programs unlock new-vehicle penetration among ride-hailing operators. Strategic OEM partnerships with local assemblers, supported by AfCFTA tariff reductions, reinforce regional supply-chain integration.
Sub-Saharan Africa Automotive Market Trends and Insights
Rising Middle-Class Income and Urbanization
An annual 4.1% urban-population uptick shifts purchasing power toward metropolitan nodes where dealer networks, financing options, and aftermarket services coalesce. Middle-income households in Nigeria, Kenya, and Ghana gravitate towards affordable models, intensifying competition between Chinese and Indian OEMs. Compact SUVs and hatchbacks hold favor for maneuverability in congested corridors, whereas peri-urban consumers rely on incoming used stock propelled by rising urban trade-in flows. Lenders follow employment clusters, resulting in cities above 1 million inhabitants offering up to five times more car-loan products than rural districts. Although local-currency depreciation erodes import affordability, wage growth linked to extractive sectors partially offsets price pressure, sustaining demand.
Surge of Ride-Hailing Platforms Accelerating Fleet Renewal
Structured fleet-financing programs from providers such as Moove enable ride-hailing drivers to bypass conventional credit hurdles, lifting multi-year baseline demand for the Sub-Saharan Africa automotive market. Ride-hailing vehicles operate 8-12 hours daily, roughly quadrupling private-use utilization, which shortens replacement cycles to 3-4 years. This predictable cadence enables OEMs to align inventory planning with platform procurement schedules, thereby protecting volumes when consumer sentiment declines. Nigeria, Kenya, and South Africa collectively host over 450,000 active ride-hailing drivers as of 2025, and platform expansion into secondary cities deepens the addressable demand. Government agencies increasingly recognize such fleets as catalysts for formalizing transport services, offering duty rebates on low-emission vehicles deployed for ride-hailing in Ethiopia and Ghana. Resultant fleet growth moderates the risk of limited retail financing reach in many markets.
Dominance of Used-Car Imports
Used vehicles represented 83% of all light-duty vehicle registrations across Sub-Saharan Africa in 2024, according to the African Association of Automotive Manufacturers . South African Revenue Service customs data show that price gaps of 45-60% between used and new models tilt buyer preference. This disparity is magnified whenever local-currency depreciation inflates showroom prices. Projected deregistrations of ICE cars in wealthier economies could add 15 million exportable units annually by 2030, prolonging the region's high-emission fleet unless stricter import-quality rules take hold. UNECE roadworthiness protocols aim to stem sub-standard flows, but uneven enforcement across border posts still dilutes effectiveness.
Other drivers and restraints analyzed in the detailed report include:
- Government CKD/SKD Assembly Incentives
- Infrastructure Upgrades Improving Road Connectivity
- Limited Consumer Credit Access and High Interest Rates
For complete list of drivers and restraints, kindly check the Table Of Contents.
Segment Analysis
Passenger cars preserved a 73.80% share of the Sub-Saharan Africa automotive market volume in 2025 and are forecast to grow at a 5.56% CAGR through 2031, as middle-income cohorts expand. Light commercial vehicles (LCVs) benefit from e-commerce acceleration, especially in Nigeria and Kenya, where last-mile delivery providers lease small vans optimized for dense urban routes. Medium- and heavy-duty trucks trail the overall market growth, tied to commodity-export cycles in South Africa, Zambia, and Angola. Ride-hailing fleets underpin steady passenger-car demand, absorbing sedan and hatchback stock through structured financing programs that lower upfront cost burdens.
Policy-driven electrification in Ethiopia reshapes the passenger-car mix: 60% of newly registered cars must be EVs, catalyzing dedicated assembly ventures and public-sector procurement. Conversely, commercial-vehicle electrification lags due to payload-range constraints, although pilot programs in Johannesburg are testing battery-electric vans under urban logistics duty cycles. Sustained momentum within the passenger-car segment remains contingent on currency stability and progressive credit-access reforms across the Sub-Saharan Africa automotive market.
Diesel platforms held a 54.60% share of the Sub-Saharan Africa automotive market volume in 2025, buoyed by superior fuel economy and extensive service infrastructure, and they are projected to post a 6.02% CAGR through 2031. Gasoline penetration increases in urban centers where cost gaps narrow, and emissions policies become stricter. Alternative fuels, such as CNG and LPG, capture niche fleet deployments, as highlighted by Nigeria's compressed natural gas scheme, which incentivizes taxi and bus conversions. Biofuel initiatives are germinating in Ghana and Kenya, utilizing local feedstocks, but scaling up hinges on policy consistency and investment in blending facilities.
The Sub-Saharan African automotive market size for diesel powertrains expands alongside demand for construction and mining vehicles. Yet, its share gradually erodes as EV incentives redirect incremental demand toward electrified platforms. Government fuel-price deregulation trajectories also influence adoption curves; countries that phase out diesel subsidies sooner may prompt faster adoption of gasoline or hybrids.
The Sub-Saharan Africa Automotive Market Report is Segmented by Vehicle Type (Passenger Cars, Light Commercial Vehicles, and More), Fuel Type (Gasoline, Diesel, and More), Propulsion Technology (Internal Combustion Engine (ICE), Hybrid Electric Vehicle (HEV), and More), Sales Channel, and Country. The Market Forecasts are Provided in Terms of Value (USD) and Volume (Units).
List of Companies Covered in this Report:
- Toyota Motor Corporation
- Volkswagen AG
- Hyundai Motor Company
- Nissan Motor Corporation
- Isuzu Motors Ltd.
- Ford Motor Company
- Groupe Renault
- Honda Motor Corporation
- Suzuki Motor Corporation
- Subaru Corporation
- Stellantis N.V.
- Daimler AG (Mercedes-Benz)
- BYD Co.
- Geely Auto Group
- Changan Auto
- JAC Motors
- BAIC Group
- Tata Motors
- Mahindra & Mahindra
- Innoson Vehicle Manufacturing (Nigeria)
Additional Benefits:
- The market estimate (ME) sheet in Excel format
- 3 months of analyst support
TABLE OF CONTENTS
1 Introduction
- 1.1 Study Assumptions & Market Definition
- 1.2 Scope of the Study
2 Research Methodology
3 Executive Summary
4 Market Landscape
- 4.1 Market Overview
- 4.2 Market Drivers
- 4.2.1 Rising Middle-Class Income and Urbanization
- 4.2.2 Surge of Ride-Hailing Platforms Accelerating Fleet Renewal
- 4.2.3 Government CKD/SKD Assembly Incentives
- 4.2.4 Infrastructure Upgrades Improving Road Connectivity
- 4.2.5 AfCFTA Tariff Reductions Expanding Intra-Regional Trade
- 4.2.6 Growth of Chinese Micro-EV Imports Filling Ultra-Low-Cost Niche
- 4.3 Market Restraints
- 4.3.1 Dominance of Used-Car Imports
- 4.3.2 Limited Consumer Credit Access and High Interest Rates
- 4.3.3 Local-Currency Volatility Inflating Import Costs
- 4.3.4 Fragmented Homologation Standards Across SSA
- 4.4 Value / Supply-Chain Analysis
- 4.5 Regulatory Landscape
- 4.6 Technological Outlook
- 4.7 Porter's Five Forces
- 4.7.1 Threat of New Entrants
- 4.7.2 Bargaining Power of Buyers/Consumers
- 4.7.3 Bargaining Power of Suppliers
- 4.7.4 Threat of Substitute Products
- 4.7.5 Intensity of Competitive Rivalry
5 Market Size & Growth Forecasts (Value (USD) and Volume (Units))
- 5.1 By Vehicle Type
- 5.1.1 Passenger Cars
- 5.1.2 Light Commercial Vehicles
- 5.1.3 Medium and Heavy Commercial Vehicles
- 5.2 By Fuel Type
- 5.2.1 Gasoline
- 5.2.2 Diesel
- 5.2.3 Alternative Fuels (CNG, LPG, Bio-fuel)
- 5.3 By Propulsion Technology
- 5.3.1 Internal Combustion Engine (ICE)
- 5.3.2 Hybrid Electric Vehicle (HEV)
- 5.3.3 Battery Electric Vehicle (BEV)
- 5.3.4 Plug-in Hybrid Electric Vehicle (PHEV)
- 5.4 By Sales Channel
- 5.4.1 Original Equipment Manufacturer (OEM)-Authorized Dealer
- 5.4.2 Grey Import / Parallel
- 5.5 By Country
- 5.5.1 South Africa
- 5.5.2 Nigeria
- 5.5.3 Kenya
- 5.5.4 Ethiopia
- 5.5.5 Ghana
- 5.5.6 Tanzania
- 5.5.7 Angola
- 5.5.8 Zambia
6 Competitive Landscape
- 6.1 Market Concentration
- 6.2 Strategic Moves
- 6.3 Market Share Analysis
- 6.4 Company Profiles (Includes Global Level Overview, Market Level Overview, Core Segments, Financials as Available, Strategic Information, Market Rank/Share for Key Companies, Products and Services, SWOT Analysis, and Recent Developments)
- 6.4.1 Toyota Motor Corporation
- 6.4.2 Volkswagen AG
- 6.4.3 Hyundai Motor Company
- 6.4.4 Nissan Motor Corporation
- 6.4.5 Isuzu Motors Ltd.
- 6.4.6 Ford Motor Company
- 6.4.7 Groupe Renault
- 6.4.8 Honda Motor Corporation
- 6.4.9 Suzuki Motor Corporation
- 6.4.10 Subaru Corporation
- 6.4.11 Stellantis N.V.
- 6.4.12 Daimler AG (Mercedes-Benz)
- 6.4.13 BYD Co.
- 6.4.14 Geely Auto Group
- 6.4.15 Changan Auto
- 6.4.16 JAC Motors
- 6.4.17 BAIC Group
- 6.4.18 Tata Motors
- 6.4.19 Mahindra & Mahindra
- 6.4.20 Innoson Vehicle Manufacturing (Nigeria)
7 Market Opportunities & Future Outlook
- 7.1 White-space & Unmet-need Assessment
 南美汽车市场:市场占有率分析、产业趋势与统计、成长预测(2026-2031)非洲汽车市场:市场占有率分析、产业趋势与统计、成长预测(2026-2031年)北美汽车市场:市场占有率分析、产业趋势与统计、成长预测(2026-2031)
 越南汽车涂料市场(2025)中国的汽车用涂料市场(2025年)印尼的汽车用涂料市场(2025年)印度的汽车用涂料市场:2025年日本的汽车用涂料市场:2025年美国的汽车用涂料市场(2025年)
 汽车市场-全球产业规模、份额、趋势、机会和预测(按车型、推进类型、地区和竞争情况划分,2020-2030 年预测)