


|
市场调查报告书
商品编码
1723670
营运商中立网路营运商 (CNNO) 市场回顾(2024 年第四季):生成式人工智慧 (Generic AI) 热潮加速私募股权投资Carrier-Neutral Operator Market Review, 4Q24: GenAI Hype Speeds Up Private Equity's Push into Sector |
|||||||
预计 2024 年营收将保持稳定,约 1,070 亿美元,而资本支出将成长 7%,达到 430 亿美元。生成式人工智慧 (Generic AI) 热潮正在推动这一成长,尤其是在 Airtrunk 等大型私募股权主导的交易中
本报告探讨了营运商中立网路营运商 (CNNO) 市场的成长和发展,追踪了 2011 年第一季至 2024 年第四季全球 47 家 CNNO 的大量财务数据。
受访公司预计 2024 年全年营收为 1,067 亿美元(年增 0.2%),资本支出为 429 亿美元(年增 6.8%)。截至2024年底,这些CNNO的净固定资产为2,611亿美元(年减0.5%),员工约11.2万人(年减2.0%)。
视觉
CNNO 是 MTN Consulting 追踪的三大营运商细分市场中规模最小的一个(另外两个是营运商和网路营运商),但它在电信领域发挥着非常重要且互补的作用。 CNNO 拥有并经营全球众多行动讯号塔、小型基地台、资料中心和光纤批发网路。过去,电信业者采取 "全包" 模式,拥有整个网路基础设施,自行生产交换器和传输设备,甚至提供客户端设备 (CPE)。但这种模式已经过时。到 2025 年,电信业者将结合自有设施和租赁或租用的外部资源来建立实体网路。许多电信业者传统上透过将部分实体资产出售给私募股权基金或上市的有线电视网路营运商 (CNNO) 的基础设施部门来筹集资金。这些出售通常包含回租条款,使电信业者能够有效地将资本支出转化为营运支出。网路营运商(例如云端服务供应商)也严重依赖CNNO。他们正在进行大量的资本支出,仅在 2023 年就达到 3,040 亿美元,但他们主要租赁光纤和传输频宽,并不拥有所有资料中心。 CNNO 也服务其他终端市场,例如金融、媒体和能源等行业的企业和政府机构,但其最大的客户是电信营运商和网路营运商。 CNNO 在这些营运商的网路设计和成本结构中发挥着至关重要的作用。
报告重点:
营收:CNNO 的营收将从 2011 年的不到 200 亿美元成长到 2024 年的 1,067 亿美元。这一数字与上年基本持平,这对于併购活动较少的年份来说并不罕见。然而,从2018年到2024年,CNNO的营收将以年均7%的稳定速度成长。到2024年,将有7家CNNO公司的年收入超过50亿美元。
资本支出:CNNO的资本支出将从2011年的约60亿美元增加到2024年的429亿美元。这比2023年成长了约7%,这是一个健康的成长率,但与专门从事超大规模资料中心建设的公司的资本支出成长相比,这一成长幅度仍然很小。例如,2024年,网路规模营运商的资本支出成长超过50%,而生成式人工智慧的繁荣已经将该市场推入泡沫区域。 CNNO产业的生成式人工智慧过热趋势主要集中在私募股权引领的私人公司。
获利能力:2024 年 CNNO 产业的平均净利率为 2.1%,与 2023 年的 2.7% 基本持平。儘管 Crown Castle 的光纤网路业务出现了巨额亏损,但这笔数据仍然保持了下来。 2024年,自由现金流利润率平均为2.8%,较2023年的-0.8%大幅提升。到2024年底,CNNO的资产负债表上的债务将达到约2,400亿美元,其中现金和投资略低于220亿美元,净债务仍接近2,200亿美元。
调查对象
本检讨中包含着以下的企业。
|
|
目录
第1章 报告亮点
第2章 CNNO市场区隔概要
第3章 分析
第4章 运用指标
第5章 主要统计
第6章 企业的详细分析
第7章 企业基准
第8章 原始数据
第9章 汇率
第10章 关于本公司
Revenues flat at ~$107B in 2024, capex up 7% to $43B; GenAI hype is a driver, but more so in PE-led ventures (e.g. Airtrunk) due to size & scale requirements
This report reviews the growth and development of the carrier-neutral network operator (CNNO) market. The report tracks a wide range of financial stats for 47 CNNOs across the globe, from 1Q11 through 4Q24. For the full-year 2024, the companies covered by this study represented $106.7 billion (B) in revenues (+0.2% YoY), and $42.9 B in capex (+6.8% YoY). At the end of 2024 (EOY24), these CNNOs had $261.1B of net plant, property and equipment (net PP&E) on the books (-0.5% YoY), and employed approximately 112,000 people (-2.0% YoY).
VISUALS
The CNNO market is the smallest of three operator segments tracked by MTN Consulting, alongside telco & webscale, but CNNOs play a crucial, complementary role in the communications sector and own and operate a large portion of the world's cell towers, small cells, data centers, and wholesale fiber networks. In the old days, telcos did it all: they owned all the network infrastructure, they manufactured the switches and transmission gear deployed in the network, and even provided CPE. That model is long since extinct. The telco of 2025 cobbles together its physical network from a mix of owned and leased or rented resources. Over the years, many telcos have raised funds by selling off parts of their physical plant to private equity funds with infrastructure arms, or to public CNNOs. Usually there is a leaseback provision as part of the sale, enabling the telco to effectively turn capex into opex. Cloud providers in the webscale world also rely heavily on CNNOs; while they spend heavily on capex ($304B last year), they generally lease fiber or transmission bandwidth, and only own a portion of their data centers. CNNOs do serve other end markets, including various enterprise verticals (finance, media, and energy), and government. But telcos and webscalers are the biggest targets. CNNOs play a vital role in the network design and cost structure of these operators.
CNNOs are constantly reshuffling their asset base to optimize costs and position for growth. The most effective CNNOs have mastered the art of acquiring companies and/or discrete physical networks or facilities, and integrating them smoothly and quickly into existing operations. Finding cost benefits from the greater scale is key, as is being able to cross-sell across a larger universe of customers. This study attempts to focus on the purely 'neutral' CNNOs, i.e. the ones that do not have key customers also show up as key shareholders. China Tower, for instance, is majority owned by its top 3 customers, the big local telcos. This is an exception to the rule; we do include China Tower, because of its size and China's unusual networks ecosystem.
The figures in this study are based on a thorough bottoms-up assessment of the global CNNO market, focusing on companies that are either publicly traded now, or were public in the recent past. We cannot credibly track a company if it is purely private and reports no audited numbers to regulatory authorities. This is also a challenge in other markets, such as webscale, where we are not able to track ByteDance/TikTok officially because it produces no reliable numbers. In the CNNO world, the biggest challenge is private equity. PE's rising interest in assembling digital infrastructure portfolios is a big reason for the growth of the CNNO market over the last decade. They're attempting to create synergies across their digital investees, sometimes through mergers, and synergies with other parts of their investment portfolio. With the rise of GenAI, for instance, some PE firms are investing directly in energy supply in order to ensure competitive rates and terms (e.g. renewable sources) for the data center players in their portoflio. We include some PE-owned companies in this study, if it's possible to estimate their financials from past reported data. But we also have to exclude some major players; Airtrunk is a good example. It was acquired by PE giant Blackstone late last year, for $16B. This is the CNNO market's biggest M&A deal in 2024, but we have no realistic way to capture Airtrunk in our database.
Below are some highlights from the report:
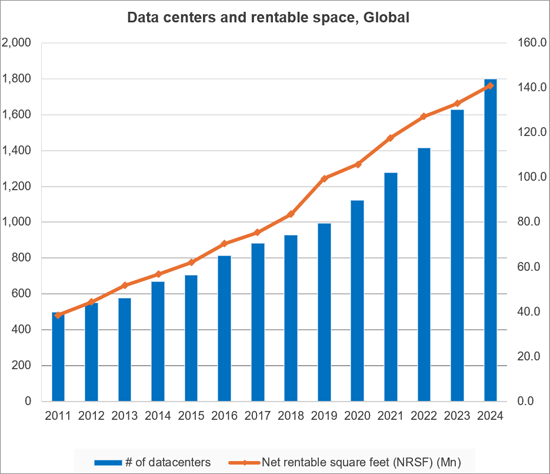
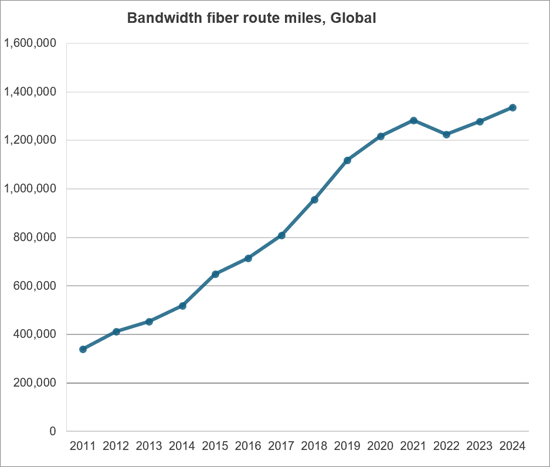
Revenues: from under $20B in 2011, the CNNO sector recorded revenues of $106.7B in 2024. That is roughly zero growth YoY, which is not unusual in a year when M&A was almost nonexistent; over the 2018-24 timeframe, CNNO revenue growth averaged 7% per year. In 2024, there were 7 CNNOs with over $5B in annual revenues; from largest to smallest, they are: China Tower ($13.6B), American Tower ($10.1B), Equinix ($8.7B), DigitalBridge ($8.6B), Crown Castle ($6.6B), Level 3 ($6.5B), and Digital Realty ($5.6B). A few of these are exclusively focused on one type of infra, while some are hybrid. China Tower is focused on macro cell towers, but it also has extensive DAS coverage (e.g. 13,126km of subway coverage) and is building an energy business focused on battery exchange and power backup. American Tower is a hybrid, beginning its life as a tower specialist but branching into data centers with the 2021 purchase of CoreSite. Equinix and Digital Realty are data center specialists exclusively, just as Level 3 is focused solely on fiber/bandwidth. Crown Castle owns towers, small cells, and fiber, but is selling off the latter two to Zayo & EQT. DigitalBridge is the oddest of the 7, as it is an investment holding company with stakes in a large number of CNNO-type providers, including towers, small cells/DAS, fiber, and data centers. DataBank and Zayo are two of its largest holdings. To grow over five-fold in a decade, the scope of the market has expanded dramatically, largely through M&A. Since 2011, CNNOs' M&A has totaled $229.6B, versus $347B for capex.
Capex: from ~$6B in 2011, CNNO capex was $42.9B in 2024. That is up about 7% up from the 2023 total. That's a healthy level of growth, but nothing like the capex growth of companies focused on hyperscale data center construction. Webscale capex grew by over 50% in 2024. Generative AI hype long ago pushed that market into bubble territory. In CNNO, the GenAI excesses are concentrated in the PE sector, by private companies, being driven by true believer investors who view 'digital infrastructure' as a key driving force for future economic growth. Many believe that GenAI can solve many of the world's problems, including climate change. Among CNNOs without PE backing, some have been using creative financing vehicles to build hyperscale-class facilities for the big cloud providers. In October 2024, for instance, Equinix announced a $15B joint venture with GIC and Canada Pension Plan Investment Board (CPP Investments), to build hyperscale/AI data centers in the US market. Similarly, on a much smaller scale, Digital Realty announced in March 2025 that it would enter the Indonesian market via a JV, with Bersama Digital Infrastructure Asia.
Profitability: average net margin for the CNNO sector was 2.1% in 2024, in line with the 2.7% recorded in 2023, despite Crown Castle booking a big net loss last year related to its fiber network. Free cash flow margin averaged to 2.8% in 2024, up from the -0.8% of 2023. CNNOs had nearly $240B of debt on the balance sheets at EOY24, and just under $22B in cash & investments; net debt, therefore, is still nearly $220B. Both American Tower and Crown Castle have recently announced big asset sales to help lower debt levels, and we can expect more of this to occur in 2025.
Employees: CNNOs ended 2024 with about 112K employees, from 114.3K at EOY2023. CNNOs aim for efficiency in the operation of their infrastructure, and use automation when possible to lower labor costs. However, most CNNOs engage in M&A and hence often need to integrate & rationalize assets before they can reap the scale & synergy benefits. There can be some delay as adjustments to the workforce are made. On a revenue per employee basis, the CNNO sector is impressive, at over $945K per employee in 2024, up slightly from $937K in 2023. These figures are significantly higher than the webscale and telco network operator markets.
Energy: CNNOs consumed an average of 796 MWH per $M of revenues in 2024 (estimated), up from 555 MWh/$M several years ago, in 2019. Data center CNNOs are starting to dominate the market, and they use much higher than average amounts of energy to power their operations. The most energy intensive CNNO in 2023 (the last year with actual data) was ChinData, at 4,403 MWh/$M; Crown Castle was towards the bottom, with just 31MWh/$M.
Research Coverage
The following companies are included in this Market Review:
|
|
Table of Contents
1. Report Highlights
2. CNNO Segment Overview
3. Analysis
4. Operating Metrics
5. Key Stats
6. Company Drilldown
7. Company Benchmarking
8. Raw Data
9. Exchange Rates
10. About
List of Figures and Charts
- 1. Revenues by CNNO type (US$M)
- 2. Revenues single-quarter (US$M)
- 3. CNNO Profitability, annualized (%)
- 4. Capex & M&A spending, single-quarter (US$M)
- 5. Net PP&E by CNNO type (US$M)
- 6. Number of data centers & NRSF per data center (K)
- 7. Bandwidth fiber route miles, Global
- 8. CNNO towers & average tenancy ratio
- 9. Average size of data center, owned vs. leased: Equinix (000s of sq ft)
- 10. Average number of cabinets installed, owned vs. leased: 21ViaNet
- 11. # OF DATACENTERS: Global
- 12. NET RENTABLE SQUARE FEET (NRSF) (MN): Global
- 13. NRSF PER DATA CENTER (K): Global
- 14. # OF TOWERS: By Region
- 15. NUMBER OF TENANTS: By Region
- 16. AVG TENANCY PER OCCUPIED TOWER: By Region
- 17. ROUTE MILES OF FIBER: Global
Below charts by total CNNO market and by companies:
- 1. Revenues: annual, single-quarter, and annualized (US$M)
- 2. Profitability (Net Profit; Cash from operations; Free cash flow): annual, single-quarter, and annualized (US$M)
- 3. Spending (M&A; Capex): annual, single-quarter, and annualized (US$M)
- 4. Cash & Short-term Investments: annual and single-quarter (US$M)
- 5. Debt (Total debt; Net debt): annual and single-quarter (US$M)
- 6. Property, Plant & Equipment: annual and single-quarter (US$M)
- 7. Key Ratios: Net margin; Capex/revenues; M&A/revenues; Free cash flow/revenues
- 8. Total employees
- 9. Energy Intensity in CNNO sector
- 10. Energy Intensity by Company, 2023 (MWh/$M)
- 11. Revenue per employee, annualized (US$K)
- 12. FCF per employee, annualized (US$K)
- 13. Net PP&E per employee, annualized (US$K)
Company benchmarking charts:
- 1. 2018 vs. 2024: company benchmark by KPI (Revenues, Net profit, Cash from operations, Capex, Free cash flow, Cash & short-term investments, Net PP&E, Total debt)
- 2. 2018 vs. 2024: company benchmark by key ratio (Capex/revenues; Net margin; FCF margin)
- 3. KPI Benchmarking (Revenues, Net profit, Cash from operations, Capex, Free cash flow, Cash & short-term investments, Net PP&E, Total debt)
- 4. Benchmarking by Key ratios: Capex/revenues; Net margin; FCF margin
- 5. Top CNNOs by infrastructure type (2023):
- # of towers
- Avg tenancy per occupied tower
- Number of Tenants
- Route miles of fiber
- # of datacenters
- Net rentable square feet (NRSF) (Mn)
- NRSF per data center (K)
 2025年全球虚拟网路营运商市场报告
 Apps Run The World - 应用市场分析与买家洞察
 虚拟网路营运商市场(按营运模式、服务技术和地区)
 关税情势如何影响美国再生能源成本
 关税情势对美国的再生能源成本带来的影响- 数据
 通讯网路营运商市场回顾(2024年第三季):营收復苏,但持续的支出削减导致年度资本支出低于3,000亿美元大关
 网路营运商资本支出展望(2024 年第四季版):电信公司持平,但人工智慧驱动的生成式资料中心炒作将推动电信资本支出在 2024 年超过 6,000 亿美元,其中 Scalers 预计将引领市场
 网路营运商永续发展策略的全球市场:2024-2029
 Direct-to-Cell 全球市场:2024-2029
 虚拟网路营运商 (VNO) 的全球市场预测(截至 2030 年):按类型、目标客户、服务、技术、最终用户和地区进行分析