


 |
市场调查报告书
商品编码
1698530
自愿性碳信用市场机会、成长动力、产业趋势分析及2025-2034年预测Voluntary Carbon Credit Market Opportunity, Growth Drivers, Industry Trend Analysis, and Forecast 2025-2034 |
||||||
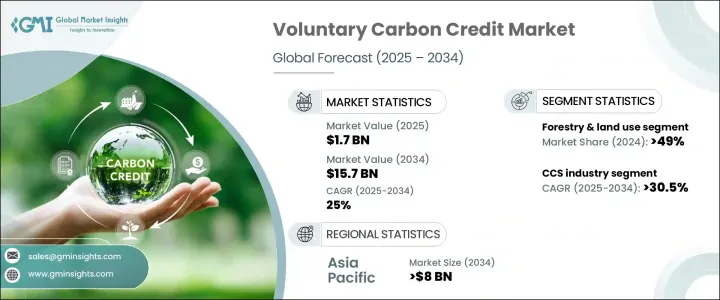
2024 年全球自愿性碳信用市场价值为 17 亿美元,预计 2025 年至 2034 年期间的复合年增长率将达到 25%。企业对实现净零排放和提高永续性评级的承诺日益增多,推动了不同产业多样化信用体系的发展。企业正在积极购买碳信用额来抵消业务营运产生的排放,从而促进市场成长。自愿性碳信用纳入合规框架增强了市场流动性、可信度和需求,吸引了有助于价格稳定和企业参与的机构投资者。这种整合有利于增加对高品质专案的投资,推动全球减少碳足迹的努力,并加速该产业的扩张。
目前,有相当多的企业将碳信用纳入其ESG策略,以增强投资者信心并提高企业声誉。虽然自愿性碳信用市场规模从 2022 年的 19 亿美元下降到 2024 年的 17 亿美元,但产业预测表明,在技术进步和碳补偿计算方法改进的推动下,市场将出现强劲反弹。预计提高可访问性和可追溯性的创新将在预测期内支持持续成长。
| 市场范围 | |
|---|---|
| 起始年份 | 2024 |
| 预测年份 | 2025-2034 |
| 起始值 | 17亿美元 |
| 预测值 | 157亿美元 |
| 复合年增长率 | 25% |
全球范围内有多个框架鼓励企业自愿抵消排放并与永续发展目标保持一致。这些指导方针强调责任和透明度,促使更多组织参与碳信用市场。此外,政府法规以外的各种方式也推动自愿参与减排计划,扩大市场范围。
根据最终用途,市场分为多个部分,包括林业和土地利用、农业、再生能源、碳捕获和储存、家庭和社区、化学过程、工业和商业、运输和废物管理。 2024年,林业和土地利用将占据49%以上的市场份额,预计将持续成长。全球范围内不断扩大的造林和再造林计画增加了对碳补偿的需求,而环境政策进一步强化了这些措施。
预计到 2034 年,自愿性碳信用市场中的碳捕获和储存部门的复合年增长率将超过 30.5%。碳减排投资的增加和储存技术的进步是推动这项扩张的关键因素。受再生能源在国家能源结构中所占比重不断增加的推动,到 2034 年,再生能源产业的规模预计也将超过 30 亿美元。随着全球能源结构向永续替代能源转变,预计碳信用的需求将大幅上升。
在美国,自愿性碳信用市场从 2022 年的 2 亿美元成长到 2024 年的 4 亿美元。不断增加的净零承诺和消费者对永续产品的偏好正在推动企业采用碳信用计划。在区块链技术的支持下,碳信用交易的透明度提高,增强了市场信任。此外,对直接空气捕获和碳去除计划的投资正在促进创新,进一步支持自愿性碳信用产业的发展。
目录
第一章:方法论与范围
- 市场范围和定义
- 市场估计和预测参数
- 预测计算
- 资料来源
- 基本的
- 次要
- 有薪资的
- 民众
第二章:执行摘要
第三章:行业洞察
- 产业生态系统分析
- 监管格局
- 产业衝击力
- 成长动力
- 产业陷阱与挑战
- 成长潜力分析
- 波特的分析
- PESTEL 分析
第四章:竞争格局
- 介绍
- 战略展望
- 创新与永续发展格局
第五章:市场规模及预测:依最终用途,2021 年至 2034 年
- 主要趋势
- 农业
- 碳捕获和储存
- 化学过程
- 家庭和社区
- 工业和商业
- 林业和土地利用
- 再生能源
- 废弃物管理
- 其他的
第六章:市场规模及预测:依地区,2021 年至 2034 年
- 主要趋势
- 北美洲
- 我们
- 加拿大
- 墨西哥
- 欧洲
- 保加利亚
- 罗马尼亚
- 荷兰
- 瑞士
- 亚太地区
- 中国
- 印度
- 印尼
- 泰国
- 中东和非洲
- 土耳其
- 肯亚
- 奈及利亚
- 南非
- 拉丁美洲
- 巴西
- 智利
- 秘鲁
第七章:公司简介
- 3Degrees
- ALLCOT
- Atmosfair
- CarbonClear
- ClimeCo
- Climate Impact Partners
- EcoAct
- Ecosecurities
- Microsoft
- PwC
- Shell
- South Pole
- TerraPass
- The Carbon Collective Company
- The Carbon Trust
- VERRA
The Global Voluntary Carbon Credit Market, valued at USD 1.7 billion in 2024, is projected to expand at a CAGR of 25% from 2025 to 2034. Growing corporate commitments to achieving net-zero emissions and improving sustainability ratings have driven the development of diverse credit systems across different sectors. Companies are actively purchasing carbon credits to offset emissions from business operations, reinforcing market growth. The integration of voluntary carbon credits into compliance frameworks has enhanced market liquidity, credibility, and demand, attracting institutional investors who contribute to price stability and corporate participation. This integration is facilitating increased investment in high-quality projects, boosting global efforts to reduce carbon footprints, and accelerating the industry's expansion.
A significant number of enterprises now incorporate carbon credits into their ESG strategies to strengthen investor confidence and enhance business reputations. While the voluntary carbon credit market saw a decline from USD 1.9 billion in 2022 to USD 1.7 billion in 2024, industry projections indicate a strong rebound driven by technological advancements and improved methods for calculating carbon offsets. Innovations that improve accessibility and traceability are expected to support sustained growth over the forecast period.
| Market Scope | |
|---|---|
| Start Year | 2024 |
| Forecast Year | 2025-2034 |
| Start Value | $1.7 Billion |
| Forecast Value | $15.7 Billion |
| CAGR | 25% |
Several frameworks worldwide encourage businesses to voluntarily offset emissions and align with sustainability objectives. These guidelines emphasize accountability and transparency, prompting more organizations to engage in carbon credit markets. Additionally, various approaches outside government regulations are promoting voluntary participation in emissions reduction programs, expanding the market's scope.
The market is categorized into multiple segments based on end use, including forestry and land use, agriculture, renewable energy, carbon capture and storage, household and community, chemical processes, industrial and commercial, transportation, and waste management. In 2024, forestry and land use accounted for more than 49% of the market share, with expectations of continued growth. Expanding afforestation and reforestation projects worldwide have increased the demand for carbon offsets, with environmental policies further reinforcing these initiatives.
The carbon capture and storage sector within the voluntary carbon credit market is anticipated to grow at a CAGR exceeding 30.5% through 2034. Rising investments in carbon mitigation and advancements in storage technologies are key factors fueling this expansion. The renewable energy sector is also expected to surpass USD 3 billion by 2034, driven by the growing share of renewable sources in national energy portfolios. As the global energy mix shifts toward sustainable alternatives, the demand for carbon credits is expected to rise significantly.
In the United States, the voluntary carbon credit market grew from USD 200 million in 2022 to USD 400 million in 2024. Increasing net-zero commitments and consumer preference for sustainable products are driving corporate adoption of carbon credit programs. Enhanced transparency in carbon credit trading, supported by blockchain technology, has strengthened trust in the market. Additionally, investments in direct air capture and carbon removal initiatives are fostering innovation, further supporting the voluntary carbon credit industry's growth.
Table of Contents
Chapter 1 Methodology & Scope
- 1.1 Market scope & definitions
- 1.2 Market estimates & forecast parameters
- 1.3 Forecast calculation
- 1.4 Data sources
- 1.4.1 Primary
- 1.4.2 Secondary
- 1.4.2.1 Paid
- 1.4.2.2 Public
Chapter 2 Executive Summary
- 2.1 Industry synopsis, 2021 - 2034
Chapter 3 Industry Insights
- 3.1 Industry ecosystem analysis
- 3.2 Regulatory landscape
- 3.3 Industry impact forces
- 3.3.1 Growth drivers
- 3.3.2 Industry pitfalls & challenges
- 3.4 Growth potential analysis
- 3.5 Porter's analysis
- 3.5.1 Bargaining power of suppliers
- 3.5.2 Bargaining power of buyers
- 3.5.3 Threat of new entrants
- 3.5.4 Threat of substitutes
- 3.6 PESTEL analysis
Chapter 4 Competitive Landscape, 2024
- 4.1 Introduction
- 4.2 Strategic outlook
- 4.3 Innovation & sustainability landscape
Chapter 5 Market Size and Forecast, By End Use, 2021 – 2034 (Million Credits, USD Billion)
- 5.1 Key trends
- 5.2 Agriculture
- 5.3 Carbon capture & storage
- 5.4 Chemical process
- 5.5 Household & community
- 5.6 Industrial & commercial
- 5.7 Forestry & land use
- 5.8 Renewable energy
- 5.9 Waste management
- 5.10 Others
Chapter 6 Market Size and Forecast, By Region, 2021 – 2034 (Million Credits, USD Billion)
- 6.1 Key trends
- 6.2 North America
- 6.2.1 U.S.
- 6.2.2 Canada
- 6.2.3 Mexico
- 6.3 Europe
- 6.3.1 Bulgaria
- 6.3.2 Romania
- 6.3.3 Netherlands
- 6.3.4 Switzerland
- 6.4 Asia Pacific
- 6.4.1 China
- 6.4.2 India
- 6.4.3 Indonesia
- 6.4.4 Thailand
- 6.5 Middle East & Africa
- 6.5.1 Turkey
- 6.5.2 Kenya
- 6.5.3 Nigeria
- 6.5.4 South Africa
- 6.6 Latin America
- 6.6.1 Brazil
- 6.6.2 Chile
- 6.6.3 Peru
Chapter 7 Company Profiles
- 7.1 3Degrees
- 7.2 ALLCOT
- 7.3 Atmosfair
- 7.4 CarbonClear
- 7.5 ClimeCo
- 7.6 Climate Impact Partners
- 7.7 EcoAct
- 7.8 Ecosecurities
- 7.9 Microsoft
- 7.10 PwC
- 7.11 Shell
- 7.12 South Pole
- 7.13 TerraPass
- 7.14 The Carbon Collective Company
- 7.15 The Carbon Trust
- 7.16 VERRA
 全球低碳农业市场 - 2025-2032
 2025年全球碳信用交易平台市场报告2025年农业、林业和土地利用碳信用全球市场报告
 碳农业市场:按农业实践、实践类型和最终用户 - 2025-2030 年全球预测
 林业及土地利用碳信用市场机会、成长动力、产业趋势分析及2025-2034年预测2025年碳信用全球市场报告碳农业市场 - 全球产业规模、份额、趋势、机会和预测,按专案类型、实践、最终用户、地区和竞争细分,2020-2030 年全球碳农业市场 - 2025 至 2032 年
 碳农业市场 - 全球和区域分析:按应用、产品和国家 - 分析和预测(2024-2034 年)
 碳信用检验、确认和认证市场预测至 2030 年:按类型、服务、计划类型、检验类型、最终用户和地区进行的全球分析