


 |
市场调查报告书
商品编码
1885873
智慧电动汽车充电网路市场机会、成长驱动因素、产业趋势分析及预测(2025-2034年)Smart EV Charging Networks Market Opportunity, Growth Drivers, Industry Trend Analysis, and Forecast 2025 - 2034 |
||||||
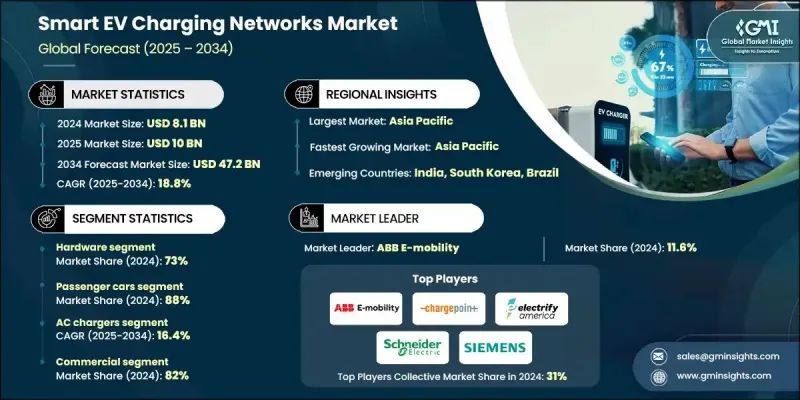
2024 年全球智慧电动车充电网路市场价值为 81 亿美元,预计到 2034 年将以 18.8% 的复合年增长率成长至 472 亿美元。
市场扩张与电动出行的加速发展和数位化协调充电生态系统的普及密切相关。网路营运商正日益整合智慧负载管理系统、即时分析和云端平台,以提升充电桩效能、加强电网互动并改善整体用户体验。随着交通电气化的发展,优化充电能力和简化能源输送的需求也日益增长。电网现代化和车队电气化持续影响智慧充电网路的基础设施建设重点。这些系统有助于实现即时功率平衡、需求响应、储能优化和再生能源併网。人工智慧技术,例如先进的能源编排、网路安全层、车网互动功能和预测性运行,为可扩展且具有弹性的生态系统提供了支援。公用事业公司、充电网路供应商和製造商之间的合作正在加速部署,而标准化协议和漫游协议则为更广泛的互通性铺平了道路。预测分析与政策驱动的投资相结合,有望催生充电和能源管理领域的新型服务模式。
| 市场范围 | |
|---|---|
| 起始年份 | 2024 |
| 预测年份 | 2025-2034 |
| 起始值 | 81亿美元 |
| 预测值 | 472亿美元 |
| 复合年增长率 | 18.8% |
到2024年,硬体部分将占据73%的市场。随着对大量充电埠的需求持续成长,实体基础设施仍然是网路扩展的基础。低功率交流充电器占所需数量的大多数,预计在2,800万个充电器中,约有2,680万个将用于满足住宅、工作场所和社区的充电需求。
预计到2024年,乘用车市场将占据88%的份额,这主要得益于消费者对电动车的接受度不断提高,从而推动了家用和公共充电的需求。住宅交流充电和工作场所的充电设施满足了日常通勤需求,而智慧充电平台则允许用户管理用电量、安排充电时间,并利用动态定价功能来降低能源成本,减轻当地电网的压力。
美国智慧电动车充电网路市场占89.7%的市场份额,预计2024年市场规模将达到8.569亿美元。州和联邦层级的强有力政策支持持续推动智慧电动车的普及,国家立法也拨出大量资源扩大充电基础设施和提升电网容量。电动车销售的成长进一步凸显了在公共和私人场所广泛普及充电设施的必要性。
智慧电动车充电网路市场的主要企业包括ABB E-mobility、EVBox、BP Pulse、ChargePoint、台达电子、Electrify America、EVgo、施耐德电机、西门子电动车和壳牌。这些企业正透过对互通性、先进电源管理和基础设施部署的策略性投资来巩固其市场地位。许多公司正在采用开放标准,以提高网路间的兼容性并确保用户无缝存取。与公用事业公司和汽车製造商的合作对于扩展併网解决方案和加速充电桩部署至关重要。企业也正在整合人工智慧驱动的分析技术,以优化充电桩性能、预测需求并提高能源效率。增强网路安全、负载平衡能力和车网互动技术正被优先考虑,以满足监管要求并支援电网稳定运行。
目录
第一章:方法论
- 市场范围和定义
- 研究设计
- 研究方法
- 资料收集方法
- 资料探勘来源
- 全球的
- 地区/国家
- 基准估算和计算
- 基准年计算
- 市场估算的关键趋势
- 初步研究和验证
- 原始资料
- 预报
- 研究假设和局限性
第二章:执行概要
第三章:行业洞察
- 产业生态系分析
- 供应商格局
- 利润率分析
- 成本结构
- 每个阶段的价值增加
- 影响价值链的因素
- 中断
- 产业影响因素
- 成长驱动因素
- 电动车普及率上升和充电基础设施建设加速推进
- 向智慧、电网互动式充电的转变日益明显。
- 政府对公共和半公共充电设施建设的激励措施
- 产业陷阱与挑战
- 基础设施安装成本高且电网整合复杂
- 充电器、OCPP 标准和计费系统之间存在互通性差距
- 市场机会
- 人工智慧赋能的充电优化和预测性负载管理的发展
- 漫游网路和跨运营商计费互通性的需求不断增长
- 成长驱动因素
- 成长潜力分析
- 监管环境
- 北美洲
- 欧洲
- 亚太地区
- 拉丁美洲
- 中东和非洲
- 波特的分析
- PESTEL分析
- 技术与创新格局
- 当前技术趋势
- 新兴技术
- 价格趋势
- 按地区
- 副产品
- 生产统计
- 生产中心
- 消费中心
- 进出口
- 成本細項分析
- 专利分析
- 永续性和环境方面
- 碳足迹评估
- 循环经济一体化
- 电子垃圾管理要求
- 绿色製造倡议
- 原料和关键部件依赖性分析
- 碳化硅 (SiC) 和氮化镓 (GaN) 供应前景
- 铜、稀土磁铁和PCB依赖性
- 2025-2034年价格波动预测
- 回收和二次利用的机会
- 客户购买行为和采购趋势
- CPO、车队、零售和公用事业买家群体
- 决策标准排序(总拥有成本、正常运作时间、互通性、品牌)
- 转向交钥匙解决方案和框架协议
- 漫游枢纽和平台黏性的影响
- 通路和分销策略分析
- 直销、经销商销售和电气批发商销售路线
- 系统整合商和EPC合作伙伴的崛起
- 线上配置器和电子商务渗透率
- 区域频道主导地位
第四章:竞争格局
- 介绍
- 公司市占率分析
- 北美洲
- 欧洲
- 亚太地区
- 拉丁美洲
- MEA
- 主要市场参与者的竞争分析
- 竞争定位矩阵
- 战略展望矩阵
- 关键进展
- 併购
- 合作伙伴关係与合作
- 新产品发布
- 扩张计划和资金
第五章:市场估算与预测:依组件划分,2021-2034年
- 主要趋势
- 硬体
- 交流充电器(1级/2级)
- 直流快速充电器(50千瓦)
- 直流超快充电器(=150千瓦)
- 充电桩/充电站(室内/室外)
- 软体
- 充电桩管理系统(CPMS)
- 能源管理与负载平衡软体
- 支付、计费和漫游平台
- 遥测、OTA、韧体和网路安全
- 出行应用(预订、路线规划)
- 服务
- 安装与调试
- 维运/管理服务
- 网站设计及电网连接服务
- 车队及场地优化(咨询)
- 计费即服务 (CaaS) 和订阅
第六章:市场估算与预测:依充电器划分,2021-2034年
- 主要趋势
- 交流充电器
- 慢速(=3.7 千瓦)
- 半快速(3.7-22 千瓦)
- 快速(单相/三相 2 级)
- 直流充电器
- 快速直流电(25-150千瓦)
- 超高速直流电(=150千瓦)
- 兆瓦级充电(适用于重型车辆)
第七章:市场估算与预测:依部署方式划分,2021-2034年
- 主要趋势
- 住宅
- 商业的
第八章:市场估算与预测:依车辆类型划分,2021-2034年
- 主要趋势
- 搭乘用车
- 掀背车
- 轿车
- SUV
- 商用车辆
- 轻型商用车(LCV)
- 中型商用车(MCV)
- 重型商用车(HCV)
第九章:市场估计与预测:依地区划分,2021-2034年
- 主要趋势
- 北美洲
- 我们
- 加拿大
- 欧洲
- 德国
- 英国
- 法国
- 义大利
- 西班牙
- 北欧
- 俄罗斯
- 亚太地区
- 中国
- 印度
- 日本
- 澳洲
- 韩国
- 新加坡
- 马来西亚
- 泰国
- 拉丁美洲
- 巴西
- 墨西哥
- 阿根廷
- MEA
- 南非
- 沙乌地阿拉伯
- 阿联酋
第十章:公司简介
- Charging Network Operators (CPOs)
- Blink Charging
- ChargePoint
- EnBW
- EVgo
- Fastned
- IONITY
- Mercedes-Benz
- Rivian
- Shell
- Tesla
- Volkswagen
- BP Pulse
- Electrify America
- EVBox
- Schneider Electric
- Charging Hardware & Infrastructure Manufacturers
- ABB E-mobility
- BYD
- Delta Electronics
- Eaton
- FreeWire Technologies
- Kempower
- Siemens
- StarCharge
- Tritium
- Wallbox
- Software Platforms & Network Management
- Ampeco
- Gireve
- Hubject
- Monta
- Energy Utilities, Integrated Charging Providers
- Ample
- E.ON
- Enel (Enel X Way)
- Momentum Dynamics
The Global Smart EV Charging Networks Market was valued at USD 8.1 billion in 2024 and is estimated to grow at a CAGR of 18.8% to reach USD 47.2 billion by 2034.
Market expansion is closely linked to the acceleration of electric mobility and the adoption of digitally coordinated charging ecosystems. Network operators are increasingly integrating intelligent load management systems, real-time analytics, and cloud-driven platforms to enhance charger performance, strengthen grid interaction, and improve overall user experience. As transportation electrification grows, demand is rising for optimized charging capabilities and streamlined energy delivery. Grid modernization and fleet electrification continue to shape infrastructure priorities across smart charging networks. These systems facilitate real-time power balancing, demand response, storage optimization, and renewable energy integration. Technologies enabled by artificial intelligence, such as advanced energy orchestration, cybersecurity layers, vehicle-to-grid functions, and predictive operations support scalable and resilient ecosystems. Collaboration among utilities, charging network providers, and manufacturers is accelerating deployment, while standardized protocols and roaming agreements are paving the way for broader interoperability. Predictive analytics, combined with policy-driven investment, is expected to spur new service models in charging and energy management.
| Market Scope | |
|---|---|
| Start Year | 2024 |
| Forecast Year | 2025-2034 |
| Start Value | $8.1 Billion |
| Forecast Value | $47.2 Billion |
| CAGR | 18.8% |
The hardware segment held 73% share in 2024. Physical infrastructure remains fundamental to network expansion, as the projected need for large numbers of charging ports continues to rise. Lower-powered AC chargers make up the majority of required units, with approximately 26.8 million of the anticipated 28 million chargers expected to serve residential, workplace, and community charging needs.
The passenger vehicles segment held an 88% share in 2024, fueled by increasing consumer adoption of electric cars, driving demand for both home-based and public charging. Residential AC charging and workplace installations support day-to-day commuting needs, while smart charging platforms allow users to manage consumption, schedule charging sessions, and utilize dynamic pricing features that reduce energy costs and alleviate stress on local grids.
United States Smart EV Charging Networks Market held a 89.7% share, generating USD 856.9 million in 2024. Strong policy support at both state and federal levels continues to propel adoption, with national legislation allocating substantial resources toward expanding charging infrastructure and enhancing grid capacity. Rising EV sales are reinforcing the need for widespread charging availability across public and private locations.
Key companies in the Smart EV Charging Networks Market include ABB E-mobility, EVBox, BP Pulse, ChargePoint, Delta Electronics, Electrify America, EVgo, Schneider Electric, Siemens eMobility, and Shell. Companies in the Smart EV Charging Networks Market are strengthening their foothold through strategic investments in interoperability, advanced power management, and expanded infrastructure deployment. Many firms are adopting open standards to improve compatibility across networks and ensure seamless user access. Partnerships with utilities and automakers are becoming central to scaling grid-connected solutions and accelerating charger rollout. Businesses are also integrating AI-powered analytics to optimize charger performance, forecast demand, and improve energy efficiency. Enhanced cybersecurity, load-balancing capabilities, and vehicle-to-grid technologies are being prioritized to meet regulatory expectations and support grid stability.
Table of Contents
Chapter 1 Methodology
- 1.1 Market scope and definition
- 1.2 Research design
- 1.2.1 Research approach
- 1.2.2 Data collection methods
- 1.3 Data mining sources
- 1.3.1 Global
- 1.3.2 Regional/Country
- 1.4 Base estimates and calculations
- 1.4.1 Base year calculation
- 1.4.2 Key trends for market estimation
- 1.5 Primary research and validation
- 1.5.1 Primary sources
- 1.6 Forecast
- 1.7 Research assumptions and limitations
Chapter 2 Executive Summary
- 2.1 Industry 3600 synopsis, 2021 - 2034
- 2.2 Key market trends
- 2.2.1 Regional
- 2.2.2 Component
- 2.2.3 Charger
- 2.2.4 Deployment
- 2.2.5 Vehicle
- 2.3 TAM Analysis, 2025-2034
- 2.4 CXO perspectives: Strategic imperatives
- 2.4.1 Executive decision points
- 2.4.2 Critical success factors
- 2.5 Future outlook and strategic recommendations
Chapter 3 Industry Insights
- 3.1 Industry ecosystem analysis
- 3.1.1 Supplier landscape
- 3.1.2 Profit margin analysis
- 3.1.3 Cost structure
- 3.1.4 Value addition at each stage
- 3.1.5 Factor affecting the value chain
- 3.1.6 Disruptions
- 3.2 Industry impact forces
- 3.2.1 Growth drivers
- 3.2.1.1 Rising EV adoption and accelerated charging infrastructure rollout
- 3.2.1.2 Growing shift toward smart, grid-interactive charging
- 3.2.1.3 Government incentives for public and semi-public charging deployments
- 3.2.2 Industry pitfalls and challenges
- 3.2.2.1 High infrastructure installation cost & complex grid integration
- 3.2.2.2 Interoperability gaps across chargers, OCPP standards & billing systems
- 3.2.3 Market opportunities
- 3.2.3.1 Growth of AI-enabled charging optimization & predictive load management
- 3.2.3.2 Rising demand for roaming networks & cross-operator charging interoperability
- 3.2.1 Growth drivers
- 3.3 Growth potential analysis
- 3.4 Regulatory landscape
- 3.4.1 North America
- 3.4.2 Europe
- 3.4.3 Asia Pacific
- 3.4.4 Latin America
- 3.4.5 Middle East & Africa
- 3.5 Porter's analysis
- 3.6 Pestel analysis
- 3.7 Technology and innovation landscape
- 3.7.1 Current technological trends
- 3.7.2 Emerging technologies
- 3.8 Price trends
- 3.8.1 By region
- 3.8.2 By product
- 3.9 Production statistics
- 3.9.1 Production hubs
- 3.9.2 Consumption hubs
- 3.9.3 Export and import
- 3.10 Cost breakdown analysis
- 3.11 Patent analysis
- 3.12 Sustainability & environmental aspects
- 3.12.1 Carbon footprint assessment
- 3.12.2 Circular economy integration
- 3.12.3 E-waste management requirements
- 3.12.4 Green manufacturing initiatives
- 3.13 Raw material and critical component dependency analysis
- 3.13.1 Silicon carbide (SiC) and gallium nitride (GaN) supply outlook
- 3.13.2 Copper, rare-earth magnets, and PCB dependency
- 3.13.3 Price volatility forecast 2025-2034
- 3.13.4 Recycling and second-life opportunities
- 3.14 Customer buying behavior and procurement trends
- 3.14.1 CPO vs. fleet vs. retail vs. utility buyer segments
- 3.14.2 Decision criteria ranking (TCO, uptime, interoperability, brand)
- 3.14.3 Shift toward turnkey solutions and framework agreements
- 3.14.4 Influence of roaming hubs and platform stickiness
- 3.15 Channel and distribution strategy analysis
- 3.15.1 Direct sales vs. distributor vs. electrical wholesaler routes
- 3.15.2 Rise of system integrators and EPC partners
- 3.15.3 Online configurators and e-commerce penetration
- 3.15.4 Regional channel dominance
Chapter 4 Competitive Landscape, 2024
- 4.1 Introduction
- 4.2 Company market share analysis
- 4.2.1 North America
- 4.2.2 Europe
- 4.2.3 Asia Pacific
- 4.2.4 LATAM
- 4.2.5 MEA
- 4.3 Competitive analysis of major market players
- 4.4 Competitive positioning matrix
- 4.5 Strategic outlook matrix
- 4.6 Key developments
- 4.6.1 Mergers & acquisitions
- 4.6.2 Partnerships & collaborations
- 4.6.3 New product launches
- 4.6.4 Expansion plans and funding
Chapter 5 Market Estimates & Forecast, By Component, 2021 - 2034 ($Mn, Units)
- 5.1 Key trends
- 5.2 Hardware
- 5.2.1 AC chargers (Level 1 / Level 2)
- 5.2.2 DC fast chargers (50 kW)
- 5.2.3 DC ultra-fast chargers (=150 kW)
- 5.2.4 Charge points / charging stations (indoor/outdoor)
- 5.3 Software
- 5.3.1 Charge point management systems (CPMS)
- 5.3.2 Energy management & load-balancing software
- 5.3.3 Payment, billing & roaming platforms
- 5.3.4 Telemetry, OTA, firmware & cybersecurity
- 5.3.5 Mobility apps (reservation, routing)
- 5.4 Services
- 5.4.1 Installation & commissioning
- 5.4.2 Operation & maintenance (O&M) / managed services
- 5.4.3 Site design & grid connection services
- 5.4.4 Fleet & site optimization (consulting)
- 5.4.5 Charging-as-a-Service (CaaS) and subscriptions
Chapter 6 Market Estimates & Forecast, By Charger, 2021 - 2034 ($Mn, Units)
- 6.1 Key trends
- 6.2 AC Chargers
- 6.2.1 Slow (=3.7 kW)
- 6.2.2 Semi-fast (3.7-22 kW)
- 6.2.3 Fast (single-phase / three-phase Level 2)
- 6.3 DC Chargers
- 6.3.1 Fast DC (25-150 kW)
- 6.3.2 Ultra-fast DC (=150 kW)
- 6.3.3 Megawatt charging (for heavy vehicles)
Chapter 7 Market Estimates & Forecast, By Deployment, 2021 - 2034 ($Mn, Units)
- 7.1 Key trends
- 7.2 Residential
- 7.3 Commercial
Chapter 8 Market Estimates & Forecast, By Vehicle, 2021 - 2034 ($Mn, Units)
- 8.1 Key trends
- 8.2 Passenger Cars
- 8.2.1 Hatchback
- 8.2.2 Sedan
- 8.2.3 SUV
- 8.3 Commercial vehicles
- 8.3.1 Light commercial vehicles (LCV)
- 8.3.2 Medium commercial vehicles (MCV)
- 8.3.3 Heavy commercial vehicles (HCV)
Chapter 9 Market Estimates & Forecast, By Region, 2021 - 2034 ($Mn, Units)
- 9.1 Key trends
- 9.2 North America
- 9.2.1 US
- 9.2.2 Canada
- 9.3 Europe
- 9.3.1 Germany
- 9.3.2 UK
- 9.3.3 France
- 9.3.4 Italy
- 9.3.5 Spain
- 9.3.6 Nordics
- 9.3.7 Russia
- 9.4 Asia Pacific
- 9.4.1 China
- 9.4.2 India
- 9.4.3 Japan
- 9.4.4 Australia
- 9.4.5 South Korea
- 9.4.6 Singapore
- 9.4.7 Malaysia
- 9.4.8 Thailand
- 9.5 Latin America
- 9.5.1 Brazil
- 9.5.2 Mexico
- 9.5.3 Argentina
- 9.6 MEA
- 9.6.1 South Africa
- 9.6.2 Saudi Arabia
- 9.6.3 UAE
Chapter 10 Company Profiles
- 10.1 Charging Network Operators (CPOs)
- 10.1.1 Blink Charging
- 10.1.2 ChargePoint
- 10.1.3 EnBW
- 10.1.4 EVgo
- 10.1.5 Fastned
- 10.1.6 IONITY
- 10.1.7 Mercedes-Benz
- 10.1.8 Rivian
- 10.1.9 Shell
- 10.1.10 Tesla
- 10.1.11 Volkswagen
- 10.1.12 BP Pulse
- 10.1.13 Electrify America
- 10.1.14 EVBox
- 10.1.15 Schneider Electric
- 10.2 Charging Hardware & Infrastructure Manufacturers
- 10.2.1 ABB E-mobility
- 10.2.2 BYD
- 10.2.3 Delta Electronics
- 10.2.4 Eaton
- 10.2.5 FreeWire Technologies
- 10.2.6 Kempower
- 10.2.7 Siemens
- 10.2.8 StarCharge
- 10.2.9 Tritium
- 10.2.10 Wallbox
- 10.3 Software Platforms & Network Management
- 10.3.1 Ampeco
- 10.3.2 Gireve
- 10.3.3 Hubject
- 10.3.4 Monta
- 10.4 Energy Utilities, Integrated Charging Providers
- 10.4.1 Ample
- 10.4.2 E.ON
- 10.4.3 Enel (Enel X Way)
- 10.4.4 Momentum Dynamics
 下一代电动车充电网路市场预测:至2034年-全球分析(按充电器类型、输出功率、连接器类型、车辆型号、安装类型、连接方式、应用、最终用户和地区划分)
 电动车充电站市场(含广告看板):依广告形式、充电器类型、安装位置、网路类型和最终用户划分,全球预测,2026-2032年电动车充电主动滤波器按充电站类型、滤波器配置、额定输出功率和最终用户划分,全球预测,2026-2032年电动车充电滤波器市场按滤波器类型、滤波器拓扑结构、额定电流、应用和最终用户划分-全球预测,2026-2032年电动车智慧充电控制器市场:按充电等级、模式、通讯技术、交付方式、车辆类型、应用和最终用户划分-2026-2032年全球预测
 日本电动车充电设备市场占有率分析、产业趋势及统计、成长预测(2026-2031)
 日本电动车充电设备市场规模、份额、趋势及预测(按充电站、最终用途和地区划分,2026-2034年)电动汽车家用充电套件市场预测至2032年:按充电器类型、连接器类型、车辆类型、安装类型、分销管道、应用和地区分類的全球分析
 超快速电动车充电(350kW+)系统市场机会、成长驱动因素、产业趋势分析及2025-2034年预测美国电动车 (EV) 充电:市场占有率分析、行业趋势和成长预测(2025-2030 年)