


 |
市场调查报告书
商品编码
1892690
电动货车改装套件市场机会、成长驱动因素、产业趋势分析及预测(2025-2034年)Electric Van Conversion Kits Market Opportunity, Growth Drivers, Industry Trend Analysis, and Forecast 2025 - 2034 |
||||||
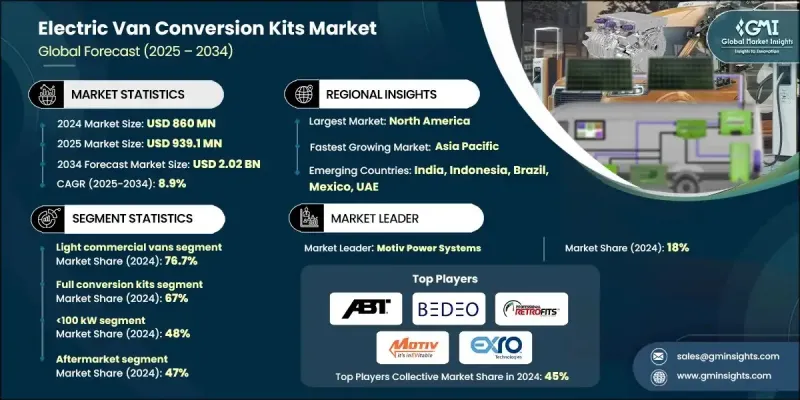
2024 年全球电动货车改装套件市场价值为 8.6 亿美元,预计到 2034 年将以 8.9% 的复合年增长率增长至 20.2 亿美元。
远端资讯处理、物联网系统和现代车队管理软体的进步,使营运商能够透过改进路线规划、电池利用率和维护计划来优化车辆使用。随着技术的演进,改装套件本身也在不断改进,从而支持向灵活所有权模式的转变。许多车队营运商正从一次性购买转向订阅和按需付费模式,使他们能够以最小的前期资本将货车改装成电动车。这些财务模式使每月支出更加可预测,并使车队营运商(尤其是小型企业)能够根据营运需求的变化进行扩展。硬体供应商和数位服务平台之间日益增强的整合进一步推动了向电动出行的更广泛转变,使营运商能够更容易获得交钥匙电气化解决方案。随着市场加速发展,电动货车改装正成为寻求降低排放、提高效率和改善城市和区域运输路线营运控制的组织的实用且经济高效的途径。
| 市场范围 | |
|---|---|
| 起始年份 | 2024 |
| 预测年份 | 2025-2034 |
| 起始值 | 8.6亿美元 |
| 预测值 | 20.2亿美元 |
| 复合年增长率 | 8.9% |
2024年,轻型商用车市占率达76.7%,预计2025年至2034年间将以9.6%的复合年增长率成长。这一市场主导地位得益于轻型商用车典型使用週期与当前纯电动车辆性能的契合,其日常行驶里程和有效载荷需求均符合现代电动货车的性能标准。随着低排放区准入范围的扩大和营运成本的降低,以及主要地区总体拥有成本的持续下降,电动货车的普及率将进一步提升。
2024年,全套改装套件市占率达到67%,预计2025年至2034年将以10%的复合年增长率成长。全电动改装套件正朝着模组化、平台无关的设计方向发展,从而缩短安装时间并扩大与各种厢型车车型的兼容性。基于标准化高压组件构建的整合电池和马达系统,结合远端资讯处理支援的诊断功能,正在提高车队的利用率,并增强电气化在最后一公里配送和城市配送应用中的吸引力。
2024年,美国电动货车改装套件市场规模达2.571亿美元。企业强而有力的永续发展目标,以及联邦和州政府日益严格的排放法规,正促使车队采用改装套件,将其作为购买全新电动货车的一种经济高效的替代方案。政府资金、税收优惠和补助金等措施,帮助中小企业快速转型,也促使市政当局和物流供应商更加依赖改造升级来满足合规期限要求。
目录
第一章:方法论
第二章:执行概要
第三章:行业洞察
- 产业生态系分析
- 供应商格局
- 利润率
- 成本结构
- 每个阶段的价值增加
- 影响价值链的因素
- 中断
- 产业影响因素
- 成长驱动因素
- 偏好灵活移动而非所有权
- 电动车普及率不断提高,车队电气化程度也不断提高。
- 企业车队需求不断成长
- 连网汽车和远端资讯处理技术的进步
- 产业陷阱与挑战
- 高额资本投资
- 监理和保险方面的挑战
- 市场机会
- 新兴城市市场的扩张
- 与智慧城市和旅游即服务 (MaaS) 平台集成
- 包含保险和维护的捆绑服务
- 专业电动车和商用车解决方案
- 成长驱动因素
- 成长潜力分析
- 监管环境
- 全球的
- 美国环保署替代燃料转换法规
- 美国国家公路交通安全管理局 (NHTSA) 机动车辆安全标准 (FMVSS 305a)
- CARB认证要求
- 基于年龄的认证途径
- 北美洲
- 欧洲
- 亚太地区
- 拉丁美洲
- 中东和非洲
- 全球的
- 波特的分析
- PESTEL 分析
- 技术与创新格局
- 当前技术趋势
- 电池技术演进(NMC、LFP、固态电池路线图)
- 马达和逆变器技术的进步(线圈驱动技术、效率提升)
- 热管理系统(被动冷却与主动冷却)
- 新兴技术
- 车辆控制单元(VCU)及软体架构
- 再生煞车优化
- 模组化和可扩展的电池配置
- 整合充电解决方案(车载充电器整合)
- 当前技术趋势
- 定价分析
- 按车辆类别分類的改装套件价格
- 电池组成本趋势
- 安装人工成本结构
- 充电基础设施成本(二级充电与直流快速充电)
- 成本細項分析
- 专利分析
- 动力总成整合专利
- 电池封装和热管理专利
- 电子齿轮和线圈驱动器技术专利(Exro)
- 充电介面和通讯协定专利
- 永续性和环境方面
- 永续实践
- 减少废弃物策略
- 生产中的能源效率
- 环保倡议
- 碳足迹考量
- 用例
- 最佳情况
- 投资与融资分析
- 联邦基础设施资金(NEVI、CFI 计画)
- IRA製造业奖励措施和OBBBA修改
- 州和地区拨款项目(HVIP、NYTVIP、德克萨斯州)
- 对转换技术公司的私人投资
- 充电基础设施集成
- 充电站设计及场地规划
- 公用事业协调与互联时间表
- 管理式充电策略
- 充电器与车辆的兼容性(CCS、J1772、功率位准)
- 车辆平台适用性及验证
- 平台选择标准
- 福特全顺平台分析
- RAM ProMaster平台分析
- GM Express/Savana平台分析
第四章:竞争格局
- 介绍
- 公司市占率分析
- 北美洲
- 欧洲
- 亚太地区
- 拉丁美洲
- MEA
- 主要市场参与者的竞争分析
- 竞争定位矩阵
- 战略展望矩阵
- 关键进展
- 併购
- 合作伙伴关係与合作
- 新产品发布
- 扩张计划和资金
- 产品和服务基准测试
- 研发投资分析
- 供应商选择标准
第五章:市场估价与预测:依车辆类型划分,2021-2034年
- 轻型商用车
- 中型商用车
- 重型商用车辆
第六章:市场估算与预测:依转换率划分,2021-2034年
- 全电动改装套件
- 油电改装套件
第七章:市场估算与预测:以推进方式划分,2021-2034年
- 小于 100 千瓦
- 100-200千瓦
- 大于200千瓦
第八章:市场估算与预测:依最终用途划分,2021-2034年
- 商业车队营运商
- 物流和配送公司
- 市政当局
- 公用事业和服务提供者
- 中小企业
第九章:市场估算与预测:依销售管道划分,2021-2034年
- OEM改装套件
- 售后改装套件
- 认证改造商
第十章:市场估计与预测:依地区划分,2021-2034年
- 北美洲
- 我们
- 加拿大
- 欧洲
- 德国
- 英国
- 法国
- 义大利
- 西班牙
- 北欧
- 俄罗斯
- 波兰
- 罗马尼亚
- 亚太地区
- 中国
- 印度
- 日本
- 韩国
- 澳新银行
- 越南
- 印尼
- 拉丁美洲
- 巴西
- 墨西哥
- 阿根廷
- MEA
- 南非
- 沙乌地阿拉伯
- 阿联酋
第十一章:公司简介
- 全球公司
- ABT e-Line
- BEDEO
- Contravans
- E-Drive Retrofits
- EV West
- Lightning eMotors
- Motiv Power Systems
- REE Automotive
- Ricardo
- SEA Electric (Exro)
- 区域玩家
- BisonEV Retrofits
- Efficient Drivetrains Inc. (EDI)
- Hyliion
- Logan Bus Company
- Odyne Systems
- Optimal EV
- Phoenix Motorcars
- TransPower
- Unique Electric Solutions
- US Hybrid
- 新兴玩家
- Arrival
- Bollinger Motors
- Canoo
- Chanje
- Electric Last Mile Solutions (ELMS)
- GreenPower Motor Company
- Harbinger Motors
- Proterra
- Rivian (Commercial Van Division)
- Vicinity Motor Corp
The Global Electric Van Conversion Kits Market was valued at USD 860 million in 2024 and is estimated to grow at a CAGR of 8.9% to reach USD 2.02 billion by 2034.
Advancements in telematics, IoT systems, and modern fleet-management software are enabling operators to optimize vehicle usage by improving route planning, battery utilization, and maintenance scheduling. Conversion kits themselves are becoming more advanced as technology evolves, supporting the shift toward flexible ownership models. Many fleet operators are moving from outright purchasing to subscription and pay-per-use options, allowing them to convert vans to electric power with minimal upfront capital. These financial models create more predictable monthly expenses and allow fleet operators, especially smaller businesses, to scale as operational needs change. The broader shift toward electric mobility is further supported by increasing integration between hardware providers and digital service platforms, giving operators greater access to turnkey electrification solutions. As the market accelerates, electric van conversions are becoming a practical and cost-effective pathway for organizations seeking lower emissions, higher efficiency, and improved operational control across urban and regional transport routes.
| Market Scope | |
|---|---|
| Start Year | 2024 |
| Forecast Year | 2025-2034 |
| Start Value | $860 Million |
| Forecast Value | $2.02 Billion |
| CAGR | 8.9% |
The light commercial vans segment held a 76.7% share in 2024 and is anticipated to grow at a 9.6% CAGR through 2025-2034. This dominance is supported by the alignment between typical light-commercial duty cycles and current battery-electric capabilities, with daily mileage requirements and payload needs fitting within contemporary electric van performance profiles. Expanding access to low-emission zones and favorable operating costs further strengthen adoption as the total cost of ownership continues to improve across key regions.
The full conversion kits segment held a 67% share in 2024 and is expected to grow at a CAGR of 10% from 2025 to 2034. Fully electric conversion packages are moving toward modular, platform-agnostic engineering that shortens installation times and broadens compatibility across various van models. Integrated battery and motor systems built around standardized high-voltage components, combined with telematics-supported diagnostics, are increasing utilization rates for fleets and enhancing the appeal of electrification for last-mile and urban delivery applications.
US Electric Van Conversion Kits Market reached USD 257.1 million in 2024. Strong corporate sustainability targets, paired with federal and state emissions requirements, are motivating fleets to adopt conversion kits as a cost-effective alternative to purchasing new electric vans. Government funding, tax incentives, and grants assist small and mid-sized organizations in transitioning quickly, prompting municipalities and logistics providers to rely more heavily on retrofitting to meet compliance timelines.
Key companies active in the Electric Van Conversion Kits Market include ABT e-Line, BEDEO, Contravans, E-Drive Retrofits, EV West, Motiv Power Systems, REE Automotive, Ricardo, and SEA Electric (Exro). Companies in the Electric Van Conversion Kits Market are strengthening their market position by developing modular, standardized platforms that work across multiple vehicle types, reducing installation complexity and shortening fleet downtime. Many firms are expanding service partnerships with fleet operators to offer bundled packages that include conversion hardware, software integration, maintenance, and telematics support. Subscriptions and leasing programs are becoming central strategies, allowing customers to adopt electrification with reduced upfront costs.
Table of Contents
Chapter 1 Methodology
- 1.1 Market scope and definition
- 1.2 Research design
- 1.2.1 Research approach
- 1.2.2 Data collection methods
- 1.3 Data mining sources
- 1.3.1 Global
- 1.3.2 Regional/Country
- 1.4 Base estimates and calculations
- 1.4.1 Base year calculation
- 1.4.2 Key trends for market estimation
- 1.5 Primary research and validation
- 1.5.1 Primary sources
- 1.6 Forecast model
- 1.7 Research assumptions and limitations
Chapter 2 Executive Summary
- 2.1 Industry 360° synopsis
- 2.2 Key market trends
- 2.2.1 Regional
- 2.2.2 Vehicle
- 2.2.3 Conversion
- 2.2.4 Propulsion
- 2.2.5 End Use
- 2.2.6 Sales channel
- 2.3 TAM analysis, 2025-2034
- 2.4 CXO perspectives: Strategic imperatives
- 2.4.1 Executive decision points
- 2.4.2 Critical success factors
- 2.5 Future outlook
- 2.6 Strategic recommendations
Chapter 3 Industry Insights
- 3.1 Industry ecosystem analysis
- 3.1.1 Supplier landscape
- 3.1.2 Profit margin
- 3.1.3 Cost structure
- 3.1.4 Value addition at each stage
- 3.1.5 Factor affecting the value chain
- 3.1.6 Disruptions
- 3.2 Industry impact forces
- 3.2.1 Growth drivers
- 3.2.1.1 Preference for flexible mobility over ownership
- 3.2.1.2 Growing EV adoption and fleet electrification
- 3.2.1.3 Rising corporate fleet demand
- 3.2.1.4 Connected vehicle and telematics advancements
- 3.2.2 Industry pitfalls and challenges
- 3.2.2.1 High capital investment
- 3.2.2.2 Regulatory and insurance challenges
- 3.2.3 Market opportunities
- 3.2.3.1 Expansion in emerging urban markets
- 3.2.3.2 Integration with smart cities and MaaS platforms
- 3.2.3.3 Bundled services with insurance and maintenance
- 3.2.3.4 Specialized EV and commercial vehicle solutions
- 3.2.1 Growth drivers
- 3.3 Growth potential analysis
- 3.4 Regulatory landscape
- 3.4.1 Global
- 3.4.1.1 EPA alternative fuel conversion regulations
- 3.4.1.2 NHTSA FMVSS standards (FMVSS 305a)
- 3.4.1.3 CARB certification requirements
- 3.4.1.4 Age-based certification pathways
- 3.4.2 North America
- 3.4.3 Europe
- 3.4.4 Asia Pacific
- 3.4.5 Latin America
- 3.4.6 Middle East & Africa
- 3.4.1 Global
- 3.5 Porter's analysis
- 3.6 PESTEL analysis
- 3.7 Technology and innovation landscape
- 3.7.1 Current technological trends
- 3.7.1.1 Battery technology evolution (NMC, LFP, solid-state roadmap)
- 3.7.1.2 Motor & inverter advancements (coil driver tech, efficiency gains)
- 3.7.1.3 Thermal management systems (passive vs active cooling)
- 3.7.2 Emerging technologies
- 3.7.2.1 Vehicle control unit (VCU) & software architecture
- 3.7.2.2 Regenerative braking optimization
- 3.7.2.3 Modular & scalable battery configurations
- 3.7.2.4 Integrated charging solutions (on-board charger integration)
- 3.7.1 Current technological trends
- 3.8 Pricing analysis
- 3.8.1 Conversion kit pricing by vehicle class
- 3.8.2 Battery pack cost trends
- 3.8.3 Installation labor cost structure
- 3.8.4 Charging infrastructure costs (Level 2 vs DC fast charging)
- 3.9 Cost breakdown analysis
- 3.10 Patent analysis
- 3.10.1 Powertrain integration patents
- 3.10.2 Battery packaging & thermal management patents
- 3.10.3 Electronic gearing & coil driver technology patents (Exro)
- 3.10.4 Charging interface & communication protocol patents
- 3.11 Sustainability and environmental aspects
- 3.11.1 Sustainable practices
- 3.11.2 Waste reduction strategies
- 3.11.3 Energy efficiency in production
- 3.11.4 Eco-friendly initiatives
- 3.11.5 Carbon footprint considerations
- 3.12 Use cases
- 3.13 Best case scenario
- 3.14 Investment & funding analysis
- 3.14.1 Federal infrastructure funding (NEVI, CFI programs)
- 3.14.2 IRA manufacturing incentives & OBBBA modifications
- 3.14.3 State & regional grant programs (HVIP, NYTVIP, Texas)
- 3.14.4 Private investment in conversion technology companies
- 3.15 Charging infrastructure integration
- 3.15.1 Depot charging design & site planning
- 3.15.2 Utility coordination & interconnection timelines
- 3.15.3 Managed charging strategies
- 3.15.4 Charger-vehicle compatibility (CCS, J1772, power levels)
- 3.16 Vehicle platform suitability & validation
- 3.16.1 Platform selection criteria
- 3.16.2 Ford Transit platform analysis
- 3.16.3 RAM ProMaster platform analysis
- 3.16.4 GM Express/Savana platform analysis
Chapter 4 Competitive Landscape, 2024
- 4.1 Introduction
- 4.2 Company market share analysis
- 4.2.1 North America
- 4.2.2 Europe
- 4.2.3 Asia Pacific
- 4.2.4 LATAM
- 4.2.5 MEA
- 4.3 Competitive analysis of major market players
- 4.4 Competitive positioning matrix
- 4.5 Strategic outlook matrix
- 4.6 Key developments
- 4.6.1 Mergers & acquisitions
- 4.6.2 Partnerships & collaborations
- 4.6.3 New product launches
- 4.6.4 Expansion plans and funding
- 4.7 Product and service benchmarking
- 4.8 R&D investment analysis
- 4.9 Vendor selection criteria
Chapter 5 Market Estimates & Forecast, By Vehicle, 2021 - 2034 ($Mn, Units)
- 5.1 Key trends
- 5.2 Light commercial vehicles
- 5.3 Medium commercial vehicles
- 5.4 Heavy commercial vehicles
Chapter 6 Market Estimates & Forecast, By Conversion, 2021 - 2034 ($Mn, Units)
- 6.1 Key trends
- 6.2 Fully electric conversion kits
- 6.3 Hybrid electric conversion kits
Chapter 7 Market Estimates & Forecast, By Propulsion, 2021 - 2034 ($Mn, Units)
- 7.1 Key trends
- 7.2 < 100 kW
- 7.3 100-200 kW
- 7.4 >200 kW
Chapter 8 Market Estimates & Forecast, By End Use, 2021 - 2034 ($Mn, Units)
- 8.1 Key trends
- 8.2 Commercial fleet operators
- 8.3 Logistics & delivery companies
- 8.4 Municipal authorities
- 8.5 Utility & service providers
- 8.6 Small & medium enterprises
Chapter 9 Market Estimates & Forecast, By Sales Channel, 2021 - 2034 ($Mn, Units)
- 9.1 Key trends
- 9.2 OEM conversion kits
- 9.3 Aftermarket conversion kits
- 9.4 Certified retrofitters
Chapter 10 Market Estimates & Forecast, By Region, 2021 - 2034 ($Mn, Units)
- 10.1 Key trends
- 10.2 North America
- 10.2.1 US
- 10.2.2 Canada
- 10.3 Europe
- 10.3.1 Germany
- 10.3.2 UK
- 10.3.3 France
- 10.3.4 Italy
- 10.3.5 Spain
- 10.3.6 Nordics
- 10.3.7 Russia
- 10.3.8 Poland
- 10.3.9 Romania
- 10.4 Asia Pacific
- 10.4.1 China
- 10.4.2 India
- 10.4.3 Japan
- 10.4.4 South Korea
- 10.4.5 ANZ
- 10.4.6 Vietnam
- 10.4.7 Indonesia
- 10.5 Latin America
- 10.5.1 Brazil
- 10.5.2 Mexico
- 10.5.3 Argentina
- 10.6 MEA
- 10.6.1 South Africa
- 10.6.2 Saudi Arabia
- 10.6.3 UAE
Chapter 11 Company Profiles
- 11.1 Global companies
- 11.1.1 ABT e-Line
- 11.1.2 BEDEO
- 11.1.3 Contravans
- 11.1.4 E-Drive Retrofits
- 11.1.5 EV West
- 11.1.6 Lightning eMotors
- 11.1.7 Motiv Power Systems
- 11.1.8 REE Automotive
- 11.1.9 Ricardo
- 11.1.10 SEA Electric (Exro)
- 11.2 Regional players
- 11.2.1 BisonEV Retrofits
- 11.2.2 Efficient Drivetrains Inc. (EDI)
- 11.2.3 Hyliion
- 11.2.4 Logan Bus Company
- 11.2.5 Odyne Systems
- 11.2.6 Optimal EV
- 11.2.7 Phoenix Motorcars
- 11.2.8 TransPower
- 11.2.9 Unique Electric Solutions
- 11.2.10 US Hybrid
- 11.3 Emerging players
- 11.3.1 Arrival
- 11.3.2 Bollinger Motors
- 11.3.3 Canoo
- 11.3.4 Chanje
- 11.3.5 Electric Last Mile Solutions (ELMS)
- 11.3.6 GreenPower Motor Company
- 11.3.7 Harbinger Motors
- 11.3.8 Proterra
- 11.3.9 Rivian (Commercial Van Division)
- 11.3.10 Vicinity Motor Corp
 电动车底盘域控制单元市场按控制架构、车辆类型、底盘功能、自动驾驶等级和作业系统划分 - 全球预测(2026-2032 年)
 欧洲厢型车市场-份额分析、产业趋势与统计、成长预测(2026-2031)
 厢型车市场机会、成长驱动因素、产业趋势分析及预测(2026-2035年)
 厢型车市场-全球产业规模、份额、趋势、机会和预测(按吨位、推进类型、最终用途、地区和竞争细分,2020-2030 年预测)
 2032 年厢型车改装市场预测:按车型、尺寸、改装、应用、最终用户和地区进行的全球分析北美厢型车:市场占有率分析、产业趋势与统计数据、成长预测(2025-2030 年)美国货车:市场占有率分析、行业趋势和统计数据、成长预测(2025-2030 年)
 货车市场规模、份额、趋势分析报告:按吨位、推进器、最终用途、地区、细分市场预测,2025-2030 年