


 |
市场调查报告书
商品编码
1892874
厢型车市场机会、成长驱动因素、产业趋势分析及预测(2026-2035年)Vans Market Opportunity, Growth Drivers, Industry Trend Analysis, and Forecast 2026 - 2035 |
||||||
2025 年全球厢型车市场价值为 3,253 亿美元,预计到 2035 年将以 7.3% 的复合年增长率增长至 6,501 亿美元。
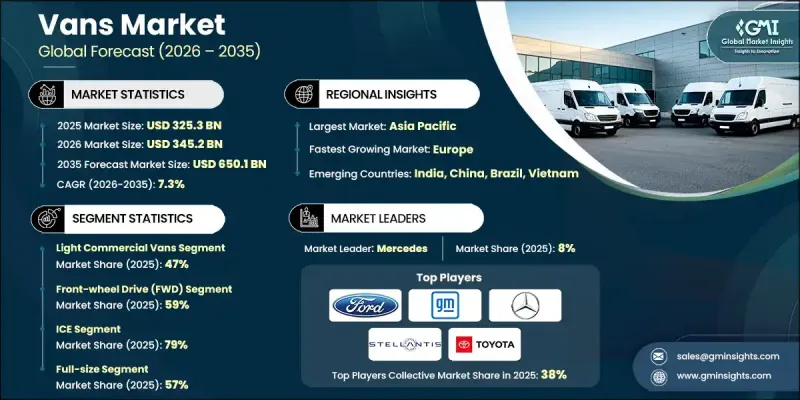
该市场涵盖轻型商用货车、货运货车和客运货车,为物流、医疗保健、酒店、政府营运和电子商务等众多行业提供支援。企业依靠这些车辆实现灵活高效的出行,而车队远端资讯处理、互联互通和数据驱动管理系统的进步正在重塑营运绩效。儘管电动货车的初始投资较高,但其更低的能源和维护成本使其成为车队越来越青睐的选择。市场发展受到监管压力、不断变化的客户期望以及车辆技术进步的影响。快速电气化、自动驾驶和互联繫统的日益融合以及最后一公里配送网路的转型等趋势正在深刻影响产品开发和车队策略。永续发展目标、政府激励措施以及对营运效率的重视,持续加速全球市场向电动货车平台的转型。
| 市场范围 | |
|---|---|
| 起始年份 | 2025 |
| 预测年份 | 2026-2035 |
| 起始值 | 3253亿美元 |
| 预测值 | 6501亿美元 |
| 复合年增长率 | 7.3% |
轻型商用货车在2025年占据了47%的市场份额,预计2026年至2035年将以7.6%的复合年增长率成长。这些货车的总重通常在6,000至10,000磅之间,兼具燃油经济性、有效载荷能力和操控性,非常适合在人口密集的城市道路上行驶。包括Rivian、福特汽车、梅赛德斯-奔驰和通用汽车在内的领先製造商正在推出专为配送和服务应用而设计的新型电动车型,进一步推动了该细分市场向电气化转型的强劲势头。
2025年,前轮驱动(FWD)汽车市占率将达到59%,预计2035年将以7.2%的年均复合成长率成长。前轮驱动的优势在于其生产成本更低、燃油效率更高、在铺装路面上牵引力更强,以及优化了内部布局以增加可用载货空间。这些优势使得前轮驱动车型尤其适合注重成本控制和城市及郊区高效运输的配送车队和服务业者。
预计到2025年,中国厢型车市场份额将达到39%,这主要得益于车队需求的成长、国内庞大的产能以及电动轻型商用车的快速普及。中国的物流、服务和配送产业正在推动多功能厢型车的广泛应用,这些车型既适用于小型企业主,也适用于大型车队营运商。此外,促进清洁能源车辆、投资充电网路以及製定更严格的排放标准的政策措施,正在加速车队电气化进程,并激励企业升级到低排放厢型车。
目录
第一章:方法论
第二章:执行概要
第三章:行业洞察
- 产业生态系分析
- 供应商格局
- 利润率分析
- 成本结构
- 每个阶段的价值增加
- 影响价值链的因素
- 中断
- 产业影响因素
- 成长驱动因素
- 电子商务和最后一公里配送需求不断增长
- 都市化和基础设施改善
- 转向电动和低排放货车
- 中小企业 (SME) 的成长
- 车队管理与安全的技术进步
- 产业陷阱与挑战
- 电动和先进货车的初期成本较高
- 各地区的复杂法规
- 市场机会
- 电动货车普及率成长
- 电子商务配送需求不断成长
- 新兴市场的扩张
- 智慧车队管理技术的应用
- 成长潜力分析
- 监管环境
- 北美洲
- 美国:联邦机动车辆安全标准(FMVSS)
- 加拿大:加拿大机动车辆安全标准(CMVSS)
- 欧洲
- 德国:欧盟型式认可条例(EU)
- 英国:GB型式认证(英国脱欧后联合国欧洲经济委员会法规)
- 法国:欧盟货车二氧化碳排放性能标准(欧盟法规)
- 义大利:欧盟整车类型认证(WVTA)框架
- 亚太地区
- 中国:中国强制产品认证(CCC)- GB标准
- 印度:第六阶段(BS)排放标准
- 日本:国土交通省(MLIT)型式认可
- 韩国:韩国机动车安全标准(KMVSS)
- 拉丁美洲
- 巴西:CONTRAN车辆认证(环境与技术分析)
- 墨西哥:NOM(Norma Oficial Mexicana)安全与排放标准
- MEA
- 沙乌地阿拉伯:SASO(沙乌地阿拉伯标准、计量和品质组织)技术法规
- 北美洲
- 波特的分析
- PESTEL 分析
- 技术与创新格局
- 当前技术趋势
- 新兴技术
- 价格趋势
- 按地区
- 副产品
- 生产统计
- 生产中心
- 消费中心
- 进出口
- 成本細項分析
- 製造成本结构
- 研发成本分析
- 监理合规成本
- 分销和物流成本
- 行销和销售成本
- 专利分析
- 永续性和环境方面
- 永续实践
- 减少废弃物策略
- 生产中的能源效率
- 环保倡议
- 碳足迹考量
- 未来展望与机会
第四章:竞争格局
- 介绍
- 公司市占率分析
- 北美洲
- 欧洲
- 亚太地区
- 拉丁美洲
- MEA
- 主要市场参与者的竞争分析
- 竞争定位矩阵
- 战略展望矩阵
- 关键进展
- 併购
- 合作伙伴关係与合作
- 新产品发布
- 扩张计划和资金
第五章:市场估价与预测:依车辆类型划分,2022-2035年
- 轻型商用货车
- 客运货车
- 货车
第六章:市场估算与预测:以推进方式划分,2022-2035年
- 冰
- 电的
- 杂交种
第七章:市场规模估算与预测(2022-2035年)
- 袖珍的
- 中型
- 全尺寸
第八章:市场估算与预测:以驱动方式划分,2022-2035年
- 前轮驱动(FWD)
- 后轮驱动(RWD)
- 全轮驱动(AWD)/ 4x4
第九章:市场估算与预测:依最终用途划分,2022-2035年
- 物流与运输
- 电子商务与零售
- 公部门
- 卫生保健
- 饭店业
- 其他的
第十章:市场估计与预测:依地区划分,2022-2035年
- 北美洲
- 我们
- 加拿大
- 欧洲
- 德国
- 英国
- 法国
- 义大利
- 西班牙
- 俄罗斯
- 北欧
- 比荷卢经济联盟
- 亚太地区
- 中国
- 印度
- 日本
- 澳洲
- 韩国
- 新加坡
- 泰国
- 印尼
- 越南
- 拉丁美洲
- 巴西
- 墨西哥
- 阿根廷
- 哥伦比亚
- MEA
- 南非
- 沙乌地阿拉伯
- 阿联酋
第十一章:公司简介
- 全球参与者
- Ford Motor
- General Motors
- Hyundai Motor Company
- Mercedes-Benz
- Nissan
- Renault
- SAIC Motor
- Stellantis
- Tata Motors
- Toyota Motor
- 区域玩家
- Ashok Leyland
- Foton Motor
- Isuzu
- Iveco
- JMC
- Mahindra & Mahindra
- Maxus
- Rivian
- Emerging Technology Innovators
- Arrival
- BYD
- Canoo
- Wuling Motors
The Global Vans Market was valued at USD 325.3 billion in 2025 and is estimated to grow at a CAGR of 7.3% to reach USD 650.1 billion by 2035.
This market includes light commercial vans, cargo vans, and passenger vans that support a wide range of activities across logistics, healthcare, hospitality, government operations, and e-commerce. Businesses rely on these vehicles for flexible and cost-efficient mobility, and advancements in fleet telematics, connectivity, and data-driven management systems are reshaping operational performance. Although electric vans involve a higher initial investment, their lower energy and maintenance costs are making them an increasingly favorable option for fleets. Market evolution is being shaped by regulatory pressures, shifting customer expectations, and advances in vehicle technologies. Trends such as rapid electrification, growing integration of autonomous and connected systems, and the transformation of last-mile delivery networks are heavily influencing product development and fleet strategies. Sustainability goals, government incentives, and an emphasis on operational efficiency continue to accelerate the transition toward electric van platforms across global markets.
| Market Scope | |
|---|---|
| Start Year | 2025 |
| Forecast Year | 2026-2035 |
| Start Value | $325.3 Billion |
| Forecast Value | $650.1 Billion |
| CAGR | 7.3% |
The light commercial vans category held a 47% share in 2025 and is expected to grow at a CAGR of 7.6% from 2026 to 2035. These vans, typically within the 6,000 to 10,000-pound GVWR range, offer a practical mix of fuel economy, payload capabilities, and maneuverability suitable for dense urban corridors. Leading manufacturers, including Rivian, Ford Motor, Mercedes, and GM, are rolling out new electric designs built specifically for delivery and service applications, reinforcing the segment's strong shift toward electrification.
The front-wheel drive (FWD) vehicles segment held 59% share in 2025 and is forecast to grow at a rate of 7.2% through 2035. Their appeal stems from benefits such as reduced production costs, enhanced fuel efficiency, improved traction on paved streets, and optimized interior layouts that increase usable cargo space. These advantages make FWD configurations particularly well-suited for delivery fleets and service operators focused on cost control and efficient mobility in urban and suburban landscapes.
China Vans Market held a 39% share in 2025, supported by rising fleet demand, extensive domestic production capacity, and accelerating adoption of electric light commercial vehicles. The country's logistics, service, and delivery sectors are driving widespread use of versatile van models designed for both small business owners and large-scale fleet operators. Policy measures promoting cleaner vehicles, investment in charging networks, and stricter emission standards are speeding up fleet electrification and motivating companies to upgrade to low-emission vans.
Major companies active in the Global Vans Market include Ford Motor, Hyundai Motor, Nissan, SAIC Motor, Renault, Stellantis, Tata Motors, Toyota Motor, Mercedes, and General Motors. Companies in the Vans Market are strengthening their competitive position through a combination of strategic initiatives. Many automakers are accelerating investments in electric platforms to meet rising sustainability requirements and appeal to fleet operators seeking lower total cost of ownership. Firms are expanding their connected vehicle ecosystems, enabling real-time diagnostics, predictive maintenance, and performance optimization for large fleets. Collaborations with logistics providers and technology partners are helping companies integrate advanced driver-assistance systems and autonomous capabilities into van lineups.
Table of Contents
Chapter 1 Methodology
- 1.1 Market scope and definition
- 1.2 Research design
- 1.2.1 Research approach
- 1.2.2 Data collection methods
- 1.3 Data mining sources
- 1.3.1 Global
- 1.3.2 Regional/Country
- 1.4 Base estimates and calculations
- 1.4.1 Base year calculation
- 1.4.2 Key trends for market estimation
- 1.5 Primary research and validation
- 1.5.1 Primary sources
- 1.6 Forecast model
- 1.7 Research assumptions and limitations
Chapter 2 Executive Summary
- 2.1 Industry 360° synopsis, 2022 - 2035
- 2.2 Key market trends
- 2.2.1 Regional
- 2.2.2 Vehicle
- 2.2.3 Propulsion
- 2.2.4 Size
- 2.2.5 Drive
- 2.2.6 End Use
- 2.3 TAM Analysis, 2026-2035
- 2.4 CXO perspectives: Strategic imperatives
- 2.4.1 Executive decision points
- 2.4.2 Critical success factors
- 2.5 Future outlook and strategic recommendations
Chapter 3 Industry Insights
- 3.1 Industry ecosystem analysis
- 3.1.1 Supplier landscape
- 3.1.2 Profit margin analysis
- 3.1.3 Cost structure
- 3.1.4 Value addition at each stage
- 3.1.5 Factor affecting the value chain
- 3.1.6 Disruptions
- 3.2 Industry impact forces
- 3.2.1.1 Growth drivers
- 3.2.1.2 Rising e-commerce and last-mile delivery demand
- 3.2.1.3 Urbanization and improved infrastructure
- 3.2.1.4 Shift towards electric and low-emission vans
- 3.2.1.5 Growth of small and medium enterprises (SMEs)
- 3.2.1.6 Technological advancements in fleet management and safety
- 3.2.2 Industry pitfalls and challenges
- 3.2.2.1 High upfront costs of electric and advanced vans
- 3.2.2.2 Complex regulations across regions
- 3.2.3 Market opportunities
- 3.2.3.1 Growth in electric van adoption
- 3.2.3.2 Rising demand from e-commerce deliveries
- 3.2.3.3 Expansion in emerging markets
- 3.2.3.4 Use of smart fleet management technologies
- 3.3 Growth potential analysis
- 3.4 Regulatory landscape
- 3.4.1 North America
- 3.4.1.1 US: Federal Motor Vehicle Safety Standards (FMVSS)
- 3.4.1.2 Canada: Canada Motor Vehicle Safety Standards (CMVSS)
- 3.4.2 Europe
- 3.4.2.1 Germany: EU Type Approval Regulation (EU) 2018/858
- 3.4.2.2 UK: GB Type Approval (Post-Brexit UNECE Regulations)
- 3.4.2.3 France: EU CO2 Emission Performance Standards for Vans (Regulation EU 2019/631)
- 3.4.2.4 Italy: EU Whole Vehicle Type Approval (WVTA) Framework
- 3.4.3 Asia Pacific
- 3.4.3.1 China: China Compulsory Certification (CCC) - GB Standards
- 3.4.3.2 India: Bharat Stage (BS) VI Emission Standards
- 3.4.3.3 Japan: Ministry of Land, Infrastructure, Transport and Tourism (MLIT) Type Approval
- 3.4.3.4 South Korea: Korea Motor Vehicle Safety Standards (KMVSS)
- 3.4.4 Latin America
- 3.4.4.1 Brazil: CONTRAN Vehicle Homologation (Environmental & Technical Analysis)
- 3.4.4.2 Mexico: NOM (Norma Oficial Mexicana) Safety & Emissions Standards
- 3.4.5 MEA
- 3.4.5.1 Saudi Arabia: SASO (Saudi Standards, Metrology and Quality Organization) Technical Regulations
- 3.4.1 North America
- 3.5 Porter's analysis
- 3.6 PESTEL analysis
- 3.7 Technology and innovation landscape
- 3.7.1 Current technological trends
- 3.7.2 Emerging technologies
- 3.8 Price trends
- 3.8.1 By region
- 3.8.2 By product
- 3.9 Production statistics
- 3.9.1 Production hubs
- 3.9.2 Consumption hubs
- 3.9.3 Export and import
- 3.10 Cost breakdown analysis
- 3.10.1 Manufacturing cost structure
- 3.10.2 R&D cost analysis
- 3.10.3 Regulatory compliance costs
- 3.10.4 Distribution & logistics costs
- 3.10.5 Marketing & sales costs
- 3.11 Patent analysis
- 3.12 Sustainability and environmental aspects
- 3.12.1 Sustainable practices
- 3.12.2 Waste reduction strategies
- 3.12.3 Energy efficiency in production
- 3.12.4 Eco-friendly Initiatives
- 3.12.5 Carbon footprint considerations
- 3.13 Future outlook and opportunities
Chapter 4 Competitive Landscape, 2025
- 4.1 Introduction
- 4.2 Company market share analysis
- 4.2.1 North America
- 4.2.2 Europe
- 4.2.3 Asia Pacific
- 4.2.4 LATAM
- 4.2.5 MEA
- 4.3 Competitive analysis of major market players
- 4.4 Competitive positioning matrix
- 4.5 Strategic outlook matrix
- 4.6 Key developments
- 4.6.1 Mergers & acquisitions
- 4.6.2 Partnerships & collaborations
- 4.6.3 New Product Launches
- 4.6.4 Expansion Plans and funding
Chapter 5 Market Estimates & Forecast, By Vehicle, 2022 2035 (USD Bn, Units)
- 5.1 Key trends
- 5.2 Light commercial vans
- 5.3 Passenger vans
- 5.4 Cargo vans
Chapter 6 Market Estimates & Forecast, By Propulsion, 2022 - 2035 (USD Bn, Units)
- 6.1 Key trends
- 6.2 ICE
- 6.3 Electric
- 6.4 Hybrid
Chapter 7 Market Estimates & Forecast, By Size, 2022 - 2035 (USD Bn, Units)
- 7.1 Key trends
- 7.2 Compact
- 7.3 Mid-size
- 7.4 Full-size
Chapter 8 Market Estimates & Forecast, By Drive, 2022 - 2035 (USD Bn, Units)
- 8.1 Key trends
- 8.2 Front-wheel drive (FWD)
- 8.3 Rear-wheel drive (RWD)
- 8.4 All-wheel drive (AWD) / 4x4
Chapter 9 Market Estimates & Forecast, By End Use, 2022 - 2035 (USD Bn, Units)
- 9.1 Key trends
- 9.2 Logistics & transportation
- 9.3 Ecommerce & retail
- 9.4 Public sector
- 9.5 Healthcare
- 9.6 Hospitality
- 9.7 Others
Chapter 10 Market Estimates & Forecast, By Region, 2022 - 2035 (USD Mn, Units)
- 10.1 Key trends
- 10.2 North America
- 10.2.1 US
- 10.2.2 Canada
- 10.3 Europe
- 10.3.1 Germany
- 10.3.2 UK
- 10.3.3 France
- 10.3.4 Italy
- 10.3.5 Spain
- 10.3.6 Russia
- 10.3.7 Nordics
- 10.3.8 Benelux
- 10.4 Asia Pacific
- 10.4.1 China
- 10.4.2 India
- 10.4.3 Japan
- 10.4.4 Australia
- 10.4.5 South Korea
- 10.4.6 Singapore
- 10.4.7 Thailand
- 10.4.8 Indonesia
- 10.4.9 Vietnam
- 10.5 Latin America
- 10.5.1 Brazil
- 10.5.2 Mexico
- 10.5.3 Argentina
- 10.5.4 Colombia
- 10.6 MEA
- 10.6.1 South Africa
- 10.6.2 Saudi Arabia
- 10.6.3 UAE
Chapter 11 Company Profiles
- 11.1 Global Players
- 11.1.1 Ford Motor
- 11.1.2 General Motors
- 11.1.3 Hyundai Motor Company
- 11.1.4 Mercedes-Benz
- 11.1.5 Nissan
- 11.1.6 Renault
- 11.1.7 SAIC Motor
- 11.1.8 Stellantis
- 11.1.9 Tata Motors
- 11.1.10 Toyota Motor
- 11.2 Regional Players
- 11.2.1 Ashok Leyland
- 11.2.2 Foton Motor
- 11.2.3 Isuzu
- 11.2.4 Iveco
- 11.2.5 JMC
- 11.2.6 Mahindra & Mahindra
- 11.2.7 Maxus
- 11.2.8 Rivian
- 11.3 Emerging Technology Innovators
- 11.3.1 Arrival
- 11.3.2 BYD
- 11.3.3 Canoo
- 11.3.4 Wuling Motors
 电动车底盘域控制单元市场按控制架构、车辆类型、底盘功能、自动驾驶等级和作业系统划分 - 全球预测(2026-2032 年)
 欧洲厢型车市场-份额分析、产业趋势与统计、成长预测(2026-2031)
 电动货车改装套件市场机会、成长驱动因素、产业趋势分析及预测(2025-2034年)
 厢型车市场-全球产业规模、份额、趋势、机会和预测(按吨位、推进类型、最终用途、地区和竞争细分,2020-2030 年预测)
 2032 年厢型车改装市场预测:按车型、尺寸、改装、应用、最终用户和地区进行的全球分析北美厢型车:市场占有率分析、产业趋势与统计数据、成长预测(2025-2030 年)美国货车:市场占有率分析、行业趋势和统计数据、成长预测(2025-2030 年)
 货车市场规模、份额、趋势分析报告:按吨位、推进器、最终用途、地区、细分市场预测,2025-2030 年