


 |
市场调查报告书
商品编码
1892696
消费性电子设备光子计算组件市场机会、成长驱动因素、产业趋势分析及预测(2025-2034年)Photonic Computing Components for Consumer Devices Market Opportunity, Growth Drivers, Industry Trend Analysis, and Forecast 2025 - 2034 |
||||||
2024 年全球消费性设备光子运算组件市场价值为 4.85 亿美元,预计到 2034 年将以 18.5% 的复合年增长率成长至 25.5 亿美元。
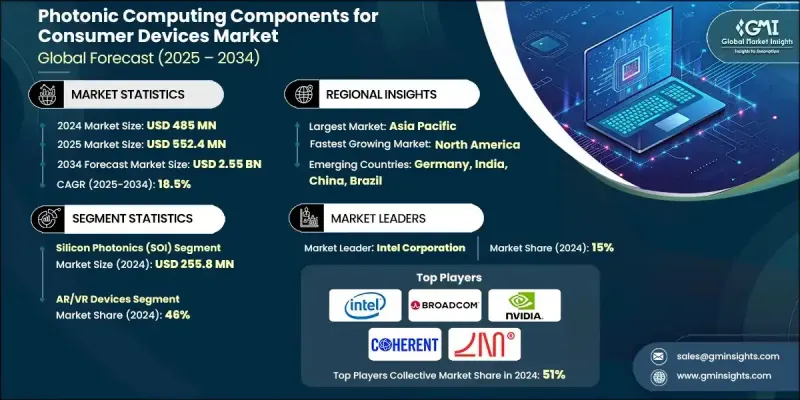
消费性电子产品中人工智慧工作负载日益增长的运算需求推动了光子计算加速器的应用,进而促进了市场成长。各国政府和研究机构正大力投资光子系统,以克服传统电子人工智慧处理器的固有限制。不断增长的资料生成和处理需求,尤其是在需要高频宽的设备中,进一步推动了市场发展。 5G 的部署和 6G 技术的开发,也为支援更快的连接速度创造了对光子组件的额外需求。此外,利用成熟的 CMOS 製造製程降低了生产成本,使得光子解决方案能够在消费性电子产品中得到更快、更广泛的应用,进而提升设备的效能、效率和紧凑性。
| 市场范围 | |
|---|---|
| 起始年份 | 2024 |
| 预测年份 | 2025-2034 |
| 起始值 | 4.85亿美元 |
| 预测值 | 25.5亿美元 |
| 复合年增长率 | 18.5% |
2024年,硅光子学(SOI)领域创造了2.558亿美元的收入。 SOI平台具有高整合度和卓越性能,可将数千个组件嵌入到小于10平方毫米的晶片上。这种紧凑的设计提高了消费性电子设备的效率和效能,实现了更快的资料传输和更低的功耗。
预计到2024年,AR/VR设备市场将占据46%的份额。这些设备需要高速资料处理、极低延迟和紧凑的外形尺寸,因此成为光子运算元件的主要应用领域。轻巧的AR眼镜和VR头显由于对尺寸和重量的严格限制,能够显着受益于光子解决方案,在提升用户体验的同时提供高性能。
美国消费性电子设备光子计算组件市占率高达74.9%。该国的成长得益于对先进计算技术的巨额投资以及主要行业参与者的存在。政府的各项倡议,包括对量子和光子技术研究的专项资助,进一步巩固了美国在该领域的领先地位,并推动了消费电子设备的创新。
目录
第一章:方法论与范围
第二章:执行概要
第三章:行业洞察
- 产业生态系分析
- 供应商格局
- 利润率
- 每个阶段的价值增加
- 影响价值链的因素
- 产业影响因素
- 成长驱动因素
- 对高速资料处理的需求
- 能源效率和热管理
- 整合光子学和小型化技术的进步
- 产业陷阱与挑战
- 成本高且製造流程复杂
- 与现有电子架构的兼容性
- 机会
- 人工智慧和边缘运算加速
- 新兴的扩增实境/虚拟实境与元宇宙应用
- 成长驱动因素
- 成长潜力分析
- 未来市场趋势
- 技术与创新格局
- 当前技术趋势
- 新兴技术
- 监管环境
- 标准和合规要求
- 区域监理框架
- 认证标准
- 差距分析
- 风险评估与缓解
- 波特的分析
- PESTEL 分析
- 消费者行为分析
- 购买模式
- 偏好分析
- 消费者行为的区域差异
第四章:竞争格局
- 介绍
- 公司市占率分析
- 按地区
- 公司矩阵分析
- 主要市场参与者的竞争分析
- 竞争定位矩阵
- 关键进展
- 併购
- 合作伙伴关係与合作
- 新产品发布
- 扩张计划
第五章:市场估计与预测:依技术平台划分,2021-2034年
- 硅光子学(SOI)
- 薄膜铌酸锂(TFLN/LNOI)
- 氮化硅(SiN/Si3N4)
- 磷化铟(InP)
- 其他新兴平台技术
第六章:市场估算与预测:依组件功能划分,2021-2034年
- 光波导
- 光调製器
- 光电探测器
- 光源
- 光开关和路由组件
- 耦合与介面元件
第七章:市场估算与预测:依消费性电子设备应用划分,2021-2034年
- AR/VR设备
- 智慧型手机和平板电脑
- 汽车系统
- 穿戴式装置
- 游戏系统
- 物联网和边缘设备
- 其他的
第八章:市场估算与预测:依地区划分,2021-2034年
- 北美洲
- 我们
- 加拿大
- 欧洲
- 德国
- 法国
- 英国
- 义大利
- 西班牙
- 俄罗斯
- 亚太地区
- 中国
- 印度
- 日本
- 韩国
- 澳洲
- 拉丁美洲
- 巴西
- 墨西哥
- MEA
- 南非
- 沙乌地阿拉伯
- 阿联酋
第九章:公司简介
- Analog Photonics
- Ayar Labs Inc.
- Broadcom Inc.
- Cisco Systems Inc.
- Coherent Corp.
- Intel Corporation
- Lightmatter Inc.
- LIGENTEC SA
- Marvell Technology Inc.
- NVIDIA Corporation
- PICadvanced
- PsiQuantum
- Q.ANT
- Salience Labs
- Xanadu Quantum Technologies
The Global Photonic Computing Components for Consumer Devices Market was valued at USD 485 million in 2024 and is estimated to grow at a CAGR of 18.5% to reach USD 2.55 billion by 2034.
Growth is driven by the increasing computational demands of artificial intelligence workloads on consumer electronics, which are fueling the adoption of photonic computing accelerators. Governments and research organizations are investing heavily in photonic systems to overcome the inherent limitations of traditional electronic AI processors. Rising data generation and processing requirements, particularly in devices requiring high bandwidth, are further propelling the market. The rollout of 5G and the development of 6G technologies are creating additional demand for photonic components to support faster connectivity. Moreover, leveraging established CMOS manufacturing processes has reduced production costs, allowing faster and broader adoption of photonic solutions across consumer electronics, enhancing the performance, efficiency, and compactness of devices.
| Market Scope | |
|---|---|
| Start Year | 2024 |
| Forecast Year | 2025-2034 |
| Start Value | $485 Million |
| Forecast Value | $2.55 Billion |
| CAGR | 18.5% |
The silicon photonics (SOI) segment generated USD 255.8 million in 2024. SOI platforms provide high integration density and superior performance, allowing thousands of components to be embedded on chips smaller than 10mm2. This compact design improves efficiency and performance in consumer devices, enabling faster data transfer and lower power consumption.
The AR/VR devices segment held a 46% share in 2024. These devices require high-speed data processing, minimal latency, and compact form factors, making them prime consumers of photonic computing components. Lightweight AR glasses and VR headsets benefit significantly from photonic solutions due to stringent size and weight constraints, enhancing the user experience while delivering high performance.
U.S. Photonic Computing Components for Consumer Devices Market held 74.9% share. The country's growth is supported by substantial investments in advanced computing technologies and the presence of key industry players. Government initiatives, including dedicated funding for research in quantum and photonic technologies, further strengthen the U.S. position, enabling innovation in consumer devices.
Key companies in the Global Photonic Computing Components for Consumer Devices Market for consumer devices include Broadcom Inc., Lightmatter Inc., Intel Corporation, Coherent Corp., Analog Photonics, Marvell Technology Inc., Cisco Systems Inc., LIGENTEC SA, Ayar Labs Inc., PsiQuantum, PICadvanced, NVIDIA Corporation, Q.ANT, Salience Labs, and Xanadu Quantum Technologies. Companies in the Photonic Computing Components for Consumer Devices Market are focusing on innovation, strategic partnerships, and ecosystem development to strengthen their position. They invest heavily in R&D to enhance the efficiency, speed, and integration density of photonic components. Collaborations with consumer electronics and semiconductor manufacturers help secure long-term adoption in high-demand devices. Leveraging scalable CMOS manufacturing reduces costs and accelerates production. Firms are expanding geographically and building robust supply chains while emphasizing energy efficiency and compactness in their products.
Table of Contents
Chapter 1 Methodology & Scope
- 1.1 Market scope and definition
- 1.2 Research design
- 1.2.1 Research approach
- 1.2.2 Data collection methods
- 1.3 Data mining sources
- 1.3.1 Global
- 1.3.2 Regional
- 1.4 Base estimates and calculations
- 1.4.1 Base year calculation
- 1.4.2 Key trends for market estimation
- 1.5 Primary research and validation
- 1.5.1 Primary sources
- 1.6 Forecast model
- 1.7 Research assumptions and limitations
Chapter 2 Executive Summary
- 2.1 Industry 360° synopsis
- 2.2 Key market trends
- 2.2.1 Regional
- 2.2.2 Technology platform
- 2.2.3 Component function
- 2.2.4 Consumer device application
- 2.3 CXO perspectives: Strategic imperatives
- 2.3.1 Key decision points for industry executives
- 2.3.2 Critical success factors for market players
- 2.4 Future outlook and strategic recommendations
Chapter 3 Industry Insights
- 3.1 Industry ecosystem analysis
- 3.1.1 Supplier landscape
- 3.1.2 Profit margin
- 3.1.3 Value addition at each stage
- 3.1.4 Factor affecting the value chain
- 3.2 Industry impact forces
- 3.2.1 Growth drivers
- 3.2.1.1 Demand for high-speed data processing
- 3.2.1.2 Energy efficiency and thermal management
- 3.2.1.3 Advancements in integrated photonics and miniaturization
- 3.2.2 Industry pitfalls & challenges
- 3.2.2.1 High cost and manufacturing complexity
- 3.2.2.2 Compatibility with existing electronic architectures
- 3.2.3 Opportunities
- 3.2.3.1 AI and edge computing acceleration
- 3.2.3.2 Emerging AR/VR and metaverse applications
- 3.2.1 Growth drivers
- 3.3 Growth potential analysis
- 3.4 Future market trends
- 3.5 Technology and innovation landscape
- 3.5.1 Current technological trends
- 3.5.2 Emerging technologies
- 3.6 Regulatory landscape
- 3.6.1 Standards and compliance requirements
- 3.6.2 Regional regulatory frameworks
- 3.6.3 Certification standards
- 3.7 Gap analysis
- 3.8 Risk assessment and mitigation
- 3.9 Porter's analysis
- 3.10 PESTEL analysis
- 3.11 Consumer behaviour analysis
- 3.11.1 Purchasing patterns
- 3.11.2 Preference analysis
- 3.11.3 Regional variations in consumer behaviour
Chapter 4 Competitive Landscape, 2024
- 4.1 Introduction
- 4.2 Company market share analysis
- 4.2.1 By region
- 4.2.1.1 North America
- 4.2.1.2 Europe
- 4.2.1.3 Asia Pacific
- 4.2.1.4 Latin America
- 4.2.1.5 Middle East and Africa
- 4.2.1 By region
- 4.3 Company matrix analysis
- 4.4 Competitive analysis of major market players
- 4.5 Competitive positioning matrix
- 4.6 Key developments
- 4.6.1 Mergers & acquisitions
- 4.6.2 Partnerships & collaborations
- 4.6.3 New product launches
- 4.6.4 Expansion plans
Chapter 5 Market Estimates & Forecast, By Technology Platform, 2021-2034 (USD Million) (Thousand Units)
- 5.1 Key trends
- 5.2 Silicon photonics (SOI)
- 5.3 Thin-film lithium niobate (TFLN/LNOI)
- 5.4 Silicon nitride (SiN/Si3N4)
- 5.5 Indium phosphide (InP)
- 5.6 Others emerging platform technologies
Chapter 6 Market Estimates & Forecast, By Component Function, 2021-2034 (USD Million) (Thousand Units)
- 6.1 Key trends
- 6.2 Optical waveguides
- 6.3 Optical modulators
- 6.4 photodetectors
- 6.5 Light sources
- 6.6 Optical switches & routing components
- 6.7 Coupling & interface components
Chapter 7 Market Estimates & Forecast, By Consumer Device Application, 2021-2034 (USD Million) (Thousand Units)
- 7.1 Key trends
- 7.2 AR/VR devices
- 7.3 Smartphones & tablets
- 7.4 Automotive systems
- 7.5 Wearable devices
- 7.6 Gaming systems
- 7.7 IoT & edge devices
- 7.8 Others
Chapter 8 Market Estimates & Forecast, By Region, 2021-2034 (USD Million) (Thousand Units)
- 8.1 Key trends
- 8.2 North America
- 8.2.1 U.S.
- 8.2.2 Canada
- 8.3 Europe
- 8.3.1 Germany
- 8.3.2 France
- 8.3.3 UK
- 8.3.4 Italy
- 8.3.5 Spain
- 8.3.6 Russia
- 8.4 Asia Pacific
- 8.4.1 China
- 8.4.2 India
- 8.4.3 Japan
- 8.4.4 South Korea
- 8.4.5 Australia
- 8.5 Latin America
- 8.5.1 Brazil
- 8.5.2 Mexico
- 8.6 MEA
- 8.6.1 South Africa
- 8.6.2 Saudi Arabia
- 8.6.3 UAE
Chapter 9 Company Profiles
- 9.1 Analog Photonics
- 9.2 Ayar Labs Inc.
- 9.3 Broadcom Inc.
- 9.4 Cisco Systems Inc.
- 9.5 Coherent Corp.
- 9.6 Intel Corporation
- 9.7 Lightmatter Inc.
- 9.8 LIGENTEC SA
- 9.9 Marvell Technology Inc.
- 9.10 NVIDIA Corporation
- 9.11 PICadvanced
- 9.12 PsiQuantum
- 9.13 Q.ANT
- 9.14 Salience Labs
- 9.15 Xanadu Quantum Technologies
 全球光计算市场(2026-2036 年)全球量子光学计算市场(2026-2036 年)
 无线电频率积体电路(RFIC) 市场分析及至 2035 年预测:按类型、产品类型、技术、组件、应用、材料类型、装置、最终用户、功能和安装配置划分
 光子量子电脑市场可印刷光子电路市场分析及预测(至2035年):依类型、产品类型、技术、组件、应用、材料类型、装置、製程及最终用户划分
 2026年全球厚膜混合积体电路市场报告
 无线电频率积体电路市场-全球产业规模、份额、趋势、机会、预测:按应用、垂直市场、地区和竞争格局划分,2021-2031年
 低功耗蓝牙SoC晶片市场:按设定檔版本、整合类型、应用和最终用户产业划分-全球预测,2026-2032年全球光学量子运算平台市场(按组件、技术类型、部署类型、服务类型、应用和最终用户划分)预测(2026-2032年)
 蓝牙低功耗晶片-全球市占率及排名、总营收及需求预测(2025-2031年)