


 |
市场调查报告书
商品编码
1892733
多式联运枢纽市场机会、成长驱动因素、产业趋势分析及预测(2025-2034年)Intermodal Transportation Hubs Market Opportunity, Growth Drivers, Industry Trend Analysis, and Forecast 2025 - 2034 |
||||||
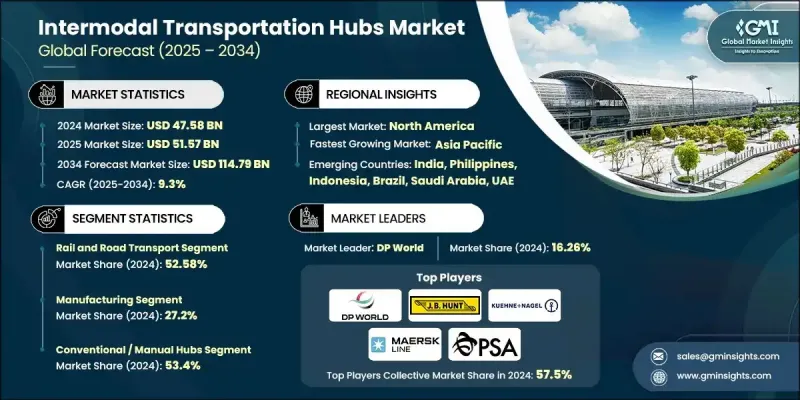
2024 年全球多式联运枢纽市场价值为 475.8 亿美元,预计到 2034 年将以 9.3% 的复合年增长率增长至 1147.9 亿美元。
全球货运系统正朝着无缝整合铁路、公路、航空和海运网络,建构协调物流生态系统的方向发展,这推动了货运成长。现代化的多式联运枢纽使货运业者、基础设施开发商和供应链组织能够更有效率地运输货物,减少对单一运输方式的依赖。这种模式降低了运输成本,缩短了交货时间,并提高了整体路线的灵活性。全球贸易活动的成长、跨境业务的扩张以及电子商务的加速发展,持续强化了对多模式连接的需求,而强大的数位追踪和顺畅的运输方式交接是支撑这一需求的关键。处理大批量工业物流的供应链也需要可靠且具弹性的路线,这进一步推动了对能够以更高透明度和可靠性管理复杂货物转运的枢纽的需求。全球永续发展目标、大规模基础设施升级以及对低排放物流的推动,进一步增强了这一趋势。清洁能源系统、电动车货运解决方案和关键矿产运输网路的快速发展,为长途货运优化创造了机会。多式联运节点结合了铁路和海运的效率以及公路运输的灵活性,有助于简化这些物流流程。
| 市场范围 | |
|---|---|
| 起始年份 | 2024 |
| 预测年份 | 2025-2034 |
| 起始值 | 475.8亿美元 |
| 预测值 | 1147.9亿美元 |
| 复合年增长率 | 9.3% |
2024年,铁路和公路运输市场份额为52.58%,预计到2034年将以9.6%的复合年增长率增长。该板块之所以保持主导地位,是因为铁路长途货运与公路灵活本地配送相结合,使营运商能够缩短运输时间并保持营运成本的可预测性。铁路连接仍然是工业走廊的核心,以稳定可靠的方式支持散装物料、製成品、零件和消费品的运输。
2024年,製造业市场占有率占27.2%,预计2025年至2034年将以9.4%的复合年增长率成长。製造商高度依赖多式联运枢纽来有效运输大量原料和成品。铁路、公路和港口整合网路有助于减少瓶颈、稳定交付进度,并改善机械、汽车、电子和重型设备等行业的成本控制。管理标准化货柜和重型货物的能力巩固了该行业的领先地位。
美国多式联运枢纽市场占85%的市场份额,预计2024年市场规模将达到139.7亿美元。持续投资于铁路运力扩建、码头自动化和港口基础设施现代化,正推动全美的强劲成长。区域内电子商务活动、製造业产出和跨境贸易的蓬勃发展,推动了对多模式连接的需求,以提高运输可视性并减少延误。包括物联网监控、基于RFID的货物追踪和整合物流软体在内的先进数位工具,正成为优化美国主要枢纽货物协调的关键。
目录
第一章:方法论
第二章:执行概要
第三章:行业洞察
- 产业生态系分析
- 供应商格局
- 利润率分析
- 成本结构
- 每个阶段的价值增加
- 影响价值链的因素
- 中断
- 产业影响因素
- 成长驱动因素
- 跨境贸易与全球供应链的快速扩张
- 政府增加铁路走廊、智慧港口和多模式物流园区的投资
- 电子商务和零售分销激增
- 工业走廊、经济特区和智慧城市建设的增加
- 永续发展和减排要求的提高
- 产业陷阱与挑战
- 码头建设和自动化方面的高额资本支出
- 多种运输方式之间的运作碎片化
- 市场机会
- 人工智慧驱动的终端作业系统(TOS)采用率上升
- 战略贸易走廊发展日益加强
- 电动化和自动化货物装卸设备的需求激增
- 数位海关、区块链和智慧门禁系统的部署日益增多
- 成长驱动因素
- 成长潜力分析
- 监管环境
- 波特的分析
- PESTEL 分析
- 技术与创新格局
- 当前技术趋势
- 货物装卸自动化与机器人技术
- 数位孪生与仿真技术
- 用于资产追踪的物联网和感测器网络
- 新兴技术
- 人工智慧与预测分析
- 用于文件和追溯的区块链
- 5G 连接和边缘运算
- 当前技术趋势
- 专利分析
- 价格趋势
- 按地区
- 按类型
- 成本細項分析
- 商业案例及投资报酬率分析
- 总拥有成本框架
- 投资报酬率计算方法
- 实施时间表和里程碑
- 风险评估与缓解策略
- 永续性和环境影响分析
- 永续实践
- 减少废弃物策略
- 生产中的能源效率
- 环保倡议
- 碳足迹考量
- 投资与融资分析
- 基础设施投资与就业法案 (IIJA) 的影响
- 公私合作(PPP)模式
- 私募股权和创投活动
- 绿色金融与永续发展挂钩的资金
- 基础设施容量利用率及瓶颈分析
- 港口拥挤指标与停留时间分析
- 铁路货运站容量限制
- 机箱可用性和池管理挑战
- 门控处理吞吐量限制
- 码头铁路运能与需求缺口
- 堆场利用率
- 高峰期激增容量需求
- 多式联运连接器瓶颈识别
- 陆侧可达性和首末公里基础设施连接
- 多式联运连接器计划(联邦公路管理局)投资重点
- 立体交叉路口和缓解交通拥堵项目
- 短程运输卡车运能及司机短缺
- 城市货运走廊和货车路线限制
- 铁路网路运能及一级铁路壅塞状况
- 短途铁路连通性和基础设施状况
- 专用货运走廊与高速铁路的衝突
- 电子商务的最后一公里配送基础设施3
第四章:竞争格局
- 介绍
- 公司市占率分析
- 主要市场参与者的竞争分析
- 竞争定位矩阵
- 战略展望矩阵
- 关键进展
- 併购
- 合作伙伴关係与合作
- 新产品发布
- 扩张计划和资金
第五章:市场估算与预测:依运输方式划分,2021-2034年
- 铁路和公路运输
- 航空和公路运输
- 海运和公路运输
- 其他的
第六章:市场估算与预测:依中心划分,2021-2034年
- 海港多式联运枢纽
- 铁路-公路联运站
- 内陆港/内陆货柜堆场(ICD)
- 航空货运多式联运枢纽
- 城市多式联运物流中心
第七章:市场估算与预测:依最终用途划分,2021-2034年
- 製造业
- 石油和天然气
- 建造
- 消费品和零售
- 汽车
- 食品和饮料
- 製药和医疗保健
- 其他的
第八章:市场估算与预测:依营运模式划分,2021-2034年
- 公共/政府运营
- 私营
- PPP(公私合营)
- 特许经营/BOT
- 第三方/第四方物流运营
第九章:市场估算与预测:依自动化程度划分,2021-2034年
- 传统/手动轮毂
- 半自动化枢纽
- 全自动
第十章:市场估算与预测:以吞吐量计算,2021-2034年
- 低容量
- 中型容量
- 高容量
- 巨型枢纽
第十一章:市场估计与预测:按地区划分,2021-2034年
- 北美洲
- 我们
- 加拿大
- 欧洲
- 德国
- 英国
- 法国
- 义大利
- 西班牙
- 俄罗斯
- 北欧
- 亚太地区
- 中国
- 印度
- 日本
- 澳洲
- 韩国
- 菲律宾
- 印尼
- 拉丁美洲
- 巴西
- 墨西哥
- 阿根廷
- MEA
- 南非
- 沙乌地阿拉伯
- 阿联酋
第十二章:公司简介
- 全球参与者
- APM Terminals (AP Moller-Maersk)
- BNSF Railway
- CH Robinson Worldwide
- Canadian National Railway
- China Merchants Port
- CMA CGM Terminal Link
- COSCO SHIPPING Ports
- DHL Global
- DP World
- Hutchison Ports
- JB Hunt Transport Services
- Kalmar
- Konecranes
- Kuehne + Nagel
- Maersk Line
- MSC Terminal & Logistics (TIL)
- Navis
- PSA International
- Union Pacific Railroad
- Zebra Technologies
- 区域玩家
- Georgia Ports Authority
- Mi-Jack Products
- Port of Los Angeles
- Port of Rotterdam
- Port of Singapore Authority (MPA)
- South Carolina Ports Authority
- Tideworks Technology
- Virginia Port Authority
- Norfolk Southern
- 新兴参与者
- Kaleris
- Portchain
- TuSimple
The Global Intermodal Transportation Hubs Market was valued at USD 47.58 billion in 2024 and is estimated to grow at a CAGR of 9.3% to reach USD 114.79 billion by 2034.
Growth is shaped by a worldwide shift toward freight systems that can seamlessly combine rail, road, air, and maritime networks into a coordinated logistics ecosystem. Modern intermodal hubs allow cargo operators, infrastructure developers, and supply chain organizations to move shipments more efficiently by reducing dependence on a single mode. This model lowers transportation expenses, shortens delivery windows, and increases overall routing flexibility. Rising global trade activity, expanding cross-border operations, and the acceleration of e-commerce continue to amplify the need for multimodal connectivity supported by strong digital tracking and smooth handoffs between transport modes. Supply chains that handle high-volume industrial flows also require dependable, resilient routes, pushing demand for hubs that can manage complex freight transitions with better visibility and reliability. Momentum is further reinforced by global sustainability goals, large-scale infrastructure upgrades, and the push for low-emission logistics. The rapid development of clean energy systems, electric vehicle freight solutions, and critical mineral transport networks is creating opportunities for long-distance freight optimization. Intermodal nodes help streamline these flows by combining the efficiency of rail and maritime transport with road-based flexibility for final delivery.
| Market Scope | |
|---|---|
| Start Year | 2024 |
| Forecast Year | 2025-2034 |
| Start Value | $47.58 Billion |
| Forecast Value | $114.79 Billion |
| CAGR | 9.3% |
The rail and road transport segment held a 52.58% share in 2024 and is projected to grow at a CAGR of 9.6% through 2034. This segment remains dominant because the combination of rail for long-distance freight and road for flexible local distribution allows operators to reduce transit time and keep operating costs predictable. Railroad connectivity remains central to industrial corridors, supporting the movement of bulk materials, manufactured goods, parts, and consumer products with consistent reliability.
The manufacturing segment held a 27.2% share in 2024 and is expected to grow at a CAGR of 9.4% from 2025 to 2034. Manufacturers rely heavily on intermodal hubs to move high volumes of raw materials and finished products efficiently. Integrated rail, road, and port networks help reduce bottlenecks, stabilize delivery schedules, and improve cost control for sectors including machinery, automotive, electronics, and heavy equipment. The ability to manage standardized containers and heavy freight loads strengthens the segment's leadership position.
US Intermodal Transportation Hubs Market held an 85% share, generating USD 13.97 billion in 2024. Continued investment in expanding rail capacity, automating terminals, and modernizing port infrastructure is driving strong adoption nationwide. Growing e-commerce activity, manufacturing output, and cross-border trade within the region are pushing demand for multimodal connectivity that improves visibility and reduces delays. Advanced digital tools, including IoT monitoring, RFID-based freight tracking, and integrated logistics software, are becoming central to optimizing cargo coordination across major US hubs.
Major companies active in the Global Intermodal Transportation Hubs Market include BNSF Railway, C.H. Robinson Worldwide, DHL Global, DP World, J.B. Hunt Transport Services, Kuehne + Nagel, Maersk Line, Norfolk Southern, PSA International, and Union Pacific Railroad. Companies competing in the Intermodal Transportation Hubs Market are strengthening their position by expanding multimodal infrastructure, enhancing cargo visibility technologies, and forming strategic partnerships with logistics providers. Many are investing in automated terminals, digital freight platforms, and analytics-driven routing tools that streamline container handling and accelerate turnaround times. Firms also prioritize integrating IoT tracking, smart yard management systems, and cloud-based coordination tools to improve transparency throughout the supply chain. Collaborative agreements with rail operators, port authorities, and trucking networks help optimize cross-modal transitions and stabilize capacity during peak demand.
Table of Contents
Chapter 1 Methodology
- 1.1 Market scope and definition
- 1.2 Research design
- 1.2.1 Research approach
- 1.2.2 Data collection methods
- 1.3 Data mining sources
- 1.3.1 Global
- 1.3.2 Regional/Country
- 1.4 Base estimates and calculations
- 1.4.1 Base year calculation
- 1.4.2 Key trends for market estimation
- 1.5 Primary research and validation
- 1.5.1 Primary sources
- 1.6 Forecast model
- 1.7 Research assumptions and limitations
Chapter 2 Executive Summary
- 2.1 Industry 360° synopsis, 2021 - 2034
- 2.2 Key market trends
- 2.2.1 Regional
- 2.2.2 Transportation mode
- 2.2.3 Hub
- 2.2.4 End Use
- 2.2.5 Operation Model
- 2.2.6 Automation Level
- 2.2.7 Throughput Capacity
- 2.3 TAM Analysis, 2026-2034
- 2.4 CXO perspectives: Strategic imperatives
- 2.4.1 Executive decision points
- 2.4.2 Critical success factors
- 2.5 Future outlook and strategic recommendations
Chapter 3 Industry Insights
- 3.1 Industry ecosystem analysis
- 3.1.1 Supplier landscape
- 3.1.2 Profit margin analysis
- 3.1.3 Cost structure
- 3.1.4 Value addition at each stage
- 3.1.5 Factor affecting the value chain
- 3.1.6 Disruptions
- 3.2 Industry impact forces
- 3.2.1 Growth drivers
- 3.2.1.1 Rapid expansion of cross-border trade & global supply chains
- 3.2.1.2 Increase in government investments in rail corridors, smart ports, and multimodal logistics parks
- 3.2.1.3 Surge in e-commerce and retail distribution
- 3.2.1.4 Increase in industrial corridors, SEZs, and smart city developments
- 3.2.1.5 Rise in sustainability and emission-reduction mandates
- 3.2.2 Industry pitfalls and challenges
- 3.2.2.1 High capital expenditure for terminal construction & automation
- 3.2.2.2 Operational fragmentation between multiple transport modes
- 3.2.3 Market opportunities
- 3.2.3.1 Rise in adoption of AI-driven terminal operating systems (TOS)
- 3.2.3.2 Increase in development of strategic trade corridors
- 3.2.3.3 Surge in demand for electrified and automated cargo-handling equipment
- 3.2.3.4 Rise in deployment of digital customs, blockchain, and smart gate systems
- 3.2.1 Growth drivers
- 3.3 Growth potential analysis
- 3.4 Regulatory landscape
- 3.4.1 North America
- 3.4.2 Europe
- 3.4.3 Asia Pacific
- 3.4.4 Latin America
- 3.4.5 MEA
- 3.5 Porter's analysis
- 3.6 PESTEL analysis
- 3.7 Technology and Innovation landscape
- 3.7.1 Current technological trends
- 3.7.1.1 Automation & robotics in cargo handling
- 3.7.1.2 Digital twin & simulation technologies
- 3.7.1.3 Iot & sensor networks for asset tracking
- 3.7.2 Emerging technologies
- 3.7.2.1 Artificial intelligence & predictive analytics
- 3.7.2.2 Blockchain for documentation & traceability
- 3.7.2.3 5g connectivity & edge computing
- 3.7.1 Current technological trends
- 3.8 Patent analysis
- 3.9 Price trends
- 3.9.1 By region
- 3.9.2 By type
- 3.10 Cost breakdown analysis
- 3.11 Business Case & ROI Analysis
- 3.11.1 Total cost of ownership framework
- 3.11.2 ROI calculation methodologies
- 3.11.3 Implementation timeline & milestones
- 3.11.4 Risk assessment & mitigation strategies
- 3.12 Sustainability and environmental impact analysis
- 3.12.1 Sustainable practices
- 3.12.2 Waste reduction strategies
- 3.12.3 Energy efficiency in production
- 3.12.4 Eco-friendly initiatives
- 3.12.5 Carbon footprint considerations
- 3.13 Investment & Funding Analysis
- 3.13.1 Infrastructure investment & jobs act (IIJA) impact
- 3.13.2 Public-private partnership (PPP) models
- 3.13.3 Private equity & venture capital activity
- 3.13.4 Green finance & sustainability-linked funding
- 3.14 Infrastructure capacity utilization & bottleneck analysis
- 3.14.1 Port congestion metrics & dwell time analysis
- 3.14.2 Rail terminal capacity constraints
- 3.14.3 Chassis availability & pool management challenges
- 3.14.4 Gate processing throughput limitations
- 3.14.5 On-dock rail capacity vs. Demand gap
- 3.14.6 Storage yard utilization rates
- 3.14.7 Peak season surge capacity requirements
- 3.14.8 Intermodal connector bottleneck identification
- 3.15 Landside accessibility & first/last-mile infrastructure connectivity
- 3.15.1 Intermodal connector program (FHWA) investment priorities
- 3.15.2 Grade-separated crossings & congestion relief projects
- 3.15.3 Drayage trucking capacity & driver shortages
- 3.15.4 Urban freight corridors & truck route restrictions
- 3.15.5 Rail network capacity & class i railroad congestion
- 3.15.6 Short-line railroad connectivity & infrastructure condition
- 3.15.7 Dedicated freight corridors & high-speed rail conflicts
- 3.15.8 Last-mile delivery infrastructure for e-commerc3
Chapter 4 Competitive Landscape, 2024
- 4.1 Introduction
- 4.2 Company market share analysis
- 4.2.1 North America
- 4.2.2 Europe
- 4.2.3 Asia Pacific
- 4.2.4 Latin America
- 4.2.5 MEA
- 4.3 Competitive analysis of major market players
- 4.4 Competitive positioning matrix
- 4.5 Strategic outlook matrix
- 4.6 Key developments
- 4.6.1 Mergers & acquisitions
- 4.6.2 Partnerships & collaborations
- 4.6.3 New Product Launches
- 4.6.4 Expansion Plans and funding
Chapter 5 Market Estimates & Forecast, By Transportation Mode, 2021 - 2034 ($Bn, TEU)
- 5.1 Key trends
- 5.2 Rail and road transport
- 5.3 Air and road transport
- 5.4 Maritime and road transport
- 5.5 Others
Chapter 6 Market Estimates & Forecast, By Hub, 2021 - 2034 ($Bn, TEU)
- 6.1 Key trends
- 6.2 Seaport Intermodal Hubs
- 6.3 Rail-Road Intermodal Terminals
- 6.4 Dry Ports / Inland Container Depots (ICDs)
- 6.5 Air Cargo Intermodal Hubs
- 6.6 Urban Multimodal Logistics Centers
Chapter 7 Market Estimates & Forecast, By End Use, 2021 - 2034 ($Bn, TEU)
- 7.1 Key trends
- 7.2 Manufacturing
- 7.3 Oil & gas
- 7.4 Construction
- 7.5 Consumer goods and retail
- 7.6 Automotive
- 7.7 Food and beverages
- 7.8 Pharmaceuticals and healthcare
- 7.9 Others
Chapter 8 Market Estimates & Forecast, By Operation Model, 2021 - 2034 ($Bn, TEU)
- 8.1 Key trends
- 8.2 Public/Government-Operated
- 8.3 Private-Operated
- 8.4 PPP (Public-Private Partnership)
- 8.5 Concession-Based / BOT
- 8.6 3PL / 4PL Operated
Chapter 9 Market Estimates & Forecast, By Automation Level, 2021 - 2034 ($Bn, TEU)
- 9.1 Key trends
- 9.2 Conventional / Manual Hubs
- 9.3 Semi-Automated Hubs
- 9.4 Fully Automated
Chapter 10 Market Estimates & Forecast, By Throughput Capacity, 2021 - 2034 ($Bn, TEU)
- 10.1 Key trends
- 10.2 Low Capacity
- 10.3 Medium Capacity
- 10.4 High Capacity
- 10.5 Mega Hubs
Chapter 11 Market Estimates & Forecast, By Region, 2021 - 2034 ($Bn, TEU)
- 11.1 Key trends
- 11.2 North America
- 11.2.1 US
- 11.2.2 Canada
- 11.3 Europe
- 11.3.1 Germany
- 11.3.2 UK
- 11.3.3 France
- 11.3.4 Italy
- 11.3.5 Spain
- 11.3.6 Russia
- 11.3.7 Nordics
- 11.4 Asia Pacific
- 11.4.1 China
- 11.4.2 India
- 11.4.3 Japan
- 11.4.4 Australia
- 11.4.5 South Korea
- 11.4.6 Philippines
- 11.4.7 Indonesia
- 11.5 Latin America
- 11.5.1 Brazil
- 11.5.2 Mexico
- 11.5.3 Argentina
- 11.6 MEA
- 11.6.1 South Africa
- 11.6.2 Saudi Arabia
- 11.6.3 UAE
Chapter 12 Company Profiles
- 12.1 Global Players
- 12.1.1 APM Terminals (A.P. Moller-Maersk)
- 12.1.2 BNSF Railway
- 12.1.3 C.H. Robinson Worldwide
- 12.1.4 Canadian National Railway
- 12.1.5 China Merchants Port
- 12.1.6 CMA CGM Terminal Link
- 12.1.7 COSCO SHIPPING Ports
- 12.1.8 DHL Global
- 12.1.9 DP World
- 12.1.10 Hutchison Ports
- 12.1.11 J.B. Hunt Transport Services
- 12.1.12 Kalmar
- 12.1.13 Konecranes
- 12.1.14 Kuehne + Nagel
- 12.1.15 Maersk Line
- 12.1.16 MSC Terminal & Logistics (TIL)
- 12.1.17 Navis
- 12.1.18 PSA International
- 12.1.19 Union Pacific Railroad
- 12.1.20 Zebra Technologies
- 12.2 Regional Players
- 12.2.1 Georgia Ports Authority
- 12.2.2 Mi-Jack Products
- 12.2.3 Port of Los Angeles
- 12.2.4 Port of Rotterdam
- 12.2.5 Port of Singapore Authority (MPA)
- 12.2.6 South Carolina Ports Authority
- 12.2.7 Tideworks Technology
- 12.2.8 Virginia Port Authority
- 12.2.9 Norfolk Southern
- 12.3 Emerging Players
- 12.3.1 Kaleris
- 12.3.2 Portchain
- 12.3.3 TuSimple
 2026年全球多式联运货运市场报告
 2026-2030年全球多式联运货运市场
 日本货运市场规模、份额、趋势及预测(按交付类型、运输方式、最终用途和地区划分),2026-2034年
 按货物类型、港口类型、所有权类型、服务类型和应用分類的航运和港口市场 - 2026-2032 年全球预测
 多式联运:市场占有率分析、产业趋势与统计、成长预测(2026-2031)
 2032 年多式联运市场预测:按服务类型、解决方案类型、运输方式、货柜类型、最终用户和地区进行的全球分析
 2026 年至 2032 年运输管理软体市场(按模式、功能、最终用户和地区划分)2025 年至 2033 年联运货运市场报告(按组件、运输方式、最终用户和地区划分)亚太地区货柜运输:市场占有率分析、产业趋势与成长预测(2025-2030)
 长型车辆市场报告:趋势、预测和竞争分析(至 2030 年)