


 |
市场调查报告书
商品编码
1910928
多式联运:市场占有率分析、产业趋势与统计、成长预测(2026-2031)Intermodal Freight Transportation - Market Share Analysis, Industry Trends & Statistics, Growth Forecasts (2026 - 2031) |
||||||
※ 本网页内容可能与最新版本有所差异。详细情况请与我们联繫。
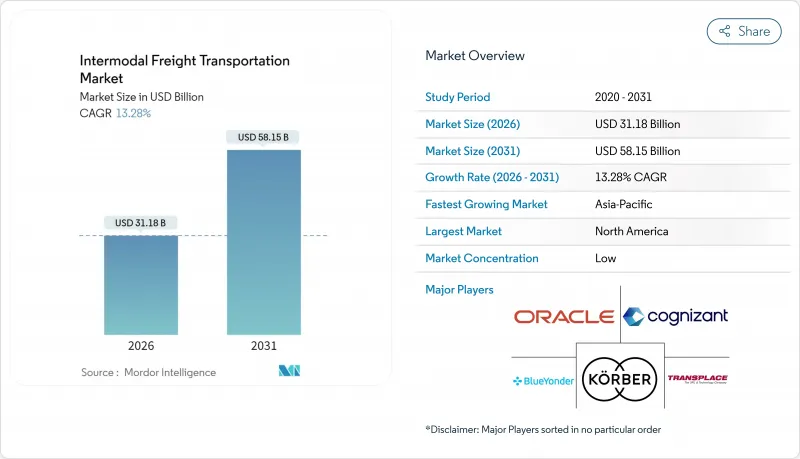
预计到 2026 年,多式联运货运市场规模将达到 311.8 亿美元,高于 2025 年的 275.2 亿美元,预计到 2031 年将达到 581.5 亿美元。
预计2026年至2031年年复合成长率(CAGR)为13.28%。
电子商务交易量的成长、供应链数位化的加速以及政策主导的脱碳目标正在共同重塑运输方式的选择,并推动对综合物流解决方案的需求。公共支出,包括耗资100亿美元的拉雷多-蒙特雷自动化铁路走廊以及「一带一路」沿线的大规模铁路投资,正开始释放潜力并重塑洲际贸易流量。科技的应用正在扩大即时可视性、缩短停留时间并提高资产运转率,而永续性则增强了铁路-公路和海铁联运的经济合理性。竞争优势正从单纯的资产规模转向在单一多模态平台上整合软体、分析和经认证的低碳服务的能力。
全球多式联运货运市场趋势与洞察
全球供应链数位化提高了即时可视性
基于云端的物流平台蓬勃发展,将承运人、码头和托运人连接成一个整合的资料生态系统,每年处理数十亿笔交易。预测分析技术将货物停留时间缩短了两位数百分比,并实现了动态路线规划,从而提高了铁路、公路和海运的资产运转率。物联网智慧货柜传输温度、湿度和位置数据,以增强货物完整性并降低保险成本。区块链技术提供的记录提供了不可篡改的交货证明,并解决了不同运输方式之间的历史纠纷,而丰富的API架构则便于与传统EDI标准整合。这些数位化基础正在将多式联运市场转变为一个数据驱动型网络,能够大规模进行近乎即时的路线调整。
不断增长的电子商务交易量需要灵活的货运方式
B2C小包裹需求持续成长,成长速度超过商品贸易总量,迫使托运人从点对点的整车运输转向以速度和成本为平衡点的轴辐式多式联运解决方案。光是亚马逊就计画在2024年在北美运作15个新的多式联运设施,从而缩短平均「中间里程」。两日达的预期和不断增长的跨境订单推动了铁路沿线货运量的增长,尤其是在500至1500英里的最佳运输距离范围内。全通路零售商也更频繁地重新分配库存,这促使他们需要灵活的运输方式切换,以确保货架上的商品充足,同时避免占用过多营运资金。
港口拥挤和底盘短缺加剧了周转时间延长。
由于底盘供应无法满足旺季需求,美国主要门户港口的平均货柜停留时间从2019年的3.8天增加到2024年的5.2天。对中国製造的设备征收关税以及国内产能有限,导致供应量仅为所需量的78%。货柜逾期归还每天给多式联运业者造成约150美元的罚款,削弱了其与长途卡车运输的成本竞争力。自动化计划有望改善这一状况,但由于实施週期长达数年,这一瓶颈问题仍然是近期面临的一大风险。
细分市场分析
软体收入正以13.43%的复合年增长率成长,超过了规模仍然庞大的服务类别。至2025年,服务类别将占多式联运货运市场收入的60.42%。 Blue Yonder的人工智慧平台每年已处理超过20亿个运输决策,从而优化路线选择、货物整合和运力预测。云端部署模式降低了进入门槛,使中型托运人无需大量资本支出即可部署强大的运输管理系统(TMS)和仓库管理系统(WMS)。
服务供应商透过捆绑咨询、实施和管理服务来保持竞争优势,从而降低软体部署风险并推动持续优化。 Oracle 于 2024 年收购 Cerner 的供应链资产,巩固了其在医疗保健领域的地位;而 Cognizant 与 Microsoft Azure 的合作则为製药业拓展了多租户视觉选项。符合 FDA 和 DOT 监管要求的合规模块正在推动对专业软体的需求,而订阅定价模式则为供应商提供了稳定的收入来源。随着预测分析在永续性报告和按需运力调整方面变得至关重要,软体驱动的多式联运市场预计将会扩张。
到2025年,空运和公路运输合计将占多式联运收入的45.62%,而铁路运输服务到2031年将以13.51%的复合年增长率增长,这将改变多式联运货运市场的收入结构。柴油价格持续波动以及铁路40%的燃油效率优势,使得铁路成为500英里以上运输的首选方案。连接洛杉矶和西雅图、耗资30亿美元的北太平洋绿色走廊电气化铁路计划正在推动这项转变。
对于高价值、时效性强的货物运输,空运与公路联运方案仍然至关重要。联邦快递斥资40亿美元扩建孟菲斯世界枢纽,新增铁路连接,将国内运输时间缩短了半天之多,兼具空运的速度和铁路运输的经济性。海运与公路以及海运与铁路联运仍然是大宗货物运输和长途运输的重要方式。同时,机器人和自动驾驶卡车预计在未来透过降低最后一公里的人力成本,重新平衡各种运输方式的份额。
区域分析
预计到2025年,亚太地区将占全球营收的29.33%,复合年增长率达13.69%,巩固其作为多式联运货运市场成长最快地区的地位。中欧铁路快运服务在2024年将实现超过17,000趟的出货量,使高价值货物的海运时间缩短10至15天。印度的专用货运走廊和东协跨境铁路互联互通正在将越南、泰国和印尼的生产中心与主要港口连接起来,扩大网路覆盖范围。
北美地区在收入方面位居第二,这得益于贸易路线以及美国墨加协定(USMCA)下的大规模基础设施投资。该地区相关的多式联运市场规模预计将受益于拉雷多-蒙特雷走廊和加拿大太平洋铁路-堪萨斯城单线铁路网,这将简化边境通关流程并缩短换乘停留时间。驾驶人和底盘短缺将限制短期成长,但在政府补贴和私人资本投资的支持下,长期成长前景稳健。
在欧洲,重点在于减少排放和跨境标准化。 「Fit for 55」碳排放法规和250亿欧元(273亿美元)的泛欧交通运输网络(TEN-T)基金正在加速向以铁路为中心的1500公里以下货运路线转型。德国的自动化铁路货运站和英国的港口发展将有助于缓解英国脱欧后贸易结构调整的影响。南美洲、中东和非洲等新兴地区虽然绝对规模仍然较小,但在货物运输走廊和「一带一路」基础设施投资计划沿线的某些领域仍存在机会。
其他福利
- Excel格式的市场预测(ME)表
- 3个月的分析师支持
目录
第一章 引言
- 研究假设和市场定义
- 调查范围
第二章调查方法
第三章执行摘要
第四章 市场环境
- 市场概览
- 市场驱动因素
- 全球供应链数位化增强了即时视觉性
- 不断增长的电子商务交易量需要灵活的货运方式
- 透过促进模式转换。
- 政府投资兴建铁路枢纽和内陆港
- 具备物联网追踪功能的智慧货柜正变得越来越受欢迎。
- 沿主要海上贸易航线发展绿色走廊
- 市场限制
- 分段资料标准限制了系统互通性
- 港口拥挤和底盘短缺导致周转时间延长
- 多式联运卡车驾驶人严重短缺
- 互联终端资产面临的网路安全风险日益增加
- 产业价值/价值链分析
- 监管环境
- 技术展望
- 宏观经济因素的影响
- 波特五力分析
- 买方的议价能力
- 供应商的议价能力
- 新进入者的威胁
- 替代品的威胁
- 竞争对手之间的竞争
第五章 市场规模与成长预测
- 按组件
- 软体
- 服务
- 透过交通工具
- 铁路和道路运输
- 航空和陆路运输
- 海陆运输
- 其他交通方式
- 按最终用户行业划分
- 工业和製造业
- 石油和天然气
- 消费品及零售
- 饮食
- 建造
- 其他的
- 按容器类型
- 干货容器
- 冷藏货柜
- 槽式货柜
- 平板架和敞口容器
- 按服务类型
- 交通规划
- 车队管理
- 仓储和配送
- 其他的
- 按地区
- 北美洲
- 美国
- 加拿大
- 墨西哥
- 南美洲
- 巴西
- 阿根廷
- 南美洲其他地区
- 欧洲
- 德国
- 英国
- 法国
- 义大利
- 西班牙
- 俄罗斯
- 其他欧洲
- 亚太地区
- 中国
- 日本
- 印度
- 韩国
- 东南亚
- 澳洲和纽西兰
- 亚太其他地区
- 中东
- 沙乌地阿拉伯
- 阿拉伯聯合大公国
- 土耳其
- 其他中东地区
- 非洲
- 南非
- 奈及利亚
- 埃及
- 其他非洲地区
- 北美洲
第六章 竞争情势
- 市场集中度
- 策略趋势
- 市占率分析
- 公司简介
- Oracle Corporation
- Cognizant Technology Solutions Corporation
- Karber AG
- Blue Yonder Group Inc.
- Transplace LLC
- Wabtec Corporation
- The Descartes Systems Group Inc.
- Motorola Solutions Inc.
- Elemica Inc.
- Envase Technologies LLC
- CH Robinson Worldwide Inc.
- Deutsche Bahn AG
- Kuehne+Nagel International AG
- DSV A/S
- FedEx Corporation
- United Parcel Service Inc.
- XPO Logistics Inc.
- JB Hunt Transport Services Inc.
- Maersk Line A/S
- DP World PLC
第七章 市场机会与未来展望
The intermodal freight transportation market size in 2026 is estimated at USD 31.18 billion, growing from 2025 value of USD 27.52 billion with 2031 projections showing USD 58.15 billion, growing at 13.28% CAGR over 2026-2031.
Rising e-commerce volumes, accelerating supply-chain digitalization, and policy-driven decarbonization goals are converging to reshape modal choices and propel demand for integrated logistics solutions. Public spending on infrastructure, including the USD 10 billion automated rail corridor between Laredo and Monterrey, as well as large-scale Belt and Road rail investments, has begun to unlock latent capacity while redirecting continental trade flows. Technology adoption is expanding real-time visibility, shrinking dwell times, and increasing asset utilization rates, while sustainability mandates reinforce the economic case for rail-road and maritime-rail combinations. Competitive differentiation is shifting from pure asset scale to the ability to orchestrate software, analytics, and certified low-carbon services within a single multimodal platform.
Global Intermodal Freight Transportation Market Trends and Insights
Digitisation of Global Supply Chains Enhances Real-Time Visibility
Widespread adoption of cloud-based logistics platforms now connects carriers, terminals, and shippers within unified data ecosystems that process billions of transactions per year . Predictive analytics reduces dwell times by double-digit percentages and supports dynamic routing that lifts asset-utilization rates across rail, road, and maritime legs. IoT-equipped smart containers transmit temperature, humidity, and location data, reinforcing cargo integrity and lowering insurance costs. Blockchain-enabled records offer immutable proof-of-delivery that resolves historic disputes among modal operators, while API-rich architectures ease integration with legacy EDI standards. Collectively, these digital building blocks are turning the intermodal freight transportation market into a data-driven network capable of near-real-time course correction at scale.
Expansion of E-commerce Volumes Demanding Flexible Freight Options
B2C parcel demand continues to grow faster than total merchandise trade, forcing shippers to shift from point-to-point full-truckload moves toward hub-and-spoke intermodal solutions that balance speed and cost. Amazon alone commissioned 15 new North American intermodal facilities during 2024 to shorten the average "middle-mile" hop. Two-day delivery expectations and enlarging cross-border order books channel higher volumes onto rail-road corridors within the 500-1,500-mile sweet spot. Omnichannel retailers also reposition inventory more frequently, raising demand for agile mode-switching that keeps shelves stocked without inflating working capital.
Port Congestion and Chassis Shortages Escalating Turn-Round Times
Average container dwell time at major U.S. gateways reached 5.2 days in 2024, up from 3.8 days in 2019, as chassis availability fell short of peak-season demand. Tariffs on Chinese-built equipment and limited domestic manufacturing capacity left supply at 78% of required levels. Intermodal operators incurred daily penalty fees near USD 150 for late container returns, undermining cost competitiveness versus long-haul trucking. Automation projects promise relief but require multiyear deployments, keeping this bottleneck on short-term risk radars.
Other drivers and restraints analyzed in the detailed report include:
- Shift Toward Decarbonised Logistics Through Modal-Shift Incentives
- Government Investments in Rail-Road Terminals and Dry Ports
- Acute Shortage of Intermodal-Qualified Truck Drivers
For complete list of drivers and restraints, kindly check the Table Of Contents.
Segment Analysis
Software revenues are growing at 13.43% CAGR, outpacing the larger services category that still accounts for 60.42% of 2025 turnover within the intermodal freight transportation market. Blue Yonder's AI platform already ingests over 2 billion shipment decisions each year, enhancing lane selection, load consolidation, and capacity prediction. Cloud deployment models lower entry barriers, enabling mid-market shippers to adopt robust TMS and WMS capabilities without heavy capital outlays.
Service providers maintain their lead by bundling consulting, implementation, and managed services that de-risk software launches and drive ongoing optimization. Oracle's 2024 acquisition of Cerner's supply-chain assets strengthened its healthcare footprint, while Cognizant's alliance with Microsoft Azure expanded multitenant visibility options for pharmaceuticals. Compliance modules covering FDA and DOT mandates elevate demand for specialized software, and subscription pricing stabilizes revenue streams for vendors. The intermodal freight transportation market size linked to software is set to widen as predictive analytics becomes indispensable for sustainability reporting and on-demand capacity orchestration.
Air-road pairings held 45.62% of 2025 modal revenue, yet rail-road services are advancing at a 13.51% CAGR through 2031 and shifting the revenue mix of the intermodal freight transportation market. Sustained diesel price volatility and a 40% fuel-efficiency edge make rail compelling for hauls over 500 miles. The USD 3 billion North Pacific Green Corridor electrified rail project connecting Los Angeles and Seattle underpins this pivot.
Air-road solutions remain irreplaceable for high-value, time-sensitive cargo. FedEx's USD 4 billion Memphis World Hub expansion added rail links that compress domestic transit by up to half a day, blending airspeed with rail economics . Maritime-road and maritime-rail combinations continue to serve bulk and long-distance lanes, while robotics and autonomous trucks may eventually rebalance mode shares by shrinking final-mile labor costs.
The Intermodal Freight Transportation Market is Segmented by Component (Software, Service), Transportation Mode (Rail and Road Transport, Air and Road Transport, and More), End-User Industry (Industrial and Manufacturing, and More), Container Type (Dry Containers, Refrigerated Containers, and More), Service Type (Transportation Planning, and More), and Geography. The Market Forecasts are Provided in Terms of Value (USD).
Geography Analysis
Asia Pacific accounted for 29.33% of 2025 revenue and is poised to grow at 13.69% CAGR, firmly establishing itself as the fastest-expanding region in the intermodal freight transportation market. China-Europe Railway Express services tallied more than 17,000 trains in 2024, shaving 10-15 days off maritime schedules for high-value goods. India's Dedicated Freight Corridor and ASEAN cross-border rail links are synchronizing production bases in Vietnam, Thailand, and Indonesia with major seaports, broadening the network's reach.
North America ranks second by revenue, underpinned by USMCA-aligned trade lanes and extensive infrastructure investment. The intermodal freight transportation market size attached to the region will benefit from the Laredo-Monterrey corridor and the Canadian Pacific Kansas City single-line rail network, both of which streamline border crossings and reduce interchange dwell time. Driver shortages and chassis deficits temper near-term upside but do not derail the long-term growth trajectory supported by government grants and private capex.
Europe focuses on emission reduction and cross-border standardization. Fit for 55 carbon rules and EUR 25 billion (USD 27.3 billion) in TEN-T funding are accelerating a pivot to rail-centric itineraries for freight under 1,500 km. Automated rail terminals in Germany and port upgrades in the United Kingdom buffer post-Brexit trade realignment. Emerging regions such as South America, the Middle East, and Africa remain smaller in absolute terms yet present targeted opportunities along commodity corridors and Belt and Road-financed infrastructure tranches.
- Oracle Corporation
- Cognizant Technology Solutions Corporation
- Karber AG
- Blue Yonder Group Inc.
- Transplace LLC
- Wabtec Corporation
- The Descartes Systems Group Inc.
- Motorola Solutions Inc.
- Elemica Inc.
- Envase Technologies LLC
- C.H. Robinson Worldwide Inc.
- Deutsche Bahn AG
- Kuehne + Nagel International AG
- DSV A/S
- FedEx Corporation
- United Parcel Service Inc.
- XPO Logistics Inc.
- J.B. Hunt Transport Services Inc.
- Maersk Line A/S
- DP World PLC
Additional Benefits:
- The market estimate (ME) sheet in Excel format
- 3 months of analyst support
TABLE OF CONTENTS
1 INTRODUCTION
- 1.1 Study Assumptions and Market Definition
- 1.2 Scope of the Study
2 RESEARCH METHODOLOGY
3 EXECUTIVE SUMMARY
4 MARKET LANDCSAPE
- 4.1 Market Overview
- 4.2 Market Drivers
- 4.2.1 Digitisation of global supply chains enhances real-time visibility
- 4.2.2 Expansion of e-commerce volumes demanding flexible freight options
- 4.2.3 Shift toward decarbonised logistics through modal shift incentives
- 4.2.4 Government investments in rail-road terminals and dry ports
- 4.2.5 Growing availability of smart containers with IoT tracking
- 4.2.6 Deployment of green corridors on key maritime trade lanes
- 4.3 Market Restraints
- 4.3.1 Fragmented data standards limit system interoperability
- 4.3.2 Port congestion and chassis shortages escalating turn-round times
- 4.3.3 Acute shortage of intermodal-qualified truck drivers
- 4.3.4 Rising cyber-security risks across connected terminal assets
- 4.4 Industry Value / Supply-Chain Analysis
- 4.5 Regulatory Landscape
- 4.6 Technological Outlook
- 4.7 Impact of Macroeconomic Factors
- 4.8 Porter's Five Forces Analysis
- 4.8.1 Bargaining Power of Buyers
- 4.8.2 Bargaining Power of Suppliers
- 4.8.3 Threat of New Entrants
- 4.8.4 Threat of Substitutes
- 4.8.5 Intensity of Competitive Rivalry
5 MARKET SIZE AND GROWTH FORECASTS (VALUE)
- 5.1 By Component
- 5.1.1 Software
- 5.1.2 Service
- 5.2 By Transportation Mode
- 5.2.1 Rail and Road Transport
- 5.2.2 Air and Road Transport
- 5.2.3 Maritime and Road Transport
- 5.2.4 Other Transportation Modes
- 5.3 By End-User Industry
- 5.3.1 Industrial and Manufacturing
- 5.3.2 Oil and Gas
- 5.3.3 Consumer and Retail
- 5.3.4 Food and Beverage
- 5.3.5 Construction
- 5.3.6 Other End-User Industries
- 5.4 By Container Type
- 5.4.1 Dry Containers
- 5.4.2 Refrigerated Containers
- 5.4.3 Tank Containers
- 5.4.4 Flat-rack and Open-top Containers
- 5.5 By Service Type
- 5.5.1 Transportation Planning
- 5.5.2 Fleet Management
- 5.5.3 Warehousing and Distribution
- 5.5.4 Other Services
- 5.6 By Geography
- 5.6.1 North America
- 5.6.1.1 United States
- 5.6.1.2 Canada
- 5.6.1.3 Mexico
- 5.6.2 South America
- 5.6.2.1 Brazil
- 5.6.2.2 Argentina
- 5.6.2.3 Rest of South America
- 5.6.3 Europe
- 5.6.3.1 Germany
- 5.6.3.2 United Kingdom
- 5.6.3.3 France
- 5.6.3.4 Italy
- 5.6.3.5 Spain
- 5.6.3.6 Russia
- 5.6.3.7 Rest of Europe
- 5.6.4 Asia Pacific
- 5.6.4.1 China
- 5.6.4.2 Japan
- 5.6.4.3 India
- 5.6.4.4 South Korea
- 5.6.4.5 Southeast Asia
- 5.6.4.6 Australia and New Zealand
- 5.6.4.7 Rest of Asia Pacific
- 5.6.5 Middle East
- 5.6.5.1 Saudi Arabia
- 5.6.5.2 United Arab Emirates
- 5.6.5.3 Turkey
- 5.6.5.4 Rest of Middle East
- 5.6.6 Africa
- 5.6.6.1 South Africa
- 5.6.6.2 Nigeria
- 5.6.6.3 Egypt
- 5.6.6.4 Rest of Africa
- 5.6.1 North America
6 COMPETITIVE LANDSCAPE
- 6.1 Market Concentration
- 6.2 Strategic Moves
- 6.3 Market Share Analysis
- 6.4 Company Profiles (includes Global level Overview, Market level overview, Core Segments, Financials as available, Strategic Information, Market Rank/Share for key companies, Products and Services, and Recent Developments)
- 6.4.1 Oracle Corporation
- 6.4.2 Cognizant Technology Solutions Corporation
- 6.4.3 Karber AG
- 6.4.4 Blue Yonder Group Inc.
- 6.4.5 Transplace LLC
- 6.4.6 Wabtec Corporation
- 6.4.7 The Descartes Systems Group Inc.
- 6.4.8 Motorola Solutions Inc.
- 6.4.9 Elemica Inc.
- 6.4.10 Envase Technologies LLC
- 6.4.11 C.H. Robinson Worldwide Inc.
- 6.4.12 Deutsche Bahn AG
- 6.4.13 Kuehne + Nagel International AG
- 6.4.14 DSV A/S
- 6.4.15 FedEx Corporation
- 6.4.16 United Parcel Service Inc.
- 6.4.17 XPO Logistics Inc.
- 6.4.18 J.B. Hunt Transport Services Inc.
- 6.4.19 Maersk Line A/S
- 6.4.20 DP World PLC
7 MARKET OPPORTUNITIES AND FUTURE OUTLOOK
- 7.1 White-space and Unmet-need Assessment
 2026年全球多式联运货运市场报告
 2026-2030年全球多式联运货运市场
 日本货运市场规模、份额、趋势及预测(按交付类型、运输方式、最终用途和地区划分),2026-2034年
 按货物类型、港口类型、所有权类型、服务类型和应用分類的航运和港口市场 - 2026-2032 年全球预测
 多式联运枢纽市场机会、成长驱动因素、产业趋势分析及预测(2025-2034年)
 2032 年多式联运市场预测:按服务类型、解决方案类型、运输方式、货柜类型、最终用户和地区进行的全球分析
 2026 年至 2032 年运输管理软体市场(按模式、功能、最终用户和地区划分)2025 年至 2033 年联运货运市场报告(按组件、运输方式、最终用户和地区划分)
 亚太地区货柜运输:市场占有率分析、产业趋势与成长预测(2025-2030)
 长型车辆市场报告:趋势、预测和竞争分析(至 2030 年)