


 |
市场调查报告书
商品编码
1636261
亚太地区货柜运输:市场占有率分析、产业趋势与成长预测(2025-2030)Asia-Pacific Container Drayage - Market Share Analysis, Industry Trends & Statistics, Growth Forecasts (2025 - 2030) |
||||||
※ 本网页内容可能与最新版本有所差异。详细情况请与我们联繫。
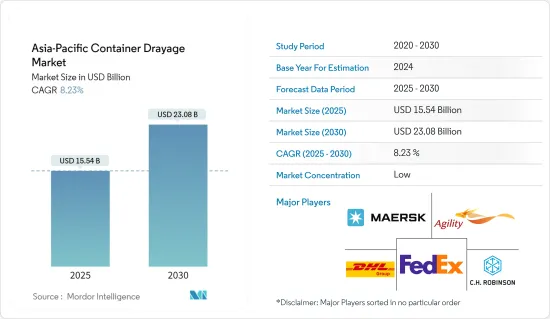
预计2025年亚太货柜短驳市场规模为155.4亿美元,2030年将达230.8亿美元,预测期内(2025-2030年)复合年增长率为8.23%。
主要亮点
- 亚太地区的货柜拖运市场主要是由快速的贸易活动导致的海运货柜需求激增所推动的。由于亚太地区广阔的海岸线和製造商主要集中在中国,亚太地区对货柜的需求正在增长。此外,随着该地区各国政府加强倡议,以及印度和印尼等尚未开发的市场前景广阔,未来市场可能会成长。
- 全球前25大港口中有18个位于亚洲,亚洲国家在货物装卸方面保持主导地位。资料来自世界银行和标准普尔世界市场情报的货柜港口绩效指数(CPPI),据透露,东亚拥有11个顶级港口,而西亚拥有11个顶级港口。
- 2023年第二季度,全球互联互通情势由以中国为首的亚洲经济体主导。韩国、新加坡和马来西亚也紧跟在后。这些国家的班轮连通指数(LSCI)与前一年同期比较上涨3%至5%,创历史新高。
- 2023年,在强劲的货物需求和对海上贸易的严重依赖的支撑下,中国在亚太海运货柜市场占据主导地位。虽然货运需求快速成长和贸易协定的缔结等因素提振了市场,但运输和库存成本的波动正成为一个挑战。然而,随着海上运输的自动化趋势和严格的安全标准提供了更多机会,市场有望成长。
亚太货柜短驳市场趋势
亚洲主要枢纽港口拥塞缓解以及货柜拖运需求快速成长带动运输板块
- 到2024年6月,北亚和东南亚主要港口的船舶延误率将大幅减少,中国的运能运转率也将提高。然而,航运公司和货运代理的报告突显了印度日益恶化的拥塞情况。亚洲航运业高层强调,虽然新加坡、宁波、青岛和马来西亚巴生等港口的船舶延误情况减少,但货柜拖运的需求却在增加。
- 新加坡的壅塞情况略有缓解,承运人转向巴生港和丹绒伯拉巴斯港等马来西亚港口。特别是,2024 年上半年丹绒伯拉帕斯的货柜装卸量增加了 20%,部分原因是从新加坡转移。同样,巴生北港2024年5月的货柜吞吐量与前一年同期比较增26%至335,361标准箱。
- 新加坡的等待时间逐渐改善至2-3天,虽然等待时间有所减少,但根据运输公司和服务的不同,等待时间差异很大。特别值得注意的是亚太一号航班的延误,主要原因是新加坡严重拥挤。到 2024 年 5 月底为止,延误时间最高峰为 8 天,但此后,一些 FP1 航线的延误时间已减少至最多 5 天。
- 据赫伯罗特称,在其他地方,等待时间已从 2024 年 4 月底的最多三天减少到宁波的两天,青岛的不到 24 小时。新加坡资料显示,等待靠泊的船舶数量有所改善,从 2024 年 6 月 15 日的 350,281 个标准箱减少到 6 月底的 286,778 个标准箱。然而,自2024年5月上旬以来,等待停泊的船舶总量一直在增加。
- 中国的产能运转率显示出改善的迹象,特别是大连港和台湾港等20英尺货柜港口,但华中地区,尤其是武汉等地区的产能利用率仍然明显紧张。与此同时,印度主要货柜门户蒙德拉由于转运量增加而面临越来越大的压力。一些往返于新加坡和杜拜之间的航空公司已经减少了在蒙德拉的运营,转而选择其他亚洲港口。
- 最近的贸易更新显示,由于繁忙的货柜存放场的进口清关延误,货柜在蒙德拉的停留时间显着增加。印度货柜铁路营运商(CTO)指责蒙德拉港扰乱了火车週转,导致进口商收取额外费用。据 CTO 消息人士透露,铁路货场的停留时间从通常的 7 到 9 天增加了一倍,现在平均为 15 到 20 天。特别是,蒙德拉大约一半的交通是透过铁路运输的。
- 随着情况恶化,货柜列车营运商协会建议港务局可以宣布不可抗力。同时,印度货柜运输协会(印度)已呼吁港口迅速采取行动,确保货物畅通。
中国贸易需求快速成长带动市场
- 美国零售库存与销售成长:2024年1月至4月,美国零售库存稳定成长,从7,693亿美元增至7,935亿美元。汽车、建材等产业增幅尤为显着。
- 零售额持续成长:2024年5月美国零售额较上季成长0.1%,与前一年同期比较去年同期成长2.3%。不包括汽车经销商、加油站和餐厅的核心零售额较上季成长 0.3%,与前一年同期比较去年同期成长 2.9%。这些数字接近 NRF 预计的 2024 年 2.5% 至 3.5% 的成长率。
- 美国零售库存的激增,尤其是汽车和建材行业的库存,显示对货柜拖运服务的强劲需求。这一增长将增加对来自重要製造地中国的货柜运输的需求。
- 2024年前4个月,中国港口吞吐量达到惊人的1,0403万标箱,较去年同期成长9%。同时,外贸货运量比去年同期成长9.1%。
- 特别值得注意的是,2024年整体货物吞吐量达到55.5亿吨,比上年增加5.2%。
亚太地区货柜短驳产业概况
亚太地区的货柜短驳市场较为分散。市场的主要企业包括马士基亚亚太公司、Agility、CH Robinson Worldwide Inc.、联邦快递公司、德国邮政敦豪集团等。
主要企业正专注于各个策略领域以保持竞争力。人们越来越重视业务流程的数位转型和自动化,以提高效率并降低业务成本。
其他好处
- Excel 格式的市场预测 (ME) 表
- 3 个月分析师支持
目录
第一章简介
- 研究成果
- 研究场所
- 调查范围
第二章调查方法
第三章执行摘要
第四章市场动态与洞察
- 目前的市场状况
- 市场动态
- 促进因素
- 铁路贸易量增加
- 电子商务领域的成长
- 抑制因素
- 港口壅塞导致货物收出货延误
- 可避免成本的风险
- 机会
- 市场驱动的技术进步
- 促进因素
- 产业吸引力-波特五力分析
- 新进入者的威胁
- 买家/消费者的议价能力
- 供应商的议价能力
- 替代品的威胁
- 竞争公司之间的敌对关係
- 价值链/供应链分析
- 洞察行业法规政策
- 对技术整合的见解
- 亚太电商产业洞察
- 亚太货柜资料概览
- 聚焦 - 货运成本/运费
- COVID-19 对市场的影响
第五章市场区隔
- 按运输方式
- 铁路
- 路
- 其他交通方式
- 按地区
- 中国
- 日本
- 印度
- 韩国
- 印尼
- 越南
- 澳洲
- 其他亚太地区
第六章 竞争状况
- 市场集中度概览
- 公司简介
- Maersk Asia Pacific
- Agility
- CH Robinson Worldwide Inc.
- FedEx Corp.
- Deutsche Post DHL Group
- Hitachi Ltd
- CMA CGM SA Group
- DB Schenker
- United Parcel Services Inc.
- Ceva Logistics
- Yusen Logistics Co. Ltd*
- 其他公司
第七章 市场未来展望
第8章附录
- 总体经济指标
- 资本流动洞察(运输和仓储产业投资)
- 对外贸易统计
The Asia-Pacific Container Drayage Market size is estimated at USD 15.54 billion in 2025, and is expected to reach USD 23.08 billion by 2030, at a CAGR of 8.23% during the forecast period (2025-2030).
Key Highlights
- The Asia-Pacific container drayage market is mainly driven by the surge in demand for shipping containers due to rapid trade activities. Asia-Pacific, bolstered by its expansive coastal lines and a concentration of manufacturers, particularly in China, is witnessing heightened demand for these containers. Moreover, as governments in regional countries ramp up initiatives and untapped markets like India and Indonesia show promise, future market growth looks promising.
- Asian countries maintain their dominance in cargo handling, with 18 of the top 25 global ports located in Asia. This data, sourced from the Container Port Performance Index (CPPI) by the World Bank and S&P Global Market Intelligence, highlights that Eastern Asia boasts 11 of these top ports, while Western Asia hosts four.
- Asian economies dominated the global connectivity landscape in Q2 2023, with China leading the market. The Republic of Korea, Singapore, and Malaysia followed closely. Each of these nations saw their Liner Shipping Connectivity Index (LSCI) rise by 3% to 5% compared to the previous year, hitting all-time highs in their index values.
- In 2023, China dominated the Asia-Pacific shipping container market, underpinned by its robust demand for commodities and heavy reliance on seaborne trade. While factors like a surge in cargo transportation demand and trade agreements bolster the market, fluctuations in transportation and inventory costs pose challenges. However, the market is poised for growth, with automation trends in marine transportation and heightened safety norms offering further opportunities.
Asia-Pacific Container Drayage Market Trends
Port Congestion Easing in Key Asian Hubs, Surge in Demand for Container Drayage Driving the Transportation Segment
- By June 2024, major ports in North and Southeast Asia have seen a notable drop in vessel delays, with China also marking an uptick in equipment availability. However, reports from ocean carriers and forwarders underscore a mounting congestion challenge in India. Executives in the shipping industry across Asia have highlighted that while ports like Singapore, Ningbo, Qingdao, and Klang in Malaysia are witnessing fewer vessel delays, the demand for container drayages is on the rise.
- Although congestion in Singapore has slightly alleviated, carriers are increasingly turning to Malaysian ports like Klang and Tanjung Pelepas. Tanjung Pelepas, in particular, saw a 20% surge in container volumes in the first half of 2024, partly due to diversions from Singapore. Similarly, Northport in Klang recorded a notable 26% uptick in container volumes in May 2024, reaching 335,361 TEUs compared to the previous year, largely fueled by ad-hoc carrier calls.
- While there has been a modest improvement in wait times in Singapore, ranging from two to three days, the wait times, though reduced, still vary significantly based on the carrier and service. Notably, research highlighted delays in the Asia-Europe Far East Pacific 1 service, primarily due to severe congestion in Singapore. Although delays peaked at eight days by the end of May 2024, they have since reduced to a maximum of five days on some FP1 sailings.
- Elsewhere, Hapag-Lloyd reported that wait times had decreased to two days in Ningbo and less than 24 hours in Qingdao, compared to up to three days at the end of April 2024. Data indicates an improvement in Singapore, with vessels waiting at anchorage dropping from 350,281 TEUs on June 15, 2024, to 286,778 TEUs by the end of June. However, the total capacity waiting to berth has seen an uptick since early May 2024.
- While equipment availability in China has shown signs of improvement, especially in ports like Dalian and Taiwanese ports for 20-foot containers, there is still a noticeable tightness in central China, particularly in areas like Wuhan. On the other hand, Mundra, India's primary container gateway, is grappling with mounting pressure from escalating transshipment volumes. Some carriers plying between Singapore and Dubai have curtailed sailings at Mundra to prioritize other Asian ports.
- Recent trade updates underscore that container dwell times at Mundra have significantly lengthened, attributed to sluggish import clearance in congested container yards. Indian container rail operators (CTOs) are pointing fingers at the port for train turnaround disruptions, leading to additional charges for importers. CTO sources reveal that yard backlogs for railed freight have doubled, now averaging 15 to 20 days, up from the usual seven to nine days. Notably, approximately half of Mundra's traffic is rail-bound.
- With the circumstances escalating, the Association of Container Train Operators has hinted at a potential force majeure declaration from the port authority. Simultaneously, the Container Shipping Lines Association (India) is urging swift action from the port to smoothen cargo flows.
Surge in Demand for Trade in China Driving the Market
- US Retail Inventories and Sales Growth: From January to April 2024, US retail inventories climbed steadily, starting at USD 769.3 billion and reaching USD 793.5 billion. Notably, sectors like motor vehicles and building materials saw pronounced upticks.
- Continued Retail Sales Growth: In May 2024, retail sales in the United States inched up by 0.1% from the previous month and 2.3% from the prior year. Core retail sales, which exclude automobile dealers, gasoline stations, and restaurants, saw a 0.3% monthly increase and a 2.9% yearly rise. These figures closely mirror the NRF's projected 2.5% to 3.5% growth for 2024.
- The surge in US retail inventories, especially in motor vehicles and building materials industries, signals a robust demand for container shipping services. This uptick is poised to drive an increased necessity for container shipments from China, a pivotal manufacturing hub.
- China's ports, recording a 9% Y-o-Y surge, processed a staggering 104.03 million TEUs in the initial four months of 2024. Simultaneously, foreign trade cargo saw a 9.1% Y-o-Y upswing.
- Noteworthy is the overall cargo throughput, which hit 5.55 billion tonnes in 2024, marking a 5.2% uptick from the preceding year's figures.
Asia-Pacific Container Drayage Industry Overview
The Asia-Pacific container drayage market is fragmented. Key players in this market include Maersk Asia Pacific, Agility, C H Robinson Worldwide Inc., FedEx Corp., and Deutsche Post DHL Group.
The leading companies are focusing on various strategic areas to maintain their competitive edge. Digital transformation and automation in operational processes are increasingly emphasized to improve efficiency and reduce operational costs.
Additional Benefits:
- The market estimate (ME) sheet in Excel format
- 3 months of analyst support
TABLE OF CONTENTS
1 INTRODUCTION
- 1.1 Study Deliverables
- 1.2 Study Assumptions
- 1.3 Scope of the Study
2 RESEARCH METHODOLOGY
3 EXECUTIVE SUMMARY
4 MARKET DYNAMICS AND INSIGHTS
- 4.1 Current Market Scenario
- 4.2 Market Dynamics
- 4.2.1 Drivers
- 4.2.1.1 Increasing Railway Trade
- 4.2.1.2 Growing E-commerce Sector
- 4.2.2 Restraints
- 4.2.2.1 Port Congestion Delaying Cargo Pick-up and Delivery
- 4.2.2.2 Risk of Incurring Avoidable Costs
- 4.2.3 Opportunities
- 4.2.3.1 Technological Advancements Driving the Market
- 4.2.1 Drivers
- 4.3 Industry Attractiveness - Porter's Five Forces Analysis
- 4.3.1 Threat of New Entrants
- 4.3.2 Bargaining Power of Buyers/Consumers
- 4.3.3 Bargaining Power of Suppliers
- 4.3.4 Threat of Substitute Products
- 4.3.5 Intensity of Competitive Rivalry
- 4.4 Value Chain/Supply Chain Analysis
- 4.5 Insights into Industry Policies and Regulations
- 4.6 Insights into Technological Integration
- 4.7 Insights into E-commerce Industry in Asia-Pacific
- 4.8 Brief on Asia-Pacific Container Datapoints
- 4.9 Spotlight - Freight Transportation Costs/Freight Rates
- 4.10 Impact of COVID-19 on the Market
5 MARKET SEGMENTATION
- 5.1 By Mode of Transport
- 5.1.1 Rail
- 5.1.2 Road
- 5.1.3 Other Modes of Transport
- 5.2 By Geography
- 5.2.1 China
- 5.2.2 Japan
- 5.2.3 India
- 5.2.4 South Korea
- 5.2.5 Indonesia
- 5.2.6 Vietnam
- 5.2.7 Australia
- 5.2.8 Rest of Asia-Pacific
6 COMPETITIVE LANDSCAPE
- 6.1 Market Concentration Overview
- 6.2 Company Profiles
- 6.2.1 Maersk Asia Pacific
- 6.2.2 Agility
- 6.2.3 C H Robinson Worldwide Inc.
- 6.2.4 FedEx Corp.
- 6.2.5 Deutsche Post DHL Group
- 6.2.6 Hitachi Ltd
- 6.2.7 CMA CGM SA Group
- 6.2.8 DB Schenker
- 6.2.9 United Parcel Services Inc.
- 6.2.10 Ceva Logistics
- 6.2.11 Yusen Logistics Co. Ltd*
- 6.3 Other Companies
7 FUTURE OUTLOOK OF THE MARKET
8 APPENDIX
- 8.1 Macroeconomic Indicators
- 8.2 Insight into Capital Flows (Investments in Transport and Storage Sectors)
- 8.3 External Trade Statistics
 2026年全球多式联运货运市场报告
 2026-2030年全球多式联运货运市场
 日本货运市场规模、份额、趋势及预测(按交付类型、运输方式、最终用途和地区划分),2026-2034年
 按货物类型、港口类型、所有权类型、服务类型和应用分類的航运和港口市场 - 2026-2032 年全球预测
 多式联运:市场占有率分析、产业趋势与统计、成长预测(2026-2031)
 多式联运枢纽市场机会、成长驱动因素、产业趋势分析及预测(2025-2034年)
 2032 年多式联运市场预测:按服务类型、解决方案类型、运输方式、货柜类型、最终用户和地区进行的全球分析
 2026 年至 2032 年运输管理软体市场(按模式、功能、最终用户和地区划分)2025 年至 2033 年联运货运市场报告(按组件、运输方式、最终用户和地区划分)
 长型车辆市场报告:趋势、预测和竞争分析(至 2030 年)