


 |
市场调查报告书
商品编码
1892818
马铃薯蛋白市场机会、成长驱动因素、产业趋势分析及预测(2026-2035年)Potato Protein Market Opportunity, Growth Drivers, Industry Trend Analysis, and Forecast 2026 - 2035 |
||||||
2025 年全球马铃薯蛋白市场价值为 2.059 亿美元,预计到 2035 年将以 5.1% 的复合年增长率增长至 3.55 亿美元。
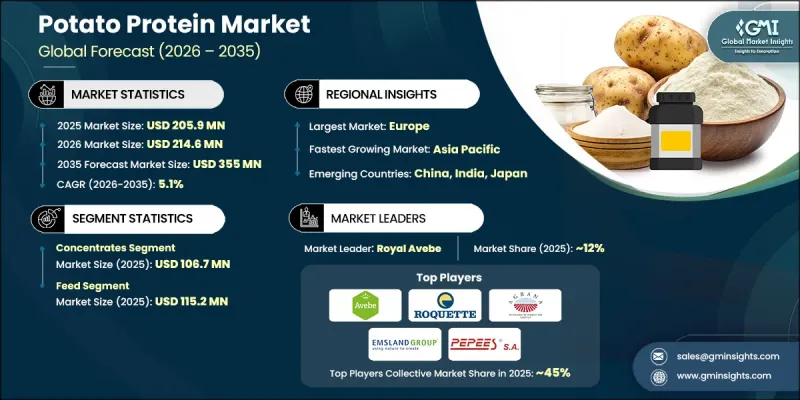
食品、营养和饲料产业对植物性优质蛋白质原料的需求不断增长,推动了市场成长。马铃薯蛋白源自马铃薯块茎,透过先进的工业萃取和纯化工艺,生产出营养和功能性能优异的浓缩蛋白和分离蛋白。这些蛋白以其均衡的胺基酸组成、95%以上的消化率和低致敏性而着称,因此更容易被消费者接受。加工效率和蛋白质回收率的不断提高,在保持蛋白质天然功能的同时,提高了产量。现代化的过滤系统和最佳化的加工条件,使生产商能够提供纯度高、品质稳定的产品。加工技术的持续创新,拓展了马铃薯蛋白的功能多样性,使其能够有效应用于各种配方中。永续性考量和资源利用率的提高进一步增强了其市场吸引力。干燥和颗粒工程技术的进步,提高了分散性、稳定性和復水性能,促进了其更广泛的应用。综上所述,这些因素使马铃薯蛋白成为寻求清洁标籤、植物基蛋白原料的生产商的可靠且可扩展的解决方案。
| 市场范围 | |
|---|---|
| 起始年份 | 2025 |
| 预测年份 | 2026-2035 |
| 起始值 | 2.059亿美元 |
| 预测值 | 3.55亿美元 |
| 复合年增长率 | 5.1% |
2025年,分离乳清蛋白市场规模达到9,470万美元,预计未来将持续成长,这主要得益于专业营养品和高端食品领域的需求。这些产品经过精心设计,具有精准的功能特性和溶解性,并儘可能减少添加剂,以满足严格的营养标准。高纯度和高消化率的要求支撑了其高端定价,由于加工过程复杂,分离乳清蛋白的价格通常比浓缩乳清蛋白高出40%至60%。
到 2025 年,饲料应用领域市场规模将达到 1.152 亿美元。该领域受益于专业动物营养对高消化率蛋白质来源的持续需求,从而支撑了长期稳定的消费。
2025年美国马铃薯蛋白市场价值4,830万美元。国内强劲的需求得益于先进的食品加工基础设施、成熟的植物性产业,以及食品和动物营养产业对清洁标籤和无过敏原成分的高度采用。
目录
第一章:方法论与范围
第二章:执行概要
第三章:行业洞察
- 产业生态系分析
- 供应商格局
- 利润率
- 每个阶段的价值增加
- 影响价值链的因素
- 中断
- 产业影响因素
- 成长驱动因素
- 产业陷阱与挑战
- 市场机会
- 成长潜力分析
- 监管环境
- 北美洲
- 欧洲
- 亚太地区
- 拉丁美洲
- 中东和非洲
- 波特的分析
- PESTEL 分析
- 技术与创新格局
- 当前技术趋势
- 新兴技术
- 价格趋势
- 按地区
- 按类型
- 未来市场趋势
- 技术与创新格局
- 当前技术趋势
- 新兴技术
- 专利格局
- 贸易统计(HS编码)(註:仅提供重点国家的贸易统计资料)
- 主要进口国
- 主要出口国
- 永续性和环境方面
- 永续实践
- 减少废弃物策略
- 生产中的能源效率
- 环保倡议
- 碳足迹考量
第四章:竞争格局
- 介绍
- 公司市占率分析
- 按地区
- 北美洲
- 欧洲
- 亚太地区
- 拉丁美洲
- MEA
- 按地区
- 公司矩阵分析
- 主要市场参与者的竞争分析
- 竞争定位矩阵
- 关键进展
- 併购
- 合作伙伴关係与合作
- 新产品发布
- 扩张计划
第五章:市场估算与预测:依类型划分,2022-2035年
- 分离物
- 浓缩物
- 其他的
第六章:市场估算与预测:依应用领域划分,2022-2035年
- 食品和饮料
- 肉类替代品
- 不含乳製品
- 糖果
- 麵包店
- 加工食品
- 典型食物
- 其他的
- 餵食
第七章:市场估计与预测:依地区划分,2022-2035年
- 北美洲
- 我们
- 加拿大
- 欧洲
- 德国
- 英国
- 法国
- 西班牙
- 义大利
- 欧洲其他地区
- 亚太地区
- 中国
- 印度
- 日本
- 澳洲
- 韩国
- 亚太其他地区
- 拉丁美洲
- 巴西
- 墨西哥
- 阿根廷
- 拉丁美洲其他地区
- 中东和非洲
- 沙乌地阿拉伯
- 南非
- 阿联酋
- 中东和非洲其他地区
第八章:公司简介
- Royal Avebe
- Emsland Group
- Roquette Freres
- KMC Ingredients
- AKV AMBA
- PEPEES Group
- Kemin Industries
- Bioriginal Food and Science Corporation
- AGRANA Group
- PPZ Niechlow SA
- Finnamyl
- Nutragreenlife Biotechnology Co., Ltd.
- Hongjiu Biotech Co., Ltd.
The Global Potato Protein Market was valued at USD 205.9 million in 2025 and is estimated to grow at a CAGR of 5.1% to reach USD 355 million by 2035.
Market growth is supported by rising demand for plant-based, high-quality protein ingredients across food, nutrition, and feed industries. Potato protein is derived from potato tubers through advanced industrial extraction and purification processes that produce concentrates and isolates with strong nutritional and functional performance. These proteins are recognized for balanced amino acid composition, digestibility levels above 95%, and low allergenic potential, which supports broader consumer acceptance. Ongoing advancements in processing efficiency and protein recovery have improved yield while preserving native protein functionality. Modern filtration systems and optimized processing conditions enable manufacturers to deliver high-purity products with consistent quality. Continuous innovation in processing techniques has expanded the functional versatility of potato protein, allowing it to perform effectively across diverse formulations. Sustainability considerations and improved resource utilization further strengthen market appeal. Enhanced drying and particle engineering technologies have improved dispersibility, stability, and rehydration performance, supporting wider adoption. Together, these factors position potato protein as a reliable and scalable solution for manufacturers seeking clean-label, plant-derived protein ingredients.
| Market Scope | |
|---|---|
| Start Year | 2025 |
| Forecast Year | 2026-2035 |
| Start Value | $205.9 Million |
| Forecast Value | $355 Million |
| CAGR | 5.1% |
The isolates segment generated USD 94.7 million in 2025 and is expected to grow steadily due to demand from specialized nutrition and premium food categories. These products are designed with precise functional and solubility characteristics and minimal additives to meet strict nutritional standards. High purity and digestibility requirements support premium pricing, with isolates typically priced 40% to 60% higher than concentrates due to advanced processing complexity.
The feed applications segment reached USD 115.2 million in 2025. This segment benefits from consistent demand for highly digestible protein sources in specialized animal nutrition, supporting stable long-term consumption.
U.S. Potato Protein Market was valued at USD 48.3 million in 2025. Strong domestic demand is supported by advanced food processing infrastructure, a well-established plant-based sector, and high adoption of clean-label and allergen-free ingredients across the food and animal nutrition industries.
Key companies operating in the Global Potato Protein Market include Roquette Freres, Royal Avebe, Emsland Group, KMC Ingredients, AGRANA Group, AKV AMBA, Kemin Industries, PEPEES Group, Bioriginal Food and Science Corporation, Finnamyl, PPZ Niechlow S.A., Nutragreenlife Biotechnology Co., Ltd., and Hongjiu Biotech Co., Ltd. Companies in the Global Potato Protein Market are strengthening their competitive position through continuous investment in processing innovation, sustainability initiatives, and capacity expansion. Manufacturers focus on improving extraction efficiency and protein functionality to meet evolving customer specifications. Strategic partnerships with food and feed producers help secure long-term supply agreements and expand application reach. Many players emphasize clean-label positioning and traceable sourcing to align with regulatory and consumer expectations.
Table of Contents
Chapter 1 Methodology & Scope
- 1.1 Market scope and definition
- 1.2 Research design
- 1.2.1 Research approach
- 1.2.2 Data collection methods
- 1.3 Data mining sources
- 1.3.1 Global
- 1.3.2 Regional/Country
- 1.4 Base estimates and calculations
- 1.4.1 Base year calculation
- 1.4.2 Key trends for market estimation
- 1.5 Primary research and validation
- 1.5.1 Primary sources
- 1.6 Forecast model
- 1.7 Research assumptions and limitations
Chapter 2 Executive Summary
- 2.1 Industry 3600 synopsis
- 2.2 Key market trends
- 2.2.1 Type
- 2.2.2 Application
- 2.2.3 Regional
- 2.3 TAM Analysis, 2025-2035
- 2.4 CXO perspectives: Strategic imperatives
- 2.4.1 Executive decision points
- 2.4.2 Critical success factors
- 2.5 Future outlook and strategic recommendations
Chapter 3 Industry Insights
- 3.1 Industry ecosystem analysis
- 3.1.1 Supplier landscape
- 3.1.2 Profit margin
- 3.1.3 Value addition at each stage
- 3.1.4 Factor affecting the value chain
- 3.1.5 Disruptions
- 3.2 Industry impact forces
- 3.2.1 Growth drivers
- 3.2.2 Industry pitfalls and challenges
- 3.2.3 Market opportunities
- 3.3 Growth potential analysis
- 3.4 Regulatory landscape
- 3.4.1 North America
- 3.4.2 Europe
- 3.4.3 Asia Pacific
- 3.4.4 Latin America
- 3.4.5 Middle East & Africa
- 3.5 Porter's analysis
- 3.6 PESTEL analysis
- 3.7 Technology and innovation landscape
- 3.7.1 Current technological trends
- 3.7.2 Emerging technologies
- 3.8 Price trends
- 3.8.1 By region
- 3.8.2 By type
- 3.9 Future market trends
- 3.10 Technology and innovation landscape
- 3.10.1 Current technological trends
- 3.10.2 Emerging technologies
- 3.11 Patent landscape
- 3.12 Trade statistics (HS code) (Note: the trade statistics will be provided for key countries only)
- 3.12.1 Major importing countries
- 3.12.2 Major exporting countries
- 3.13 Sustainability and environmental aspects
- 3.13.1 Sustainable practices
- 3.13.2 Waste reduction strategies
- 3.13.3 Energy efficiency in production
- 3.13.4 Eco-friendly initiatives
- 3.14 Carbon footprint consideration
Chapter 4 Competitive Landscape, 2025
- 4.1 Introduction
- 4.2 Company market share analysis
- 4.2.1 By region
- 4.2.1.1 North America
- 4.2.1.2 Europe
- 4.2.1.3 Asia Pacific
- 4.2.1.4 LATAM
- 4.2.1.5 MEA
- 4.2.1 By region
- 4.3 Company matrix analysis
- 4.4 Competitive analysis of major market players
- 4.5 Competitive positioning matrix
- 4.6 Key developments
- 4.6.1 Mergers & acquisitions
- 4.6.2 Partnerships & collaborations
- 4.6.3 New product launches
- 4.6.4 Expansion plans
Chapter 5 Market Estimates and Forecast, By Type, 2022-2035 (USD Million) (Kilo Tons)
- 5.1 Key trends
- 5.2 Isolates
- 5.3 Concentrates
- 5.4 Others
Chapter 6 Market Estimates and Forecast, By Application, 2022-2035 (USD Million) (Kilo Tons)
- 6.1 Key trends
- 6.2 Food & Beverages
- 6.2.1 Meat Analogue
- 6.2.2 Dairy-free
- 6.2.3 Confectionery
- 6.2.4 Bakery
- 6.2.5 Processed foods
- 6.2.6 Typical foods
- 6.2.7 Others
- 6.3 Feed
Chapter 7 Market Estimates and Forecast, By Region, 2022-2035 (USD Million) (Kilo Tons)
- 7.1 Key trends
- 7.2 North America
- 7.2.1 U.S.
- 7.2.2 Canada
- 7.3 Europe
- 7.3.1 Germany
- 7.3.2 UK
- 7.3.3 France
- 7.3.4 Spain
- 7.3.5 Italy
- 7.3.6 Rest of Europe
- 7.4 Asia Pacific
- 7.4.1 China
- 7.4.2 India
- 7.4.3 Japan
- 7.4.4 Australia
- 7.4.5 South Korea
- 7.4.6 Rest of Asia Pacific
- 7.5 Latin America
- 7.5.1 Brazil
- 7.5.2 Mexico
- 7.5.3 Argentina
- 7.5.4 Rest of Latin America
- 7.6 Middle East and Africa
- 7.6.1 Saudi Arabia
- 7.6.2 South Africa
- 7.6.3 UAE
- 7.6.4 Rest of Middle East and Africa
Chapter 8 Company Profiles
- 8.1 Royal Avebe
- 8.2 Emsland Group
- 8.3 Roquette Freres
- 8.4 KMC Ingredients
- 8.5 AKV AMBA
- 8.6 PEPEES Group
- 8.7 Kemin Industries
- 8.8 Bioriginal Food and Science Corporation
- 8.9 AGRANA Group
- 8.10 PPZ Niechlow S.A.
- 8.11 Finnamyl
- 8.12 Nutragreenlife Biotechnology Co., Ltd.
- 8.13 Hongjiu Biotech Co., Ltd.
 全球马铃薯蛋白市场规模、份额、趋势和成长分析报告(2026-2034年)
 马铃薯蛋白市场:按类型、应用、通路和地区划分
 马铃薯蛋白市场规模、份额及成长分析(依产品类型、应用、通路、最终用户及地区划分)-2026-2033年产业预测
 马铃薯蛋白市场-全球产业规模、份额、趋势、机会和预测,按类型(浓缩物、分离物)、应用、性质(有机、常规)、地区和竞争格局划分,2020-2030年预测马铃薯蛋白市场:2025 年至 2030 年预测
 全球马铃薯蛋白市场:产业分析、规模、份额、成长、趋势和预测(2025-2032 年)全球马铃薯蛋白市场规模:按类型、原产地、应用、地区、范围和预测
 马铃薯分离蛋白市场报告:2030 年趋势、预测与竞争分析
 全球马铃薯蛋白市场
 全球马铃薯蛋白市场规模、份额和趋势分析报告(按类型(分离和浓缩)、按应用(动物饲料、补充剂、烘焙和糖果、肉类等)、按区域展望和预测,2024 - 2031 年)