


 |
市场调查报告书
商品编码
1913346
2026年至2035年货柜市场机会、成长要素、产业趋势分析及预测Shipping Containers Market Opportunity, Growth Drivers, Industry Trend Analysis, and Forecast 2026 - 2035 |
||||||
全球货柜市场预计到 2025 年价值 112 亿美元,到 2035 年达到 167 亿美元,年复合成长率为 4.1%。
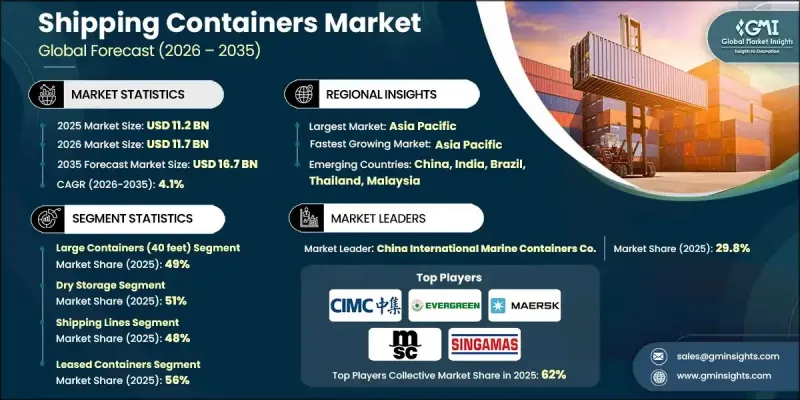
这一成长主要得益于消费品、工业产品和原物料国际贸易的持续扩张。亚洲国家强劲的製造业生产、已开发国家进口依赖度的提高以及全球供应链日益复杂化,都推动了货柜货运量的成长。这些趋势支撑了对新货柜生产、老旧船队更新换代以及全球货柜租赁业务的持续需求。预计2025年全球货柜贸易量将保持强劲成长,增幅在3.5%至4.2%之间,将增强整个海运网路对货柜需求的长期信心。
| 市场覆盖范围 | |
|---|---|
| 开始年份 | 2025 |
| 预测年份 | 2026-2035 |
| 起始值 | 112亿美元 |
| 预测金额 | 167亿美元 |
| 复合年增长率 | 4.1% |
全球电子商务的快速发展显着推动了货柜运输量的成长,尤其是在大宗零售和科技产品主导方面。跨境贸易的加速发展,催生了对灵活且扩充性的物流解决方案的需求,进而推动了干货集装箱和高箱集装箱在海运、铁路和多式联运系统中的广泛应用。为了因应不断变化的货物需求,航运公司越来越多地采用货柜租赁模式,以降低资本风险并提高营运灵活性。租赁模式能够实现更快的船队调整、更好的成本控制和更高的现金流效率。
预计到2025年,40英尺大型货柜将占据49%的市场份额,并在2026年至2035年间以3%的复合年增长率增长。由于其比20英尺货柜更大的载货量,这些货柜已成为全球标准,尤其适用于运输大量消费品和工业品。其更大的负载容量能力有助于提高长途和多式联运的成本效益和规模经济效益。
预计到2025年,干货货柜市场占有率将达到51%,并在2035年之前以3%的复合年增长率成长。这些货柜广泛用于运输普通货物,因其耐用性、成本效益和保护货物免受环境影响的能力而备受青睐。它们与海运、铁路和陆路运输的兼容性使其成为全球物流运营的重要组成部分。
预计到2025年,美国海运货柜市场规模将达15.1亿美元。零售进口的成长和电子商务的蓬勃发展推动了市场成长,也带动了对租赁和自有货柜的需求。港口基础设施的投资和多式联运的改善也促进了货柜吞吐量的成长。在国内和国际供应链中营运的企业正在加速采用更大容量的货柜,以提高物流效率、缩短运输时间并降低整体运输成本。
目录
第一章调查方法
第二章执行摘要
第三章业界考察
- 生态系分析
- 供应商情况
- 利润率
- 成本结构
- 每个阶段的附加价值
- 影响价值链的因素
- 中断
- 产业影响因素
- 司机
- 世界贸易量成长
- 电子商务与零售物流的扩张
- 人们对货柜租赁的需求日益增长。
- 港口和码头基础设施开发
- 产业潜在风险与挑战
- 对贸易週期高度敏感
- 钢铁价格和製造成本波动;
- 市场机会
- 新兴贸易走廊的成长
- 对低温运输和冷藏货柜的需求不断增长
- 货柜维修和转售市场
- 货柜船队管理数位化
- 司机
- 成长潜力分析
- 监管环境
- 北美洲
- 美国运输部(DOT) 标准
- 职业安全与健康管理局 (OSHA) 指南
- 美国环保署(EPA)
- 欧洲
- EN ISO 容器标准
- 欧盟海关和安全法规
- BS EN/CEN 标准
- 国家标准(UNE、DIN等)
- 亚太地区
- 中国国家标准(GB)
- 日本JIS标准要求
- 韩国KS认证
- 印度BIS标准
- 泰国工业标准协会(TISI)
- 拉丁美洲
- INMETRO(国家计量研究院)
- INTI认证(国家技术研究院)
- NOM 标准(墨西哥官方标准)
- 中东和非洲
- ESMA/阿联酋合格评定计划 (ECAS)
- 海湾合作委员会技术法规
- SABS认证
- 北美洲
- 波特五力分析
- PESTEL 分析
- 科技与创新趋势
- 当前技术趋势
- 新兴技术
- 定价分析
- 副产品
- 按地区
- 生产统计
- 生产基地
- 消费基础
- 出口和进口
- 成本細項分析
- 专利分析
- 永续性和环境方面
- 永续实践
- 减少废弃物策略
- 生产中的能源效率
- 环保倡议
- 碳足迹考量
- 货柜船队趋势及使用率分析
- 货柜船队规模和运作
- 货柜可用性和不平衡趋势
- 贸易週期对车队利用率的影响
- 货柜租赁週期及收费系统分析
- 货柜生命週期及残值分析
- 引入数位化、追踪系统和智慧货柜
- 投资、资金筹措和资产支持型货柜模式
第四章 竞争情势
- 介绍
- 公司市占率分析
- 北美洲
- 欧洲
- 亚太地区
- 拉丁美洲
- 中东和非洲
- 主要市场公司的竞争分析
- 竞争定位矩阵
- 战略展望矩阵
- 重大进展
- 併购
- 伙伴关係与合作
- 新产品发布
- 企业扩张计画和资金筹措
第五章 2022-2035年按规模分類的市场估算与预测
- 小型货柜(20英尺)
- 大型货柜(40英尺)
- 高立方货柜
- 其他的
第六章 依容器类型分類的市场估算与预测,2022-2035年
- 干货储存
- 平板架
- 冷藏货柜
- 特殊用途
- 其他的
第七章 按客户分類的市场估算与预测,2022-2035年
- 货运代理
- 航运公司
- 物流公司
- 零售商
- 製造商
第八章 依最终用途分類的市场估算与预测,2022-2035年
- 食品/饮料
- 消费品
- 卫生保健
- 工业产品
- 石油和天然气
- 化学品
- 其他的
9. 按所有权类型分類的市场估算与预测,2022-2035 年
- 租赁货柜
- 自有货柜
第十章 2022-2035年各地区市场估计与预测
- 北美洲
- 美国
- 加拿大
- 欧洲
- 德国
- 英国
- 法国
- 义大利
- 西班牙
- 北欧国家
- 俄罗斯
- 波兰
- 罗马尼亚
- 亚太地区
- 中国
- 印度
- 日本
- 韩国
- ANZ
- 越南
- 印尼
- 拉丁美洲
- 巴西
- 墨西哥
- 阿根廷
- 中东和非洲
- 南非
- 沙乌地阿拉伯
- 阿拉伯聯合大公国
第十一章 公司简介
- 世界公司
- CAI International
- China International Marine Containers
- CMA CGM
- COSCO Shipping Lines
- Evergreen Marine
- Hapag-Lloyd
- Maersk(AP Moller-Maersk)
- Mediterranean Shipping Company(MSC)
- Ocean Network Express(ONE)
- 区域玩家
- Beacon Intermodal Leasing
- Blue Sky Intermodal
- CARU Containers
- CXIC Group Containers
- Dong Fang International Containers
- Raffles Lease
- Sea Box
- Singamas Container
- Touax Container Solutions
- 新兴企业
- Bulkhaul
- Jindo
- TLS Offshore Containers International
- W&K Container
- YMC Container Solutions
The Global Shipping Containers Market was valued at USD 11.2 billion in 2025 and is estimated to grow at a CAGR of 4.1% to reach USD 16.7 billion by 2035.
The growth is driven by sustained expansion in international trade involving consumer merchandise, industrial outputs, and raw materials. Strong manufacturing output across Asian economies, rising reliance on imports among developed nations, and the growing complexity of global supply chains are contributing to higher volumes of containerized freight. These dynamics are supporting ongoing demand for new container production, replacement of aging fleets, and increased container leasing activity worldwide. Global containerized trade volumes in 2025 demonstrated solid momentum, recording growth in the range of 3.5% to 4.2%, which reinforced long-term confidence in container demand across shipping networks.
| Market Scope | |
|---|---|
| Start Year | 2025 |
| Forecast Year | 2026-2035 |
| Start Value | $11.2 Billion |
| Forecast Value | $16.7 Billion |
| CAGR | 4.1% |
Rapid expansion of global e-commerce has significantly increased container-based transportation, particularly for high-volume retail and technology-driven goods. The acceleration of online cross-border trade has intensified the need for flexible and scalable logistics solutions, encouraging wider adoption of dry and high-cube containers across maritime, rail, and intermodal transport systems. In response to fluctuating freight demand, shipping operators are increasingly favoring container leasing models to limit capital exposure and improve operational agility. Leasing enables faster fleet adjustments, better cost control, and improved cash flow efficiency.
The large containers measuring 40 feet segment held 49% share in 2025 and is forecast to grow at a CAGR of 3% from 2026 to 2035. These containers remain the global standard due to their higher cargo capacity compared to 20-foot units, making them suitable for transporting bulk consumer and industrial shipments. Their ability to carry larger loads improves cost efficiency and supports economies of scale in long-distance and intermodal transportation.
The dry storage containers segment held 51% share in 2025 and is expected to grow at a CAGR of 3% through 2035. These containers are widely used for transporting general cargo and are favored for their durability, cost-effectiveness, and ability to protect goods from environmental exposure. Their compatibility with sea, rail, and land transport continues to make them essential to global logistics operations.
US Shipping Containers Market reached USD 1.51 billion in 2025. Growth is being fueled by higher retail imports and expanding e-commerce activity, which are increasing demand for both leased and owned containers. Investments in port infrastructure and improved intermodal connectivity are enhancing container throughput. Companies operating across domestic and international supply chains are increasingly deploying higher-capacity containers to improve logistics efficiency, shorten transit times, and reduce overall transportation costs.
Key companies operating in the Global Shipping Containers Market include Mediterranean Shipping, Maersk, CARU Containers, Evergreen Marine, Sea Box, China International Marine Containers Co, COSCO Shipping Lines, W&K Container, Singamas Container, and CMA CGM. Companies in the Global Shipping Containers Market are strengthening their competitive position through a combination of capacity optimization, fleet modernization, and expanded leasing services. Many players are investing in durable, standardized containers to support long-term fleet efficiency while addressing replacement demand. Strategic partnerships with logistics providers and port operators are being used to improve network reach and service reliability. Firms are also expanding leasing portfolios to attract cost-sensitive customers seeking flexibility.
Table of Contents
Chapter 1 Methodology
- 1.1 Research approach
- 1.2 Quality commitments
- 1.2.1 GMI AI policy & data integrity commitment
- 1.2.2 Research trail & confidence scoring
- 1.2.2.1 Research trail components
- 1.2.2.2 Scoring components
- 1.3 Data collection
- 1.3.1 Partial list of primary sources
- 1.4 Data mining sources
- 1.4.1 Paid sources
- 1.5 Base estimates and calculations
- 1.5.1 Base year calculation
- 1.6 Forecast model
- 1.7 Research transparency addendum
Chapter 2 Executive Summary
- 2.1 Industry 360° synopsis
- 2.2 Key market trends
- 2.2.1 Regional
- 2.2.2 Size
- 2.2.3 Container
- 2.2.4 Customer
- 2.2.5 End Use
- 2.2.6 Ownership
- 2.3 TAM analysis, 2026-2035
- 2.4 CXO perspectives: Strategic imperatives
- 2.4.1 Executive decision points
- 2.4.2 Critical success factors
- 2.5 Future outlook
- 2.6 Strategic recommendations
Chapter 3 Industry Insights
- 3.1 Industry ecosystem analysis
- 3.1.1 Supplier landscape
- 3.1.2 Profit margin
- 3.1.3 Cost structure
- 3.1.4 Value addition at each stage
- 3.1.5 Factor affecting the value chain
- 3.1.6 Disruptions
- 3.2 Industry impact forces
- 3.2.1 Growth drivers
- 3.2.1.1 Growth in global trade volumes
- 3.2.1.2 Expansion of e-commerce and retail logistics
- 3.2.1.3 Rising preference for container leasing
- 3.2.1.4 Infrastructure development at ports and terminals
- 3.2.2 Industry pitfalls and challenges
- 3.2.2.1 High exposure to trade cyclicality
- 3.2.2.2 Volatility in steel prices and manufacturing costs
- 3.2.3 Market opportunities
- 3.2.3.1 Growth in emerging trade corridors
- 3.2.3.2 Rising cold chain and reefer container demand
- 3.2.3.3 Container refurbishment and resale market
- 3.2.3.4 Digitalization of container fleet management
- 3.2.1 Growth drivers
- 3.3 Growth potential analysis
- 3.4 Regulatory landscape
- 3.4.1 North America
- 3.4.1.1 U.S. Department of Transportation (DOT) Standards
- 3.4.1.2 Occupational Safety and Health Administration (OSHA) Guidelines
- 3.4.1.3 U.S. Environmental Protection Agency (EPA)
- 3.4.2 Europe
- 3.4.2.1 EN ISO Container Standards
- 3.4.2.2 European Union Customs and Safety Regulations
- 3.4.2.3 BS EN / CEN Standards
- 3.4.2.4 National Standards (UNE, DIN, etc.)
- 3.4.3 Asia Pacific
- 3.4.3.1 China GB (Guobiao) Standards
- 3.4.3.2 Japan JIS Requirements
- 3.4.3.3 Korea KS Certification
- 3.4.3.4 Indian BIS Standards
- 3.4.3.5 Thai Industrial Standards Institute (TISI)
- 3.4.4 Latin America
- 3.4.4.1 INMETRO (National Institute of Metrology)
- 3.4.4.2 INTI certification (Instituto Nacional de Tecnologia Industrial)
- 3.4.4.3 NOM standards (Norma Official Mexicana)
- 3.4.5 Middle East & Africa
- 3.4.5.1 ESMA / Emirates Conformity Assessment Scheme (ECAS)
- 3.4.5.2 GCC technical regulations
- 3.4.5.3 SABS certification
- 3.4.1 North America
- 3.5 Porter's analysis
- 3.6 PESTEL analysis
- 3.7 Technology and innovation landscape
- 3.7.1 Current technological trends
- 3.7.2 Emerging technologies
- 3.8 Pricing analysis
- 3.8.1 By product
- 3.8.2 By region
- 3.9 Production statistics
- 3.9.1 Production hubs
- 3.9.2 Consumption hubs
- 3.9.3 Export and import
- 3.10 Cost breakdown analysis
- 3.11 Patent analysis
- 3.12 Sustainability and environmental aspects
- 3.12.1 Sustainable practices
- 3.12.2 Waste reduction strategies
- 3.12.3 Energy efficiency in production
- 3.12.4 Eco-friendly initiatives
- 3.12.5 Carbon footprint considerations
- 3.13 Container fleet dynamics & utilization analysis
- 3.13.1 Container fleet size and active utilization rates
- 3.13.2 Container availability and imbalance trends
- 3.13.3 Impact of trade cycles on fleet utilization
- 3.14 Container leasing cycle & rate structure analysis
- 3.15 Container lifecycle & residual value analysis
- 3.16 Digitalization, tracking & smart container adoption
- 3.17 Investment, financing & asset-backed container models
Chapter 4 Competitive Landscape, 2025
- 4.1 Introduction
- 4.2 Company market share analysis
- 4.2.1 North America
- 4.2.2 Europe
- 4.2.3 Asia Pacific
- 4.2.4 LATAM
- 4.2.5 MEA
- 4.3 Competitive analysis of major market players
- 4.4 Competitive positioning matrix
- 4.5 Strategic outlook matrix
- 4.6 Key developments
- 4.6.1 Mergers & acquisitions
- 4.6.2 Partnerships & collaborations
- 4.6.3 New product launches
- 4.6.4 Expansion plans and funding
Chapter 5 Market Estimates & Forecast, By Size, 2022 - 2035 ($Mn, Units)
- 5.1 Key trends
- 5.2 Small containers (20 feet)
- 5.3 Large containers (40 feet)
- 5.4 High cube containers
- 5.5 Others
Chapter 6 Market Estimates & Forecast, By Container, 2022 - 2035 ($Mn, Units)
- 6.1 Key trends
- 6.2 Dry storage
- 6.3 Flat rack
- 6.4 Refrigerated
- 6.5 Special purpose
- 6.6 Others
Chapter 7 Market Estimates & Forecast, By Customer, 2022 - 2035 ($Mn, Units)
- 7.1 Key trends
- 7.2 Freight forwarders
- 7.3 Shipping lines
- 7.4 Logistics companies
- 7.5 Retailers
- 7.6 Manufacturers
Chapter 8 Market Estimates & Forecast, By End Use, 2022 - 2035 ($Mn, Units)
- 8.1 Key trends
- 8.2 Food & beverages
- 8.3 Consumer goods
- 8.4 Healthcare
- 8.5 Industrial products
- 8.6 Oil & gas
- 8.7 Chemicals
- 8.8 Others
Chapter 9 Market Estimates & Forecast, By Ownership, 2022 - 2035 ($Mn, Units)
- 9.1 Key trends
- 9.2 Leased containers
- 9.3 Owned containers
Chapter 10 Market Estimates & Forecast, By Region, 2022 - 2035 ($Mn, Units)
- 10.1 Key trends
- 10.2 North America
- 10.2.1 US
- 10.2.2 Canada
- 10.3 Europe
- 10.3.1 Germany
- 10.3.2 UK
- 10.3.3 France
- 10.3.4 Italy
- 10.3.5 Spain
- 10.3.6 Nordics
- 10.3.7 Russia
- 10.3.8 Poland
- 10.3.9 Romania
- 10.4 Asia Pacific
- 10.4.1 China
- 10.4.2 India
- 10.4.3 Japan
- 10.4.4 South Korea
- 10.4.5 ANZ
- 10.4.6 Vietnam
- 10.4.7 Indonesia
- 10.5 Latin America
- 10.5.1 Brazil
- 10.5.2 Mexico
- 10.5.3 Argentina
- 10.6 MEA
- 10.6.1 South Africa
- 10.6.2 Saudi Arabia
- 10.6.3 UAE
Chapter 11 Company Profiles
- 11.1 Global companies
- 11.1.1 CAI International
- 11.1.2 China International Marine Containers
- 11.1.3 CMA CGM
- 11.1.4 COSCO Shipping Lines
- 11.1.5 Evergreen Marine
- 11.1.6 Hapag-Lloyd
- 11.1.7 Maersk (A.P. Moller-Maersk)
- 11.1.8 Mediterranean Shipping Company (MSC)
- 11.1.9 Ocean Network Express (ONE)
- 11.2 Regional players
- 11.2.1 Beacon Intermodal Leasing
- 11.2.2 Blue Sky Intermodal
- 11.2.3 CARU Containers
- 11.2.4 CXIC Group Containers
- 11.2.5 Dong Fang International Containers
- 11.2.6 Raffles Lease
- 11.2.7 Sea Box
- 11.2.8 Singamas Container
- 11.2.9 Touax Container Solutions
- 11.3 Emerging players
- 11.3.1 Bulkhaul
- 11.3.2 Jindo
- 11.3.3 TLS Offshore Containers International
- 11.3.4 W&K Container
- 11.3.5 YMC Container Solutions
 海运货柜:市场占有率分析、产业趋势与统计、成长预测(2026-2031)
 全球智慧货柜市场规模、份额、趋势和成长分析报告(2026-2034)全球货柜市场规模、份额、趋势和成长分析报告(2026-2034)
 货柜市场报告:按产品、货柜尺寸、应用和地区划分(2026-2034 年)
 2026年全球货柜市场报告2026年全球锅炉、储槽和运输货柜市场报告
 国际货柜运输服务市场按货柜类型、服务类型、货柜尺寸、运输方式、承运人类型和最终用途产业划分-全球预测(2026-2032 年)按服务类型、货柜类型、货柜尺寸和最终用户产业分類的货柜航运市场-2026-2032年全球预测货柜航运服务市场按服务类型、货柜类型、运输方式、航线类型和最终用户产业划分-2026-2032年全球预测货柜航运:市场占有率分析、产业趋势与统计、成长预测(2026-2031)