


 |
市场调查报告书
商品编码
1441696
货运与物流:市场占有率分析、产业趋势与统计、成长预测(2024-2029)Freight and Logistics - Market Share Analysis, Industry Trends & Statistics, Growth Forecasts (2024 - 2029) |
||||||
价格
※ 本网页内容可能与最新版本有所差异。详细情况请与我们联繫。
简介目录
货运和物流市场规模预计到 2024 年为 6.3 兆美元,预计到 2029 年将达到 7.54 兆美元,在预测期内(2024-2029 年)成长 4.57%。复合年增长率为
亚太地区引领全球机场基础建设投资,其次是欧洲和美国
- 2020年,中国引领全球基础设施支出,但到2022年5月,欧洲和美国在目前正在进行的最昂贵的基础设施计划中处于主导。截至2021年,美国拥有全世界最长的铁路网,全长超过6万公里,超过俄罗斯、中国和印度。
- 截至 2022 年 5 月,印度在建和计画中的基础设施计划数量居世界首位,价值 2,500 万美元。相较之下,美国有1,866个计划,中国有1,175个计划。美国加州高铁计划被公认为世界上最有价值的基础建设计划之一,截至2022年10月估计价值1,130亿美元。铁路线占重大基础设施计划的很大一部分。目前正在开发中,不仅涵盖日本,也涵盖挪威、瑞典、英国、美国、亚洲以及东南亚各个地区。
- 截至2022年3月,亚太地区在建机场基础建设计划数量领先,总合230个计划,包括跑道和航站楼等各种组件。这些计划的总成本达2275亿美元。紧随其后的是欧洲,其在建机场基础设施计划数量位居第二,有 178 个在建计划,总价值 1,090 亿美元。然而,考虑到全球机场建设的总体支出,北美的总投资额为1,175亿美元,略高于其他地区。
不确定性中蕴藏着巨大的可能性
- 亚太地区、北美和欧洲以及南美和海湾国家主导全球货运和物流市场。 2022年全球卡车运输量与前一年同期比较成长3.6%,但供应链瓶颈仍持续影响公路货运。由于亚太和欧洲的大量投资,全球铁路业在2020年和2022年分别成长1.6%和4.1%。预计到 2027 年,铁路业的复合年增长率将达到 3%。乌克兰战争和影响全球经济成长的通膨上升可能会影响占全球贸易货运量 80% 的全球航运业。 2022年10月全球航空货运需求与前一年同期比较%,但同月较上季成长3.5%。因此,经济不确定性预计将影响预测期内的航空货运需求。
- 在电子商务和製造业的推动下,到 2030 年,仓储和物流库存可能会翻一番,达到 7 亿平方英尺以上。 2022 年第三季度,该产业的租赁活动较上季成长 40%,达到 920 万平方英尺。此外,由于电商热潮,2021年13个主要国家的包裹量与前一年同期比较增加21%。预计2022年至2027年复合年增长率为8.5%。美国2021年收益最高,中国产生1,080亿个小包裹。
- 物流中心,例如 2021 年启用的巴林全球海空物流中心,有潜力提供具有成本效益且更快捷的货物运输。为了实现仓储的升级和现代化,亚太地区 90% 的仓库营运商正在投资下一代自动化技术,预计将在未来五年内向全球扩张。
全球货运和物流市场趋势
在投资增加的推动下,北美运输和仓储市场2022年成长21.35%,达到6,426亿美元。
- 在亚太地区,运输需求不断增加,特别是在世界海上贸易中占很大一部分的航运。该地区拥有全球最繁忙的 9 个货柜港口,占全球陆路货运量的 40% 以上。到 2050 年,该地区的货运需求预计将增加两倍。同时,德国已成为运输和仓储领域的领导者,进出口额位居世界第三,领先法国和英国。为了改善交通基础设施,德国政府计划在 2022 年之前在联邦高速公路上投资超过 120 亿欧元(128.1 亿美元),在水道上投资约 18.1 亿美元。
- 2022年全球外国直接投资(FDI)流量下降24%,至12,860亿美元,不包括卢森堡,与前一年同期比较减5%。美国仍是最大的 FDI 流入来源国,收到 3,180 亿美元,其次是中国,收到 1,800 亿美元,但水准较低。儘管跨境併购(M&A)活动因交易数量下降而放缓,但待开发区投资的前景仍然乐观。
- 由于电商仓库和配送中心的需求增加,北美的运输和仓储经历了显着增长,从2021年的14.31 %同比增长到2022年的21.35 %。这一增长涵盖了交通运输的各个方面,总计达到6,426亿美元。 2022年,美国运输部将推出港口基础设施发展计划,为22个州的41个计划提供7.03亿美元,用于改善港口功能、提高供应链可靠性、创造就业机会,我们拨款超过1美元。
一年多来,俄罗斯入侵乌克兰扰乱了全球原油和石油产品市场。
- 2022 年全球平均汽油价格为每公升 1.22 美元,较去年与前一年同期比较上涨 19%,高于感染疾病-19 之前的水准。继2021年经济復苏后,2022年因战争导致供应中断的风险导致原油价格上涨,导致价格上涨。与其他地区相比,欧洲的汽油价格最高。冰岛、挪威、丹麦、希腊、芬兰和荷兰的汽油特别昂贵,每加仑 7.6 美元。
- 布兰特原油价格2022年上半年大幅上涨,但下半年整体下跌。 2022年布兰特原油现货价格平均为每桶100美元。 OPEC原油总产量从2022年第三季的平均每天2,920万桶下降至2022年第四季的每天2,860万桶。预计 2023 年 OPEC 原油产量平均为 2,890 万桶/日。儘管全球需求继续上升至接近历史最高水平,但随着俄罗斯和沙乌地阿拉伯继续减产总合130 万桶/日,油价已达到 11 月以来的最高点。我是。
- 由于柴油是由原油生产的,因此原油价格与柴油价格密切相关。由于对全球柴油供应的担忧,2022年春季美国和全球柴油价格快速上涨。儘管2022年下半年油价下跌,但由于季节性需求以及对欧洲柴油供应的担忧,美国柴油期货价格在2022年10月再次上涨至每加仑3.95美元。俄罗斯是欧洲最大的柴油供应国。 2023年,欧洲和美国的柴油价格都下跌,因为欧洲能够用从其他地区进口的柴油来取代从俄罗斯进口的大部分柴油。
货运及物流业概况
货运物流市场较分散,前五名企业占8.53%。该市场的主要企业包括 AP Moller-Maersk、CMA CGM、Deutsche Post DHL Group、FedEx、United Parcel Service(按字母顺序排列)。
其他福利
- Excel 格式的市场预测 (ME) 表
- 3 个月分析师支持
目录
第一章执行摘要和主要发现
第二章 提供报告
第三章简介
- 研究假设和市场定义
- 调查范围
- 调查方法
第四章 产业主要趋势
- 人口统计
- 按经济活动分類的 GDP 分布
- 按经济活动分類的 GDP 成长率
- 通货膨胀
- 经济表现和概况
- 电商产业趋势
- 製造业趋势
- 交通运输仓储业GDP
- 出口趋势
- 进口趋势
- 燃油价格
- 卡车运输营运成本
- 按类型分類的卡车车队规模
- 物流成果
- 主要卡车供应商
- 模态份额
- 海运船队承载能力能力
- 班轮运输连接
- 港口停靠和性能
- 货运价格趋势
- 货物吨位趋势
- 基础设施
- 法律规范(公路和铁路)
- 阿根廷
- 澳洲
- 巴西
- 加拿大
- 智利
- 中国
- 埃及
- 法国
- 德国
- 印度
- 印尼
- 义大利
- 日本
- 马来西亚
- 墨西哥
- 荷兰
- 奈及利亚
- 北欧的
- 卡达
- 俄罗斯
- 沙乌地阿拉伯
- 南非
- 西班牙
- 泰国
- 阿拉伯聯合大公国
- 英国
- 美国
- 越南
- 法律规范(海运和空运)
- 阿根廷
- 澳洲
- 巴西
- 加拿大
- 智利
- 中国
- 埃及
- 法国
- 德国
- 印度
- 印尼
- 义大利
- 日本
- 马来西亚
- 墨西哥
- 荷兰
- 奈及利亚
- 北欧的
- 卡达
- 俄罗斯
- 沙乌地阿拉伯
- 南非
- 西班牙
- 泰国
- 阿拉伯聯合大公国
- 英国
- 美国
- 越南
- 价值炼和通路分析
第五章市场区隔(1.所有细分市场的美元市场价值2.部分细分市场规模、货运、CEP(宅配、快捷邮件和小包裹)、仓储和仓储3.到2029年增长前景的预测和分析)
- 最终用户产业
- 农业、渔业、林业
- 建造
- 製造业
- 石油和天然气、采矿和采石业
- 批发零售业
- 其他的
- 物流功能
- 宅配、快捷邮件、小包裹
- 按目的地类型
- 国内的
- 国际的
- 货物运输
- 透过交通工具
- 航空
- 海洋和内陆水道
- 其他的
- 货物运输
- 透过交通工具
- 航空
- 管道
- 铁路
- 路
- 海洋和内陆水道
- 仓储及保管
- 温度控制
- 非温控
- 温度控制
- 其他服务
- 宅配、快捷邮件、小包裹
- 地区
- 非洲
- 按国家/地区
- 埃及
- 奈及利亚
- 南非
- 其他的
- 亚太地区
- 按国家/地区
- 澳洲
- 中国
- 印度
- 印尼
- 日本
- 马来西亚
- 泰国
- 越南
- 其他的
- 欧洲
- 按国家/地区
- 丹麦
- 芬兰
- 法国
- 德国
- 冰岛
- 义大利
- 荷兰
- 挪威
- 俄罗斯
- 西班牙
- 瑞典
- 英国
- 其他的
- GCC
- 按国家/地区
- 卡达
- 沙乌地阿拉伯
- 阿拉伯聯合大公国
- 其他的
- 北美洲
- 按国家/地区
- 加拿大
- 墨西哥
- 美国
- 其他的
- 南美洲
- 按国家/地区
- 阿根廷
- 巴西
- 智利
- 南美洲其他地区
- 世界其他地区
- 非洲
第六章 竞争形势
- 重大策略倡议
- 市场占有率分析
- 公司形势
- 公司概况(包括全球概况、市场层级、核心业务部门、财务状况、员工人数、关键资讯、市场排名、市场占有率、产品和服务以及近期趋势分析)。
- AP Moller-Maersk
- AllCargo Logistics Ltd
- Americold
- Aramex
- Bollore logistics
- CH Robinson
- CJ Logistics
- CMA CGM
- CTS Logistics Group
- Culina Group
- Dachser
- DB Schenker
- Deutsche Post DHL Group
- DP World
- DSV A/S(De Sammensluttede Vognmand af Air and Sea)
- Expeditors International
- FedEx
- GEODIS
- GXO Logistics
- Hellmann Worldwide Logistics
- Hub Group Inc
- International Distributions Services
- JBHunt Transport Services Inc.
- Japan Post Holdings Co., Ltd.
- JD Logistics
- Kerry Logistics
- Kintetsu World Express
- Kuehne+Nagel
- La Poste Group
- Landstar System Inc.
- LOGWIN
- LX International Corp
- Mainfreight
- NFI Industries
- Nippon Yusen Kabushiki Kaisha(NYK Line)
- Orient Overseas Container Line(OOCL Logistics)
- Penske Logistics
- Poste Italiane
- Ryder Systems
- Savino Del Bene
- SF Express
- Sinotrans Limited
- TIBA Group
- Total Quality Logistics
- Uber Technologies Inc
- United Parcel Service
- XPO Logistics
- Yamato Holdings
第七章 CEO 面临的关键策略问题
第8章附录
- 世界概况
- 来源和参考文献
- 表格和图形列表
- 重要见解
- 资料包
- 词彙表
- 外汇
简介目录
Product Code: 48024
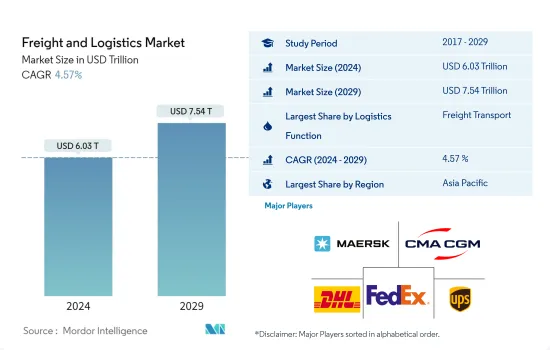
The Freight and Logistics Market size is estimated at USD 6.03 trillion in 2024, and is expected to reach USD 7.54 trillion by 2029, growing at a CAGR of 4.57% during the forecast period (2024-2029).
Asia-pacific leading the investment in airport infrastructure worldwide followed by Europe and United States
- In 2020, China led global infrastructure spending, but by May 2022, Europe and the United States had taken the lead in terms of the most costly infrastructure projects currently in progress. As of 2021, the United States boasted the world's longest railway network, surpassing Russia, China, and India, spanning over 60,000 kilometers.
- In May 2022, India led the global count with the highest number of ongoing or planned infrastructure projects, amounting to USD 25 million. Comparatively, the United States had 1,866 projects, while China had 1,175 projects. The project of the High-Speed Rail Line in California, USA, was identified as one of the most valuable infrastructure endeavors worldwide, with an estimated worth of USD 113 billion as of October 2022. Railway lines constituted a significant portion of the major infrastructure projects under development, encompassing countries such as Norway, Sweden, the United Kingdom, the United States, various regions in Asia and Southeast Asia, as well as Japan.
- In March 2022, the Asia-Pacific region led in terms of the number of airport infrastructure projects being constructed, with a total of 230 projects encompassing various components like runways and terminals. The combined value of these projects amounted to USD 227.5 billion. Following closely behind, Europe had the second-highest number of airport infrastructure projects under construction, with 178 ongoing projects valued at USD 109 billion. However, when considering the overall expenditure on airport construction worldwide, North America slightly surpassed the other regions, with a total investment of USD 117.5 billion.
Strong potential amidst uncertainties
- Asia-Pacific, North America, and Europe dominate the global freight and logistics market, along with South America and GCC. While global trucking volumes witnessed an increase of 3.6% YoY in 2022, supply chain bottlenecks continue to impact road freight transportation. Owing to significant investments in Asia-Pacific and Europe, the global rail industry witnessed a growth of 1.6% and 4.1%, respectively, in 2020 and 2022. The rail industry is expected to record a CAGR of 3% through 2027. The Russia-Ukraine war and soaring inflation impacting global growth can affect global shipping, which accounts for 80% of global trade transport. The demand for global air cargo fell by 13.6% YoY in October 2022 but recorded a 3.5% MoM increase in the same month. Hence, economic uncertainties are expected to impact the demand for air cargo during the forecast period.
- Driven by the e-commerce and manufacturing sectors, warehousing and logistics stock will likely double by 2030 to cross 700 million square feet. Leasing activity in the segment grew by 40% QoQ in Q3 2022 to amount to 9.2 million square feet. The e-commerce boom also fueled parcel volumes by 21% YoY in 2021 in 13 major economies. It is expected to record a CAGR of 8.5% through 2022-2027. The United States generated the highest revenue, while China generated 108 billion parcels in 2021.
- Logistics hubs, like Bahrain's Global Sea-to-Air Logistics Hub, launched in 2021, could provide cost-effective and faster freight transportation. In order to upgrade and modernize warehousing, 90% of Asia-Pacific warehouse operators are investing in next-gen automation tech, which is anticipated to boost the market globally in the next five years.
Global Freight and Logistics Market Trends
The North American transportation and storage market increased to 21.35% in 2022, valued at USD 642.60 billion, with investment boost
- Asia Pacific is experiencing increased demand for transportation, especially in shipping, which handles a significant portion of global seaborne trade. This region boasts nine of the world's busiest container ports and accounts for more than 40% of global surface freight transport. By 2050, freight transport demand in the region is projected to triple. Meanwhile, Germany has become a leader in the transportation and warehousing sector, surpassing France and the United Kingdom, ranking third globally in imports and exports. To improve transportation infrastructure, the German government plans to invest over EUR 12 billion (USD 12.81 billion) in federal highways and about USD 1.81 billion in waterways in 2022.
- Global foreign direct investment (FDI) flows in 2022 fell by 24%, totaling USD 1,286 billion, or a 5% decrease when excluding Luxembourg, compared to the previous year. The United States remained the top destination for FDI inflows, receiving USD 318 billion, followed by China with USD 180 billion, although at lower levels. Cross-border merger and acquisition (M&A) activity slowed down with fewer deals, while the outlook for greenfield investment remained positive.
- Transportation and storage in North America saw a significant growth boost, rising from 14.31% YoY in 2021 to 21.35% YoY in 2022, driven by increased demand for e-commerce warehousing and distribution centers. This growth encompassed various transportation facets, reaching a total value of USD 642.60 billion. In 2022, the US Department of Transportation introduced the Port Infrastructure Development Program, allocating more than USD 703 million for 41 projects in 22 states to improve port capabilities, enhance supply chain reliability, and create job opportunities.
For over a year, Russia's invasion of Ukraine, has disrupted global crude oil and petroleum product markets
- In 2022, the global average price of gasoline at the pump was 1.22 USD per litre, a 19% increase from the previous year, exceeding pre-COVID-19 levels. Following the 2021 rebound amid economic recovery, 2022 prices hiked following crude oil increase as a result of supply disruption risk amid war. Gasoline prices in Europe are the highest compared to other regions. Gasoline is particularly expensive in Iceland, Norway, Denmark, Greece, Finland, and the Netherlands at 7.6 USD per gallon.
- The Brent crude oil price rose significantly in the first half of 2022 but generally declined in the second half of the year. The Brent crude oil spot price averaged USD 100 per barrel in 2022. Total OPEC crude oil production fell from an average of 29.2 million b/d in Q3 2022 to 28.6 million b/d in Q4 2022. In 2023, OPEC crude oil production is expected to average 28.9 million barrels per day. Oil prices have peaked since last November as Russia and Saudi Arabia continue to cut a total of 1.3 million barrels a day from their output, even as global demand continues to rise to near-record levels.
- Diesel is produced from crude oil, so crude oil prices are closely linked to diesel prices. Diesel prices in the United States and globally increased rapidly in the spring of 2022 because of concerns about global diesel supply. Although crude oil prices declined in the second half of 2022, United States diesel futures prices rose again in October 2022 to USD 3.95 per gallon due to seasonal demand and diesel supply concerns for Europe. Russia has been Europe's largest supplier of diesel. In 2023, diesel prices have declined in both Europe and the United States as Europe has been able to replace most of the diesel it would have imported from Russia with imports from other regions.
Freight and Logistics Industry Overview
The Freight and Logistics Market is fragmented, with the top five companies occupying 8.53%. The major players in this market are A.P. Moller - Maersk, CMA CGM, Deutsche Post DHL Group, FedEx and United Parcel Service (sorted alphabetically).
Additional Benefits:
- The market estimate (ME) sheet in Excel format
- 3 months of analyst support
TABLE OF CONTENTS
1 EXECUTIVE SUMMARY & KEY FINDINGS
2 REPORT OFFERS
3 INTRODUCTION
- 3.1 Study Assumptions & Market Definition
- 3.2 Scope of the Study
- 3.3 Research Methodology
4 KEY INDUSTRY TRENDS
- 4.1 Demographics
- 4.2 GDP Distribution By Economic Activity
- 4.3 GDP Growth By Economic Activity
- 4.4 Inflation
- 4.5 Economic Performance And Profile
- 4.5.1 Trends in E-Commerce Industry
- 4.5.2 Trends in Manufacturing Industry
- 4.6 Transport And Storage Sector GDP
- 4.7 Export Trends
- 4.8 Import Trends
- 4.9 Fuel Price
- 4.10 Trucking Operational Costs
- 4.11 Trucking Fleet Size By Type
- 4.12 Logistics Performance
- 4.13 Major Truck Suppliers
- 4.14 Modal Share
- 4.15 Maritime Fleet Load Carrying Capacity
- 4.16 Liner Shipping Connectivity
- 4.17 Port Calls And Performance
- 4.18 Freight Pricing Trends
- 4.19 Freight Tonnage Trends
- 4.20 Infrastructure
- 4.21 Regulatory Framework (Road and Rail)
- 4.21.1 Argentina
- 4.21.2 Australia
- 4.21.3 Brazil
- 4.21.4 Canada
- 4.21.5 Chile
- 4.21.6 China
- 4.21.7 Egypt
- 4.21.8 France
- 4.21.9 Germany
- 4.21.10 India
- 4.21.11 Indonesia
- 4.21.12 Italy
- 4.21.13 Japan
- 4.21.14 Malaysia
- 4.21.15 Mexico
- 4.21.16 Netherlands
- 4.21.17 Nigeria
- 4.21.18 Nordics
- 4.21.19 Qatar
- 4.21.20 Russia
- 4.21.21 Saudi Arabia
- 4.21.22 South Africa
- 4.21.23 Spain
- 4.21.24 Thailand
- 4.21.25 UAE
- 4.21.26 United Kingdom
- 4.21.27 United States
- 4.21.28 Vietnam
- 4.22 Regulatory Framework (Sea and Air)
- 4.22.1 Argentina
- 4.22.2 Australia
- 4.22.3 Brazil
- 4.22.4 Canada
- 4.22.5 Chile
- 4.22.6 China
- 4.22.7 Egypt
- 4.22.8 France
- 4.22.9 Germany
- 4.22.10 India
- 4.22.11 Indonesia
- 4.22.12 Italy
- 4.22.13 Japan
- 4.22.14 Malaysia
- 4.22.15 Mexico
- 4.22.16 Netherlands
- 4.22.17 Nigeria
- 4.22.18 Nordics
- 4.22.19 Qatar
- 4.22.20 Russia
- 4.22.21 Saudi Arabia
- 4.22.22 South Africa
- 4.22.23 Spain
- 4.22.24 Thailand
- 4.22.25 UAE
- 4.22.26 United Kingdom
- 4.22.27 United States
- 4.22.28 Vietnam
- 4.23 Value Chain & Distribution Channel Analysis
5 MARKET SEGMENTATION (includes 1. Market value in USD for all segments 2. Market volume for select segments viz. freight transport, CEP (courier, express, and parcel) and warehousing & storage 3.Forecasts up to 2029 and analysis of growth prospects)
- 5.1 End User Industry
- 5.1.1 Agriculture, Fishing and Forestry
- 5.1.2 Construction
- 5.1.3 Manufacturing
- 5.1.4 Oil and Gas, Mining and Quarrying
- 5.1.5 Wholesale and Retail Trade
- 5.1.6 Others
- 5.2 Logistics Function
- 5.2.1 Courier, Express and Parcel
- 5.2.1.1 By Destination Type
- 5.2.1.1.1 Domestic
- 5.2.1.1.2 International
- 5.2.2 Freight Forwarding
- 5.2.2.1 By Mode Of Transport
- 5.2.2.1.1 Air
- 5.2.2.1.2 Sea and Inland Waterways
- 5.2.2.1.3 Others
- 5.2.3 Freight Transport
- 5.2.3.1 By Mode Of Transport
- 5.2.3.1.1 Air
- 5.2.3.1.2 Pipelines
- 5.2.3.1.3 Rail
- 5.2.3.1.4 Road
- 5.2.3.1.5 Sea and Inland Waterways
- 5.2.4 Warehousing and Storage
- 5.2.4.1 By Temperature Control
- 5.2.4.1.1 Non-Temperature Controlled
- 5.2.4.1.2 Temperature Controlled
- 5.2.5 Other Services
- 5.2.1 Courier, Express and Parcel
- 5.3 Region
- 5.3.1 Africa
- 5.3.1.1 By Country
- 5.3.1.1.1 Egypt
- 5.3.1.1.2 Nigeria
- 5.3.1.1.3 South Africa
- 5.3.1.1.4 Rest of Africa
- 5.3.2 Asia Pacific
- 5.3.2.1 By Country
- 5.3.2.1.1 Australia
- 5.3.2.1.2 China
- 5.3.2.1.3 India
- 5.3.2.1.4 Indonesia
- 5.3.2.1.5 Japan
- 5.3.2.1.6 Malaysia
- 5.3.2.1.7 Thailand
- 5.3.2.1.8 Vietnam
- 5.3.2.1.9 Rest of Asia Pacific
- 5.3.3 Europe
- 5.3.3.1 By Country
- 5.3.3.1.1 Denmark
- 5.3.3.1.2 Finland
- 5.3.3.1.3 France
- 5.3.3.1.4 Germany
- 5.3.3.1.5 Iceland
- 5.3.3.1.6 Italy
- 5.3.3.1.7 Netherlands
- 5.3.3.1.8 Norway
- 5.3.3.1.9 Russia
- 5.3.3.1.10 Spain
- 5.3.3.1.11 Sweden
- 5.3.3.1.12 United Kingdom
- 5.3.3.1.13 Rest of Europe
- 5.3.4 GCC
- 5.3.4.1 By Country
- 5.3.4.1.1 Qatar
- 5.3.4.1.2 Saudi Arabia
- 5.3.4.1.3 UAE
- 5.3.4.1.4 Rest of GCC
- 5.3.5 North America
- 5.3.5.1 By Country
- 5.3.5.1.1 Canada
- 5.3.5.1.2 Mexico
- 5.3.5.1.3 United States
- 5.3.5.1.4 Rest of North America
- 5.3.6 South America
- 5.3.6.1 By Country
- 5.3.6.1.1 Argentina
- 5.3.6.1.2 Brazil
- 5.3.6.1.3 Chile
- 5.3.6.1.4 Rest of South America
- 5.3.7 Rest of the World
- 5.3.1 Africa
6 COMPETITIVE LANDSCAPE
- 6.1 Key Strategic Moves
- 6.2 Market Share Analysis
- 6.3 Company Landscape
- 6.4 Company Profiles (includes Global Level Overview, Market Level Overview, Core Business Segments, Financials, Headcount, Key Information, Market Rank, Market Share, Products and Services, and Analysis of Recent Developments).
- 6.4.1 A.P. Moller - Maersk
- 6.4.2 AllCargo Logistics Ltd
- 6.4.3 Americold
- 6.4.4 Aramex
- 6.4.5 Bollore logistics
- 6.4.6 C.H Robinson
- 6.4.7 CJ Logistics
- 6.4.8 CMA CGM
- 6.4.9 CTS Logistics Group
- 6.4.10 Culina Group
- 6.4.11 Dachser
- 6.4.12 DB Schenker
- 6.4.13 Deutsche Post DHL Group
- 6.4.14 DP World
- 6.4.15 DSV A/S (De Sammensluttede Vognmand af Air and Sea)
- 6.4.16 Expeditors International
- 6.4.17 FedEx
- 6.4.18 GEODIS
- 6.4.19 GXO Logistics
- 6.4.20 Hellmann Worldwide Logistics
- 6.4.21 Hub Group Inc
- 6.4.22 International Distributions Services
- 6.4.23 J.B.Hunt Transport Services Inc.
- 6.4.24 Japan Post Holdings Co., Ltd.
- 6.4.25 JD Logistics
- 6.4.26 Kerry Logistics
- 6.4.27 Kintetsu World Express
- 6.4.28 Kuehne + Nagel
- 6.4.29 La Poste Group
- 6.4.30 Landstar System Inc.
- 6.4.31 LOGWIN
- 6.4.32 LX International Corp
- 6.4.33 Mainfreight
- 6.4.34 NFI Industries
- 6.4.35 Nippon Yusen Kabushiki Kaisha (NYK Line)
- 6.4.36 Orient Overseas Container Line (OOCL Logistics)
- 6.4.37 Penske Logistics
- 6.4.38 Poste Italiane
- 6.4.39 Ryder Systems
- 6.4.40 Savino Del Bene
- 6.4.41 SF Express
- 6.4.42 Sinotrans Limited
- 6.4.43 TIBA Group
- 6.4.44 Total Quality Logistics
- 6.4.45 Uber Technologies Inc
- 6.4.46 United Parcel Service
- 6.4.47 XPO Logistics
- 6.4.48 Yamato Holdings
7 KEY STRATEGIC QUESTIONS FOR FREIGHT AND LOGISTICS CEOS
8 APPENDIX
- 8.1 Global Overview
- 8.1.1 Overview
- 8.1.2 Porter's Five Forces Framework
- 8.1.3 Global Value Chain Analysis
- 8.1.4 Market Dynamics (Market Drivers, Restraints & Opportunities)
- 8.1.5 Technological Advancements
- 8.2 Sources & References
- 8.3 List of Tables & Figures
- 8.4 Primary Insights
- 8.5 Data Pack
- 8.6 Glossary of Terms
- 8.7 Currency Exchange Rate
02-2729-4219
+886-2-2729-4219
 货运和物流市场规模、份额和成长分析(按运输方式、服务、最终用户和地区划分)-2025-2032年产业预测
 中东欧货运与物流:市场占有率分析、产业趋势、统计数据与成长预测(2025-2030 年)新加坡货运与物流:市场份额分析、行业趋势、统计数据和成长预测(2025-2030 年)菲律宾货运与物流:市场份额分析、行业趋势、统计数据和成长预测(2025-2030 年)
 全球货物审核与结算市场预测(2025-2030)
 2032 年碳中和解决方案市场预测:按类型、组件、部署模式、组织规模、技术、最终用户和地区进行的全球分析
 2025年货运和物流全球市场报告
 货运审核与结算市场规模、份额及成长分析(依公司规模、最终用户、应用及地区)-2025 年至 2032 年产业预测
 2034 年货运与物流市场分析与预测:类型、产品、服务、技术、组件、应用、流程、模式、最终用户2025年全球货运车辆市场报告
▼