


 |
市场调查报告书
商品编码
1683204
美国生物肥料市场:市场占有率分析、产业趋势和成长预测(2025-2030 年)United States Biofertilizer - Market Share Analysis, Industry Trends & Statistics, Growth Forecasts (2025 - 2030) |
||||||
价格
※ 本网页内容可能与最新版本有所差异。详细情况请与我们联繫。
简介目录
预计 2025 年美国生物肥料市场规模为 6.4 亿美元,到 2030 年将达到 11.8 亿美元,预测期内(2025-2030 年)的复合年增长率为 12.89%。
- 生物肥料是含有促进植物生长的活微生物的有机物质。 2017 年至 2022 年期间,生物肥料市值预计将增长约 49.1%,这可归因于多种原因,例如农民意识的增强、美国註册有机农场总数的增加以及对有机或可持续种植产品的需求转变。
- 由于国家对生物肥料的需求不断增长,生物肥料市场在金额和数量方面都呈现整体上升趋势。
- 与其他生物肥料相比,根瘤菌生物肥料占有最大的市场占有率。预计 2023 年至 2029 年间其市场占有率将进一步成长。
- 菌根真菌在生物肥料市场中占有仅次于根瘤菌的第二大市场占有率,占 2022 年总市场金额的约 26.4%。紧随其后的是固氮螺菌,占 2022 年整个生物肥料市场的 24.4%。
- 目前正在进行研究,以开发耐生物/生物胁迫的菌株。例如,在盐分胁迫下,接种了三叶草根瘤菌的三叶草根瘤菌生物量和根瘤增加。积极的调查结果和该领域活跃公司的存在可能会在 2023-2029 年期间显着推动生物肥料市场的发展。
- 农民对过度使用化学肥料的认识不断提高,以及政府支持永续和有机农业的倡议,推动了对生物肥料的需求。因此,预计美国生物肥料市场将在 2023-2029 年期间成长。
美国生物肥料市场的趋势
由于国家法规的要求,有机种植的面积增加,尤其是连续作物。
- 2021年,美国有机农业面积为623,000公顷。美国的有机农业在过去二十年里取得了长足的发展,这主要归功于具体法律法规的实施。 2021年加州有机农场和牧场数量为3061个,是美国获得认证的有机农场最多的州。宾州有超过 1,125 个经过认证的有机农场。 2019 年,获得认证的有机农场有近 15,548,000 个,运作作物;有 7,139,000 个,经营牧场和草场。包括苗圃和温室在内的作物销售额达到近 58 亿美元。
- 该国的有机农业以耕作作物为主。 2021年,其占有机农地总面积的约71.8%。谷类生产在该国农业中占主导地位。主要谷物有玉米、小麦、米、小米。有机产品的消费在美国消费者中越来越受欢迎,越来越多的消费者因为有机食品具有多种健康益处而选择有机食品。
- 有机园艺作物的总种植面积正在增加,从 2017 年的 112,900 公顷增加到 2021 年的 156,100 公顷。就 2021 年国内产量而言,前五的水果和蔬菜是苹果(31.1%)、草莓(9.5%)、橘子(6.9%)、长叶莴苣(6.7%)和马铃薯(6.2%)。在贸易方面,进口额最大的产品是香蕉(53.1%)、酪梨(7.7%)、芒果(5.8%)、蓝莓(5.0%)和南瓜(4.3%),出口额最大的产品是苹果(80.0%)、梨子(14.4%)、樱桃(4.0%)、洋葱干(1.5%)。
有机农产品需求不断成长,尤其是水果和蔬菜领域,人均有机食品支出不断增加
- 美国是世界最大的有机产品消费国。根据《营养商业日誌》(NBJ,2021年)报道,截至 2020 年,该国有机食品总销售额达 516 亿美元。美国是北美地区有机产品人均支出最高的国家,2021年为186.7美元。
- 自有机食品零售业成立以来,有机新鲜水果和蔬菜一直是有机食品的主要类别。 2020 年,这些有机产品的零售额达到 200 亿美元,显示对有机农产品的需求不断增长。过去二十年来,对有机新鲜水果和蔬菜的需求稳定成长。有机食品销售的成长是由于消费者意识的增强,尤其是高所得族群。需求量最大的有机食品类别包括鸡蛋、乳製品、水果和蔬菜等主食。
- 不同人口和地区的人们对有机食品的偏好各不相同。 18-29 岁的年轻人比 65 岁以上的老年人更有可能想要有机产品(超过 50%)。收入和地区也起着一定的作用,收入低于 30,000 美元的人中有 42% 想要购买有机产品,而收入超过 75,000 美元的人中有 49% 想要购买有机产品。
- 该国在有机产品上的人均支出正在增加,2017-2021 年期间的复合年增长率为 5.2%。有机产品的需求不断增加,为美国有机生产商创造了进入国内和国际高价值市场的机会。有机产品的价格溢价是低收入消费者消费有机食品的主要限制因素之一。
美国生物肥料产业概况
美国生物肥料市场细分,前五大公司占22.98%。该市场的主要企业有 Kula Bio Inc.、Novozymes、Rizobacter、Sustane Natural Fertilizer Inc. 和 Symborg Inc.
其他福利
- Excel 格式的市场预测 (ME) 表
- 3 个月的分析师支持
目录
第 1 章执行摘要和主要发现
第二章 报告要约
第 3 章 简介
- 研究假设和市场定义
- 研究范围
- 调查方法
第四章 产业主要趋势
- 有机栽培面积
- 有机产品人均支出
- 法律规范
- 美国
- 价值链与通路分析
第五章 市场区隔
- 形式
- 固氮螺菌
- 固氮菌
- 菌根真菌
- 磷酸盐溶解细菌
- 根瘤菌
- 其他生物肥料
- 作物类型
- 经济作物
- 园艺作物
- 田间作物
第六章 竞争格局
- 重大策略倡议
- 市场占有率分析
- 业务状况
- 公司简介包括全球概况、市场层级概况、主要业务部门、财务状况、员工人数、关键资讯、市场排名、市场占有率、产品和服务以及最新发展分析。
- AgroLiquid
- Indogulf BioAg LLC(Indogulf 公司的生物技术部门)
- Koppert Biological Systems Inc.
- Kula Bio Inc.
- Lallemand Inc.
- Novozymes
- Rizobacter
- Sustane Natural Fertilizer Inc.
- Symborg Inc.
- The Andersons Inc.
第七章:执行长的关键策略问题
第 8 章 附录
- 世界概况
- 概述
- 五力分析框架
- 全球价值链分析
- 市场动态(DRO)
- 资讯来源和进一步阅读
- 图片列表
- 关键见解
- 资料包
- 词彙表
简介目录
Product Code: 64273
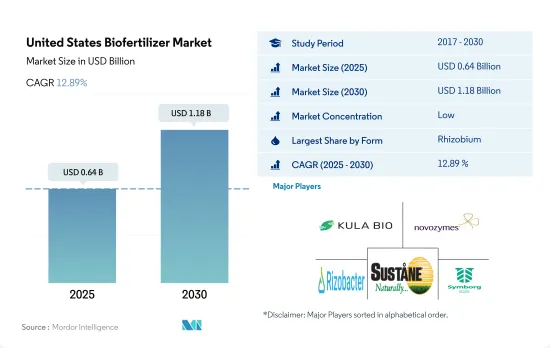
The United States Biofertilizer Market size is estimated at 0.64 billion USD in 2025, and is expected to reach 1.18 billion USD by 2030, growing at a CAGR of 12.89% during the forecast period (2025-2030).
- Biofertilizers are organic substances with living microorganisms that promote plant growth. The biofertilizer market value increased by about 49.1% between 2017 and 2022, which was attributed to various reasons like increasing awareness among farmers, increasing the overall registered organic farms in the United States, and a shift in demand for organically or sustainably grown commodities.
- An overall increasing trend is observed in the biofertilizer market both in terms of value and volume due to increasing demand for biofertilizers in the country.
- Rhizobium biofertilizer has the largest market share compared to other biofertilizers. It is anticipated to increase its market share further between 2023 and 2029.
- Mycorrhiza occupied the second-largest market share in the biofertilizer market, followed by Rhizobium, and accounted for about 26.4% of the total market value in 2022. It was followed by Azospirillum, which accounted for 24.4% of the total biofertilizer market value in 2022.
- Continuous research is being conducted to develop strains that are biotic/abiotic stress tolerant. For instance, under salinity stress, Rhizobium trifolii inoculated with Trifoliumalexandrinum showed increased biomass and nodulation. Positive research findings and the presence of active companies in this segment are likely to drive the biofertilizer market to a large extent between 2023 and 2029.
- The increasing awareness about the overuse of fertilizers among farmers and the government initiatives to support sustainable agricultural practices and organic farming resulted in a growing demand for biofertilizers. Therefore, the US biofertilizer market is anticipated to increase between 2023 and 2029.
United States Biofertilizer Market Trends
Increase in organic area, particularly in row crops, due to country's laws and regulations
- In 2021, the area under organic agricultural farming in the United States was 623 thousand hectares. Organic agriculture in the United States has increased significantly in the previous 20 years, mostly due to the introduction of particular laws and regulations. The number of organic farms and ranches in California was 3,061 in 2021, the largest number of certified organic farms in the United States. There were over 1,125 certified organic farms in Pennsylvania. Nearly 15,548 thousand certified organic farms in operation used cropland in 2019, while 7,139 thousand farms operated pastureland and rangeland. The sales value of crops, including those from nurseries and greenhouses, amounted to nearly USD 5.8 billion.
- Row crops dominated organic farming in the nation. In 2021, they accounted for about 71.8% of all organic cropland. The production of cereal crops predominates the country's agricultural sector. The main cereals include maize, wheat, rice, and millet. The consumption of organic products has become popular among US consumers who increasingly choose to eat organic foods because of their various health benefits.
- There is an increasing trend in the overall organic horticultural crop cultivation area, from 112.9 thousand hectares in 2017 to 156.1 thousand hectares in 2021. Regarding domestic production in 2021, the top five fruits and vegetables were apples (31.1%), strawberries (9.5%), oranges (6.9%), romaine lettuce (6.7%), and potatoes (6.2%). In the case of trade, the most imported produce was bananas (53.1%), avocados (7.7%), mangoes (5.8%), blueberries (5.0%), and squashes (4.3%), while the most exported were apples (80.0%), pears (14.4%), cherries (4.0%), dried onions (1.5%), and potatoes (0.2%).
Growing demand for organic produce especially in the fruits and vegetables sector, rise in per capita spending on organic food
- The United States is one of the largest organic product consumers in the world. As of 2020, the total sales of organic food products in the country accounted for USD 51.6 billion, according to the Nutrition Business Journal (NBJ, 2021). The United States had the largest per capita spending on organic products in the North American region, worth USD 186.7 in 2021.
- Organic fresh fruits and vegetables have been the leading category of organic food since the establishment of the organic food retail industry. In 2020, retail sales for these organic products were valued at USD 20.0 billion, showing a growing demand for organic produce. The demand for organic fresh fruits and vegetables has steadily risen over the past two decades. Organic food sales are rising due to growing consumer awareness, especially among high-income consumers. The most in-demand organic categories include basic foods like eggs, dairy, fruits, and vegetables.
- Organic food preferences vary by demographic and region. Younger people aged between 18 and 29 are more likely to seek organic products (over 50%) compared to older people aged 65 and above. Income and region also play a role, with 42% of those with under USD 30,000 income and 49% of those with over USD 75.0 thousand seeking organic products.
- The per capita spending on organic products is increasing in the country, recording a CAGR of 5.2% between 2017 and 2021. The growing demand for organic products is creating opportunities for US organic producers to tap into high-value markets both domestically and abroad. The price premium associated with organic products is one of the major limiting factors for organic food consumption for low-income consumers.
United States Biofertilizer Industry Overview
The United States Biofertilizer Market is fragmented, with the top five companies occupying 22.98%. The major players in this market are Kula Bio Inc., Novozymes, Rizobacter, Sustane Natural Fertilizer Inc. and Symborg Inc. (sorted alphabetically).
Additional Benefits:
- The market estimate (ME) sheet in Excel format
- 3 months of analyst support
TABLE OF CONTENTS
1 EXECUTIVE SUMMARY & KEY FINDINGS
2 REPORT OFFERS
3 INTRODUCTION
- 3.1 Study Assumptions & Market Definition
- 3.2 Scope of the Study
- 3.3 Research Methodology
4 KEY INDUSTRY TRENDS
- 4.1 Area Under Organic Cultivation
- 4.2 Per Capita Spending On Organic Products
- 4.3 Regulatory Framework
- 4.3.1 United States
- 4.4 Value Chain & Distribution Channel Analysis
5 MARKET SEGMENTATION (includes market size in Value in USD and Volume, Forecasts up to 2030 and analysis of growth prospects)
- 5.1 Form
- 5.1.1 Azospirillum
- 5.1.2 Azotobacter
- 5.1.3 Mycorrhiza
- 5.1.4 Phosphate Solubilizing Bacteria
- 5.1.5 Rhizobium
- 5.1.6 Other Biofertilizer
- 5.2 Crop Type
- 5.2.1 Cash Crops
- 5.2.2 Horticultural Crops
- 5.2.3 Row Crops
6 COMPETITIVE LANDSCAPE
- 6.1 Key Strategic Moves
- 6.2 Market Share Analysis
- 6.3 Company Landscape
- 6.4 Company Profiles (includes Global Level Overview, Market Level Overview, Core Business Segments, Financials, Headcount, Key Information, Market Rank, Market Share, Products and Services, and Analysis of Recent Developments).
- 6.4.1 AgroLiquid
- 6.4.2 Indogulf BioAg LLC (Biotech Division of Indogulf Company)
- 6.4.3 Koppert Biological Systems Inc.
- 6.4.4 Kula Bio Inc.
- 6.4.5 Lallemand Inc.
- 6.4.6 Novozymes
- 6.4.7 Rizobacter
- 6.4.8 Sustane Natural Fertilizer Inc.
- 6.4.9 Symborg Inc.
- 6.4.10 The Andersons Inc.
7 KEY STRATEGIC QUESTIONS FOR AGRICULTURAL BIOLOGICALS CEOS
8 APPENDIX
- 8.1 Global Overview
- 8.1.1 Overview
- 8.1.2 Porter's Five Forces Framework
- 8.1.3 Global Value Chain Analysis
- 8.1.4 Market Dynamics (DROs)
- 8.2 Sources & References
- 8.3 List of Tables & Figures
- 8.4 Primary Insights
- 8.5 Data Pack
- 8.6 Glossary of Terms
02-2729-4219
+886-2-2729-4219
 2025年全球生物肥料市场报告
 固氮菌生物肥料市场机会、成长动力、产业趋势分析及2025-2034年预测全球固氮菌生物肥料市场2025年全球根瘤菌肥料市场报告
 日本生物肥料市场报告(按类型、作物、微生物、应用方式和地区)2025-2033
 全球生物肥料市场需求及预测分析(2018-2034)
 生物肥料市场规模、份额及成长分析(按类型、作物类型、应用类型、形态、微生物及地区)-产业预测,2025-2032
 中国生物肥料市场占有率分析、产业趋势与统计、成长预测(2025-2030 年)亚太生物肥料市场占有率分析、产业趋势与成长预测(2025-2030)北美生物肥料市场占有率分析、产业趋势和成长预测(2025-2030)
▼