


 |
市场调查报告书
商品编码
1693411
亚太聚氨酯接着剂:市场占有率分析、产业趋势与统计、成长预测(2025-2030 年)Asia-Pacific Polyurethane Adhesives - Market Share Analysis, Industry Trends & Statistics, Growth Forecasts (2025 - 2030) |
||||||
价格
※ 本网页内容可能与最新版本有所差异。详细情况请与我们联繫。
简介目录
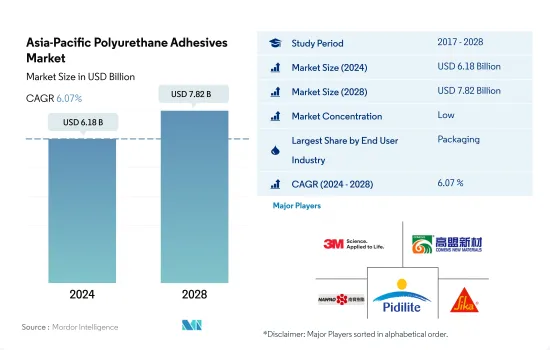
预计 2024 年亚太地区聚氨酯接着剂市场规模将达到 61.8 亿美元,预计到 2028 年将达到 78.2 亿美元,预测期内(2024-2028 年)的复合年增长率为 6.07%。
中国新兴的汽车市场和包装终端使用产业预计将推动亚太地区聚氨酯接着剂的消费
- 聚氨酯接着剂广泛应用于包装产业。聚氨酯接着剂用于食品和饮料包装、容器包装、功能性阻隔应用的生产线末端包装以及金属包装。聚氨酯接着剂在包装应用的使用量正在增加,2018年和2019年的成长率分别为4.76%和2.2%。
- 建筑业占据亚太聚氨酯接着剂市场的大部分份额,因为聚氨酯接着剂具有良好的内聚力、附着力、弹性、高内聚强度、柔韧性以及基材的高弹性模量。中国是亚太地区成长最快的国家,预计2022年至2028年期间聚氨酯建筑胶黏剂消费量的复合年增长率将达到5%。由于建筑产量增加,中国对聚氨酯建筑胶合剂的需求创下最高纪录,2021年达到4.6兆美元,与前一年同期比较增10%。
- 聚氨酯接着剂广泛应用于汽车领域。预计未来电动四轮车在亚洲市场的普及将继续发挥重要作用。从绝对值来看,中国预计将成为最大的电动车市场。按照目前的发展轨迹,到2030年,中国的渗透率将接近60%,占全球新电动车销量的40%以上,这将在预测期内推动对聚氨酯汽车胶合剂的需求。聚氨酯接着剂用于医疗保健产业,例如组装医疗设备零件等应用。预计亚太地区医疗保健投资的增加将在预测期内增加对聚氨酯接着剂的需求。
建筑、包装和汽车行业的蓬勃发展可能会在未来推动聚氨酯接着剂的需求
- 2017年至2021年,亚太地区对聚氨酯接着剂的需求在所有地区中最高。由于所有终端用户行业的生产能力都很高,该地区的黏合剂需求一直占全球需求的 46-47%。热熔型、水基型和溶剂型聚氨酯接着剂是该地区需求量最大的黏合剂。
- 2017年至2019年期间,该地区对黏合剂的需求复合年增长率为0.79%。聚氨酯接着剂需求放缓是由于该地区建设活动和汽车产量下降。 2018 年和 2019 年期间,这些终端用户产业的需求分别以 -2.4% 和 -2.25% 的复合年增长率下降。
- 2020年,营运、劳动力、原材料、供应链和其他领域的限制导致全部区域所有终端用户产业的需求减少。在该地区所有国家的所有行业中,澳洲的製鞋业受到的打击最为严重,产量较去年与前一年同期比较了49.53%。疫情期间,经济下滑导致购买力下降,国内需求下降,严重影响了该产业。
- 2021年,随着限制措施的放宽,聚氨酯接着剂的需求迅速恢復到疫情前的水准。印度的需求量增幅最高,与前一年同期比较去年同期成长73.82%。预计预测期内亚太地区的需求复合年增长率将达到 4.46%。预计预测期内,该地区的建筑、包装和汽车行业将推动需求成长。
亚太地区聚氨酯接着剂市场趋势
开发中国家电子商务产业快速成长带动产业扩张
- 包装主要用于保护、容纳、资讯、实用和促销。这使得包装成为大多数行业的重要组成部分。 2017年,包括纸、纸板和塑胶包装在内的包装使用量达25亿吨。 2020年,受新冠疫情影响,供应链中断、包装材料短缺、货物进出口限制、工厂开工率低等因素影响,市场出现7.4%的负成长率。
- 中国和印尼分别是第一和第二大海洋塑胶废弃物排放,亚洲各国政府正采取措施减少塑胶的使用。中国公布了有关过度包装的新规定,要求所有食品和化妆品製造商遵守具体的指导方针,根据产品比例确定允许的包装量。印尼政府的生产者延伸责任(EPR)法规要求生产者和零售商重新设计产品包装,以增加可回收材料的比例。
- 2021年,市场实现了8%的正成长,各类包装材料的使用量达到27亿吨。由于中等收入阶层的不断壮大、供应链的改善以及电子商务活动的活性化,包装行业预计将继续增长,这些因素需要专门的包装来运输货物,这在过去几年中为包装行业提供了巨大的推动力。预计不断增长的亚洲市场将推动包装的使用,预测期内(2022-2028 年)的复合年增长率将达到 5.7%。
扩大基础设施活动的投资将扩大产业规模
- 亚太地区受中国、日本和印度等世界主要经济体推动。中国正处于持续都市化进程中,2030年都市化率目标达到70%。都市化加快将增加都市区生活空间需求,鼓励都市区中等收入者追求更好的居住条件,这将对住宅市场产生影响,从而增加全国的住宅建设。
- 非住宅基础设施可能会大幅扩张。 2019年,中国政府核准了26个基础建设计划,总价值约1420亿美元,预计2023年完工。中国拥有全球最大的建筑市场,占全球建筑投资的20%。到2030年,政府计划在建设方面投资超过13兆美元。因此,预计预测期内(2022-2028 年)建筑市场的复合年增长率为 4.48%。
- 建筑业是亚太地区最大的产业之一,2019 年取得了可喜的成长。由于该地区包含越南、马来西亚、印尼、泰国和其他南亚国家等许多新兴国家,该产业持续成长。然而,受新冠疫情影响,全部区域政府实施封锁,建筑业大幅下滑,严重影响了包括印度、中国、日本和东南亚国协在内的开发中国家。
- 亚太地区的建筑业也越来越受到外国投资者的兴趣。由于发展中国家为投资者提供更好的利益和机会,建筑开发领域的外国直接投资(FDI)正在增加。
亚太地区聚氨酯接着剂产业概况
亚太地区聚氨酯接着剂市场较为分散,前五大公司占11.98%的市占率。该市场的主要企业有:3M、北京科门斯新材料、南保树脂化工集团、Pidilite Industries Ltd.和Sika AG(按字母顺序排列)。
其他福利
- Excel 格式的市场预测 (ME) 表
- 3个月的分析师支持
目录
第一章执行摘要和主要发现
第二章 报告要约
第三章 引言
- 研究假设和市场定义
- 研究范围
- 调查方法
第四章 产业主要趋势
- 最终用户趋势
- 航太
- 车
- 建筑与施工
- 鞋类和皮革
- 包装
- 木製品和配件
- 法律规范
- 澳洲
- 中国
- 印度
- 印尼
- 日本
- 马来西亚
- 新加坡
- 韩国
- 泰国
- 价值炼和通路分析
第五章市场区隔
- 最终用户产业
- 航太
- 车
- 建筑与施工
- 鞋类和皮革
- 卫生保健
- 包装
- 木製品和配件
- 其他最终用户产业
- 科技
- 热熔胶
- 反应性
- 溶剂型
- 紫外线固化胶合剂
- 水
- 国家
- 澳洲
- 中国
- 印度
- 印尼
- 日本
- 马来西亚
- 新加坡
- 韩国
- 泰国
- 其他亚太地区
第六章 竞争格局
- 关键策略趋势
- 市场占有率分析
- 商业状况
- 公司简介.
- 3M
- Beijing Comens New Materials Co., Ltd.
- HB Fuller Company
- Henkel AG & Co. KGaA
- Hubei Huitian New Materials Co. Ltd
- Huntsman International LLC
- Kangda New Materials(Group)Co., Ltd.
- NANPAO RESINS CHEMICAL GROUP
- Pidilite Industries Ltd.
- Sika AG
第七章:CEO面临的关键策略问题
第 8 章 附录
- 全球黏合剂和密封剂产业概况
- 概述
- 五力分析框架(产业吸引力分析)
- 全球价值链分析
- 驱动因素、阻碍因素和机会
- 资讯来源及延伸阅读
- 图片列表
- 关键见解
- 资料包
- 词彙表
简介目录
Product Code: 92470
The Asia-Pacific Polyurethane Adhesives Market size is estimated at 6.18 billion USD in 2024, and is expected to reach 7.82 billion USD by 2028, growing at a CAGR of 6.07% during the forecast period (2024-2028).
Emerging automotive market in China and packaging end-use sector expected to boost the consumption of polyurethane adhesives in Asia-Pacific
- Polyurethane adhesives are widely used in the packaging industry. Polyurethane adhesives are used in food and beverage packaging, container packaging, end-of-line packaging for functional barrier applications, and metal packaging. The usage of polyurethane adhesive has been rising in packaging applications and registered growth rates of 4.76% and 2.2% in 2018 and 2019, respectively.
- The building and construction industry occupies a major share of the Asia-Pacific polyurethane adhesives market as polyurethane adhesives offer good cohesion, adhesion, and elasticity, high cohesive strength, flexibility, and a high elastic modulus of the substrate. China is the fastest-growing country in the Asia-Pacific region and is expected to register a CAGR of 5% during the period 2022 to 2028 in terms of consumption of polyurethane construction adhesives. The country recorded the highest demand for polyurethane construction adhesives owing to rising construction output, which amounted to USD 4.6 trillion in 2021, with a 10% growth over the previous year.
- Polyurethane adhesives are widely used in automotive applications. The adoption of electric four-wheelers in Asian markets will continue to be significant. In absolute terms, China is expected to become the largest EV market. On its current trajectory, China's adoption rate will approach 60%, and the country will account for more than 40% of global new EV sales by 2030, thus, boosting the demand for polyurethane automotive adhesives in the forecast period. Polyurethane adhesives are used in the healthcare industry for applications such as assembling medical device parts. The increase in healthcare investments across the Asia-Pacific region is expected to increase the demand for polyurethane adhesives in the forecast period.
Rising construction, packaging, and automotive industries likely to propel the demand for polyurethane adhesives in the future
- From 2017 to 2021, the demand for polyurethane adhesives was the highest in Asia-Pacific among all regions. The share of adhesive demand from this region has consistently occupied 46-47% of the global demand because of the region's high manufacturing capacity of all end-user industries. Polyurethane adhesives with hot melt, water-borne, and solvent-borne technologies account for the highest demand in the region.
- From 2017 to 2019, the demand for adhesives from this region recorded a CAGR of 0.79%. The slow growth in the demand for polyurethane adhesives was due to a decrease in construction activities and automotive production in the region. The demand from these end-user industries declined with a CAGR of -2.4% and -2.25% in 2018 and 2019, respectively, during this period.
- In 2020, the demand from all end-user industries across the region declined due to constraints in operations, labor, raw material, supply chain, and other areas. Among all industries across all the countries in the region, the footwear industry in Australia took the worst hit, declining by 49.53% Y-o-Y in volume terms. The decrease in domestic demand because of low purchasing power resulting from a weak economy severely affected this industry during the pandemic.
- In 2021, the demand for polyurethane adhesives quickly rebounded to the pre-pandemic demand volumes as restrictions eased. The demand from India witnessed the highest Y-o-Y growth of 73.82% in volume terms. The overall demand from the Asia-Pacific region is expected to record a CAGR of 4.46% during the forecast period. This demand growth is expected to be driven by the region's construction, packaging, and automotive industries during the forecast period.
Asia-Pacific Polyurethane Adhesives Market Trends
Fast paced growth of e-commerce industry in developing nations to augment the industry
- Packaging is mainly used for protection, containment, information, utility, and promotion. This makes packaging an integral part of most industries. In 2017, packaging usage accounted for 2.5 billion ton of packaging, including paper and paperboard and plastic packaging. In 2020, due to the COVID-19 pandemic, the market registered a negative growth rate of 7.4% due to disruptions in the supply chain, shortage of packaging material, restrictions on the import and export of goods, and factories operating at low capacity.
- Governments of different Asian countries have taken steps to reduce the use of plastic, as China and Indonesia are the first and second-largest contributors to plastic waste in the ocean. China has announced new restrictions on excessive packaging, requiring all food and cosmetics producers to adhere to specific guidelines determining the volume of packaging allowed in proportion to a product. The extended producer responsibility (EPR) regulation imposed by the Indonesian government will oblige producers and retailers to redesign their product packaging to include a higher proportion of recyclable material.
- In 2021, the market registered a positive growth of 8%, with 2.7 billion ton of packaging material used for various purposes. The packaging industry is expected to keep growing due to the rising middle-income population, improvement of supply chains, and rising e-commerce activities, which have significantly boosted the packaging industry in the past few years as special packaging is required for shipping goods. The growing Asian market is expected to boost packaging usage, enabling it to register a CAGR of 5.7% during the forecast period (2022-2028).
Raising investment to expand infrastructural activities will augment the industry size
- Asia-Pacific is driven by the world's major economies, such as China, Japan, and India. China is promoting and undergoing a process of continuous urbanization, with a target rate of 70% for 2030. The increased living spaces required in the urban areas resulting from increasing urbanization and the desire of middle-income urban residents to improve their living conditions may impact the housing market and, thereby, increase the residential constructions in the country.
- Non-residential infrastructure is likely to expand significantly. The Chinese government approved 26 infrastructure projects worth approximately USD 142 billion in 2019, with completion due in 2023. The country has the largest construction market globally, accounting for 20% of all worldwide construction investments. By 2030, the government plans to spend over USD 13 trillion on construction. Thus, the construction market is expected to register a 4.48% CAGR during the forecast period (2022-2028).
- The construction industry is one of the largest industries in Asia-Pacific and recorded promising growth in 2019. The industry continues to grow as the region constitutes many developing countries such as Vietnam, Malaysia, Indonesia, Thailand, and other South Asian countries. However, due to the COVID-19 pandemic, the construction sector witnessed a significant decline owing to lockdowns by governments across the region, which severely affected developing countries, including India, China, Japan, and ASEAN countries.
- The Asia-Pacific region is also witnessing significant interest from international investors in the construction space. Foreign Direct Investment (FDI) in the construction development sector is increasing as developing countries provide better returns and opportunities for investors.
Asia-Pacific Polyurethane Adhesives Industry Overview
The Asia-Pacific Polyurethane Adhesives Market is fragmented, with the top five companies occupying 11.98%. The major players in this market are 3M, Beijing Comens New Materials Co., Ltd., NANPAO RESINS CHEMICAL GROUP, Pidilite Industries Ltd. and Sika AG (sorted alphabetically).
Additional Benefits:
- The market estimate (ME) sheet in Excel format
- 3 months of analyst support
TABLE OF CONTENTS
1 EXECUTIVE SUMMARY & KEY FINDINGS
2 REPORT OFFERS
3 INTRODUCTION
- 3.1 Study Assumptions & Market Definition
- 3.2 Scope of the Study
- 3.3 Research Methodology
4 KEY INDUSTRY TRENDS
- 4.1 End User Trends
- 4.1.1 Aerospace
- 4.1.2 Automotive
- 4.1.3 Building and Construction
- 4.1.4 Footwear and Leather
- 4.1.5 Packaging
- 4.1.6 Woodworking and Joinery
- 4.2 Regulatory Framework
- 4.2.1 Australia
- 4.2.2 China
- 4.2.3 India
- 4.2.4 Indonesia
- 4.2.5 Japan
- 4.2.6 Malaysia
- 4.2.7 Singapore
- 4.2.8 South Korea
- 4.2.9 Thailand
- 4.3 Value Chain & Distribution Channel Analysis
5 MARKET SEGMENTATION (includes market size in Value in USD and Volume, Forecasts up to 2028 and analysis of growth prospects)
- 5.1 End User Industry
- 5.1.1 Aerospace
- 5.1.2 Automotive
- 5.1.3 Building and Construction
- 5.1.4 Footwear and Leather
- 5.1.5 Healthcare
- 5.1.6 Packaging
- 5.1.7 Woodworking and Joinery
- 5.1.8 Other End-user Industries
- 5.2 Technology
- 5.2.1 Hot Melt
- 5.2.2 Reactive
- 5.2.3 Solvent-borne
- 5.2.4 UV Cured Adhesives
- 5.2.5 Water-borne
- 5.3 Country
- 5.3.1 Australia
- 5.3.2 China
- 5.3.3 India
- 5.3.4 Indonesia
- 5.3.5 Japan
- 5.3.6 Malaysia
- 5.3.7 Singapore
- 5.3.8 South Korea
- 5.3.9 Thailand
- 5.3.10 Rest of Asia-Pacific
6 COMPETITIVE LANDSCAPE
- 6.1 Key Strategic Moves
- 6.2 Market Share Analysis
- 6.3 Company Landscape
- 6.4 Company Profiles (includes Global Level Overview, Market Level Overview, Core Business Segments, Financials, Headcount, Key Information, Market Rank, Market Share, Products and Services, and Analysis of Recent Developments).
- 6.4.1 3M
- 6.4.2 Beijing Comens New Materials Co., Ltd.
- 6.4.3 H.B. Fuller Company
- 6.4.4 Henkel AG & Co. KGaA
- 6.4.5 Hubei Huitian New Materials Co. Ltd
- 6.4.6 Huntsman International LLC
- 6.4.7 Kangda New Materials (Group) Co., Ltd.
- 6.4.8 NANPAO RESINS CHEMICAL GROUP
- 6.4.9 Pidilite Industries Ltd.
- 6.4.10 Sika AG
7 KEY STRATEGIC QUESTIONS FOR ADHESIVES AND SEALANTS CEOS
8 APPENDIX
- 8.1 Global Adhesives and Sealants Industry Overview
- 8.1.1 Overview
- 8.1.2 Porter's Five Forces Framework (Industry Attractiveness Analysis)
- 8.1.3 Global Value Chain Analysis
- 8.1.4 Drivers, Restraints, and Opportunities
- 8.2 Sources & References
- 8.3 List of Tables & Figures
- 8.4 Primary Insights
- 8.5 Data Pack
- 8.6 Glossary of Terms
02-2729-4219
+886-2-2729-4219
 聚氨酯黏合剂市场:按类型、固化机制、终端用户产业、应用和分销管道划分-2026-2032年全球市场预测
 全球聚氨酯接着剂市场规模、份额、趋势和成长分析报告(2026-2034年)
 2026年全球聚氨酯接着剂市场报告
 电子产业用聚氨酯(PU)黏合剂:市场占有率分析、产业趋势与统计、成长预测(2026-2031)
 全球聚氨酯接着剂市场(按类型、技术、应用和地区划分)- 预测至 2030 年
 聚氨酯接着剂的全球市场:类别,各技术,各终端用户业界,各地区,机会,预测,2018年~2032年欧洲聚氨酯接着剂:市场占有率分析、产业趋势与统计、成长预测(2025-2030)聚氨酯接着剂:市场占有率分析、产业趋势与统计、成长预测(2025-2030)中东和非洲聚氨酯(PU)黏合剂市场占有率分析、产业趋势和成长预测(2025-2030)聚氨酯接着剂和密封剂:市场占有率分析、行业趋势和成长预测(2025-2030 年)
▼