


 |
市场调查报告书
商品编码
1693556
印度肥料:市场占有率分析、产业趋势与统计、成长预测(2025-2030)India Fertilizers - Market Share Analysis, Industry Trends & Statistics, Growth Forecasts (2025 - 2030) |
||||||
※ 本网页内容可能与最新版本有所差异。详细情况请与我们联繫。
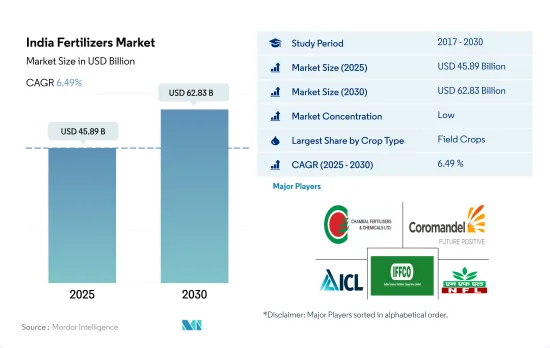
印度肥料市场规模预计在 2025 年为 458.9 亿美元,预计到 2030 年将达到 628.3 亿美元,预测期内(2025-2030 年)的复合年增长率为 6.49%。
米是主要的 NPK 消耗作物,预计将推动该国的化肥需求。
- 预计农田作物肥料将在 2022 年占据 89.2% 的市场份额,2023 年至 2030 年的复合年增长率为 9.8%。主要田间作物水稻的种植面积大幅增加,2022 年种植面积为 4,700 万公顷,比 2017 年增加 93.1%。鑑于水稻对 NPK 肥料的高度依赖,预计它将成为该国化肥需求的主要驱动力。
- 田间作物作物种植面积将从2017年的1.87亿公顷增加到2022年的1.94亿公顷。在田间作物中,谷物占很大比例。为了满足不断增长的人口的粮食需求,田间作物种植面积激增,预计这将在未来几年推动印度化肥市场的发展。
- 2022年,园艺作物肥料占印度肥料市场的10.5%,价值50.2亿美元。园艺作物面积将缓慢增加,从 2017 年的 860 万公顷增加到 2022 年的 890 万公顷。园艺作物种植面积的增加伴随着肥料消费量的增加,旨在最大限度地提高产量。
- 印度的草皮和观赏作物肥料产业虽然只占很小一部分,但 2021 年的价值为 7,480 万美元。政府强调自给自足,并采取了促进温室观赏花卉生产等倡议,显示该产业具有潜在的成长潜力。
- 随着主要田间作物需求的不断增长以及水果和草皮种植面积的不断扩大,这一领域将实现显着增长。预计 2023 年至 2030 年田间作物的复合年增长率为 6.4%,水果和草皮的复合年增长率为 4.0%。
印度肥料市场趋势
国内外消费需求的不断成长是印度种植面积成长的主要驱动力
- 在研究期间,印度田间作物作物种植面积增加了6%。受国内外消费需求推动,谷物、豆类和油籽种植面积激增,对种植面积扩大发挥了关键作用。
- 从作物种类来看,2022年,水稻将占印度农业的25.4%,小麦将占17.4%,大豆将占7.5%。水稻是印度的主粮,在全国占据主导地位,占印度耕地总面积的四分之一,养活了近一半的人口。它在全国各地都有种植,主要分布在西孟加拉邦、北方邦、安得拉邦、旁遮普邦和泰米尔纳德邦。然而,2022 年雨季印度米的生产量下降了 6%(1.0499 亿吨)。这主要是由于贾坎德邦、中央邦和西孟加拉邦等地降雨不足,导致水稻种植面积减少。
- 旁遮普邦、西孟加拉邦、哈里亚纳邦和拉贾斯坦邦将成为印度主要的小麦种植邦。 2017年至2022年间,印度的小麦种植面积增加了5%。不过,小麦产量将从去年的1.0959亿吨下降到2022年的1.0774亿吨。产量下降的原因是暴雨和冰雹袭击了印度北部、中部和西部的肥沃平原。这些自然灾害对小麦等已成熟的冬季作物造成严重破坏,对农民造成重大损失。
- 由于印度粮食种植业蓬勃发展以及国内外需求激增,预计印度化肥市场将在 2023 年至 2030 年间实现成长。
在大量营养素中,氮是田间作物最常使用的营养素,平均施用率为 223.5 公斤/公顷。
- 2021年主要养分平均施用率为125.1公斤/公顷。特别值得注意的是氮,最高平均施用量为223.5公斤/公顷。鑑于水稻等作物的密集种植,氮这种关键营养素发挥着至关重要的作用也就不足为奇了。然而,土壤缺乏这种养分,阻碍了全国水稻的生产。
- 正如《生物肥料和有机肥料的现状》报告所强调的那样,印度土壤的健康状况令人担忧。报告显示,化学肥料消费量呈上升趋势,受检土壤中氮、磷、钾营养缺乏的比例分别为97.0%、83.0%及71.0%。
- 主要作物中,2021年小麦、水稻、玉米养分施用量最高,分别为平均每公顷231公斤、156公斤、149公斤。小麦和稻米是我国乃至全球的主粮,但由于多种营养缺陷,产量和利润大幅下降。除了氮、磷和钾之外,这些作物还依赖硫、硼、铁和锌等微量营养素来实现最佳生长。由于营养管理在作物成功生产中发挥关键作用,因此市场正在不断增长。
- 田间作物,尤其是谷物和谷类,对主要营养素有着极大的需求,尤其是氮肥。大规模种植这些作物正在消耗土壤养分,预计将在2023年至2030年期间推动肥料需求的快速成长,从而推动市场成长。
印度化肥产业概况
印度化肥市场较为分散,前五大公司占27.78%的市占率。市场的主要企业有:Chambal Fertilizers & Chemicals Ltd、Coromandel International Ltd.、ICL Group Ltd、Indian Farmers Fertiliser Cooperative Limited 和 National Fertilizers Ltd(按字母顺序排列)
其他福利
- Excel 格式的市场预测 (ME) 表
- 3个月的分析师支持
目录
第一章执行摘要和主要发现
第二章 报告要约
第三章 引言
- 研究假设和市场定义
- 研究范围
- 调查方法
第四章 产业主要趋势
- 主要作物种植面积
- 田间作物
- 园艺作物
- 平均养分施用量
- 微量营养素
- 田间作物
- 园艺作物
- 主要营养素
- 田间作物
- 园艺作物
- 次要宏量营养素
- 田间作物
- 园艺作物
- 微量营养素
- 灌溉农田
- 法律规范
- 价值炼和通路分析
第五章市场区隔
- 类型
- 复合型
- 直的
- 微量营养素
- 硼
- 铜
- 铁
- 锰
- 钼
- 锌
- 其他的
- 氮
- 尿素
- 其他的
- 磷酸
- DAP
- MAP
- SSP
- 其他的
- 钾
- MoP
- 次要营养物质
- 钙
- 镁
- 硫
- 形式
- 传统的
- 特别的
- CRF
- 液体肥料
- SRF
- 水溶性
- 施肥方式
- 受精
- 叶面喷布
- 土壤
- 作物类型
- 田间作物
- 园艺作物
- 草坪和观赏植物
第六章竞争格局
- 关键策略趋势
- 市场占有率分析
- 商业状况
- 公司简介
- Chambal Fertilizers & Chemicals Ltd
- Coromandel International Ltd.
- Gujarat Narmada Valley Fertilizers & Chemicals Ltd
- Haifa Group
- ICL Group Ltd
- Indian Farmers Fertiliser Cooperative Limited
- National Fertilizers Ltd
- Rashtriya Chemicals & Fertilizers Ltd
- Sociedad Quimica y Minera de Chile SA
- Yara International ASA
第七章:CEO面临的关键策略问题
第 8 章 附录
- 世界概况
- 概述
- 五力分析框架
- 全球价值链分析
- 市场动态(DRO)
- 资讯来源及延伸阅读
- 图片列表
- 关键见解
- 资料包
- 词彙表
The India Fertilizers Market size is estimated at 45.89 billion USD in 2025, and is expected to reach 62.83 billion USD by 2030, growing at a CAGR of 6.49% during the forecast period (2025-2030).
Rice is a major NPK-consuming crop that is expected to drive the nation's fertilizer demand
- In 2022, field crop fertilizers dominated the market, accounting for 89.2%, and are projected to record a CAGR of 9.8% during 2023-2030. Rice, the leading field crop, witnessed a substantial surge in cultivation, with 47 million hectares planted in 2022, marking a 93.1% increase from 2017. Given rice's significant reliance on NPK fertilizers, it is poised to be a key driver of fertilizer demand in the country.
- The area dedicated to field crops expanded from 187 million hectares in 2017 to 194 million hectares by 2022. Cereals, within the field crop category, commanded a substantial share. This surge in field crop cultivation, driven by the need to feed a growing population, is expected to propel India's fertilizer market in the coming years.
- In 2022, horticultural crop fertilizers represented 10.5% of the Indian fertilizer market, valued at USD 5.02 billion. The area under horticulture cultivation witnessed a modest rise, reaching 8.9 million hectares in 2022 from 8.6 million hectares in 2017. This uptick in horticulture acreage is accompanied by a parallel rise in fertilizer consumption aimed at maximizing yields.
- The turf and ornamental crop fertilizer segment in India, though a small fraction, was valued at USD 74.8 million in 2021. The government's emphasis on self-sufficiency has led to initiatives like promoting greenhouse ornamental flower production, hinting at potential growth in this segment.
- With the rising demand for major field crops and the expansion of fruit and turf cultivation areas, this segment is poised for significant growth. The projected CAGR during 2023-2030 is 6.4% for field crops and 4.0% for fruits and turf.
India Fertilizers Market Trends
The rising consumer demand domestically and internationally is the major driving factor for the rising acreage in India
- During the study period, the country witnessed a 6% increase in field crop cultivation. This surge in the cultivation of cereals, pulses, and oilseeds, driven by both domestic and international consumer demand, played a pivotal role in expanding the acreage.
- Breaking down the crops, rice, wheat, and soybean dominated the country's agricultural landscape in 2022, accounting for 25.4%, 17.4%, and 7.5%, respectively. Rice, a staple in India, commands a significant share, covering a quarter of the total cropped area and feeding nearly half the population. It finds cultivation across the nation, with key states being West Bengal, Uttar Pradesh, Andhra Pradesh, Punjab, and Tamil Nadu. However, India's rice production dipped by 6% (104.99 million tons) in the kharif season of 2022, primarily due to reduced paddy acreage in states like Jharkhand, Madhya Pradesh, and West Bengal, grappling with rainfall deficits.
- Punjab, West Bengal, Haryana, and Rajasthan emerge as the primary wheat cultivators in India. From 2017 to 2022, wheat cultivation in India witnessed a 5% increase. However, the wheat output dipped to 107.74 million tonnes in 2022 from the previous year's 109.59 million tonnes. This decline can be attributed to heavy rainfall and hailstorms that battered the fertile plains of northern, central, and western India. These natural calamities inflicted significant damage on the maturing winter-planted crops, including wheat, leading to substantial losses for farmers.
- Given the robust cereal cultivation in India, bolstered by surging domestic and international demand, the Indian fertilizer market is poised for growth during 2023-2030.
Among the primary nutrients, nitrogen is the most-applied nutrient in field crops, with an average application rate of 223.5 kg per hectare
- In 2021, the average application rate for primary nutrients stood at 125.1 kg/ha. Notably, nitrogen topped the list with an average application rate of 223.5 kg/ha. Given the intensive cultivation of crops like rice in the country, it is no surprise that nitrogen, being a crucial nutrient, plays a pivotal role. However, the deficiency of this nutrient in the soil is hampering rice productivity nationwide.
- The soil health in India, as highlighted in the State of Biofertilizers and Organic Fertilizers report, is a cause for concern. It reveals a rising trend in the consumption of chemical fertilizers, with 97.0%, 83.0%, and 71.0% of tested soils showing deficiencies in nitrogen, phosphorous, and potassium, respectively.
- Among the major crops, wheat, rice, and corn/maize led the pack in nutrient application rates in 2021, with averages of 231, 156, and 149 kg/ha, respectively. Wheat and rice, being staple foods both domestically and globally, face significant yield and profit reductions due to multiple nutrient deficiencies. Apart from nitrogen, phosphorous, and potassium, these crops also rely on micronutrients like sulfur, boron, iron, and zinc for optimal growth. Given the critical role of nutrient management in successful crop production, the market is witnessing growth.
- Field crops, especially grains and cereals, have a voracious appetite for primary nutrients, particularly nitrogen fertilizers. With the extensive cultivation of these crops depleting the soil's nutrient content, the demand for fertilizers is expected to surge during 2023-2030, driving market growth.
India Fertilizers Industry Overview
The India Fertilizers Market is fragmented, with the top five companies occupying 27.78%. The major players in this market are Chambal Fertilizers & Chemicals Ltd, Coromandel International Ltd., ICL Group Ltd, Indian Farmers Fertiliser Cooperative Limited and National Fertilizers Ltd (sorted alphabetically).
Additional Benefits:
- The market estimate (ME) sheet in Excel format
- 3 months of analyst support
TABLE OF CONTENTS
1 EXECUTIVE SUMMARY & KEY FINDINGS
2 REPORT OFFERS
3 INTRODUCTION
- 3.1 Study Assumptions & Market Definition
- 3.2 Scope of the Study
- 3.3 Research Methodology
4 KEY INDUSTRY TRENDS
- 4.1 Acreage Of Major Crop Types
- 4.1.1 Field Crops
- 4.1.2 Horticultural Crops
- 4.2 Average Nutrient Application Rates
- 4.2.1 Micronutrients
- 4.2.1.1 Field Crops
- 4.2.1.2 Horticultural Crops
- 4.2.2 Primary Nutrients
- 4.2.2.1 Field Crops
- 4.2.2.2 Horticultural Crops
- 4.2.3 Secondary Macronutrients
- 4.2.3.1 Field Crops
- 4.2.3.2 Horticultural Crops
- 4.2.1 Micronutrients
- 4.3 Agricultural Land Equipped For Irrigation
- 4.4 Regulatory Framework
- 4.5 Value Chain & Distribution Channel Analysis
5 MARKET SEGMENTATION (includes market size in Value in USD and Volume, Forecasts up to 2030 and analysis of growth prospects)
- 5.1 Type
- 5.1.1 Complex
- 5.1.2 Straight
- 5.1.2.1 Micronutrients
- 5.1.2.1.1 Boron
- 5.1.2.1.2 Copper
- 5.1.2.1.3 Iron
- 5.1.2.1.4 Manganese
- 5.1.2.1.5 Molybdenum
- 5.1.2.1.6 Zinc
- 5.1.2.1.7 Others
- 5.1.2.2 Nitrogenous
- 5.1.2.2.1 Urea
- 5.1.2.2.2 Others
- 5.1.2.3 Phosphatic
- 5.1.2.3.1 DAP
- 5.1.2.3.2 MAP
- 5.1.2.3.3 SSP
- 5.1.2.3.4 Others
- 5.1.2.4 Potassic
- 5.1.2.4.1 MoP
- 5.1.2.5 Secondary Macronutrients
- 5.1.2.5.1 Calcium
- 5.1.2.5.2 Magnesium
- 5.1.2.5.3 Sulfur
- 5.2 Form
- 5.2.1 Conventional
- 5.2.2 Speciality
- 5.2.2.1 CRF
- 5.2.2.2 Liquid Fertilizer
- 5.2.2.3 SRF
- 5.2.2.4 Water Soluble
- 5.3 Application Mode
- 5.3.1 Fertigation
- 5.3.2 Foliar
- 5.3.3 Soil
- 5.4 Crop Type
- 5.4.1 Field Crops
- 5.4.2 Horticultural Crops
- 5.4.3 Turf & Ornamental
6 COMPETITIVE LANDSCAPE
- 6.1 Key Strategic Moves
- 6.2 Market Share Analysis
- 6.3 Company Landscape
- 6.4 Company Profiles
- 6.4.1 Chambal Fertilizers & Chemicals Ltd
- 6.4.2 Coromandel International Ltd.
- 6.4.3 Gujarat Narmada Valley Fertilizers & Chemicals Ltd
- 6.4.4 Haifa Group
- 6.4.5 ICL Group Ltd
- 6.4.6 Indian Farmers Fertiliser Cooperative Limited
- 6.4.7 National Fertilizers Ltd
- 6.4.8 Rashtriya Chemicals & Fertilizers Ltd
- 6.4.9 Sociedad Quimica y Minera de Chile SA
- 6.4.10 Yara International ASA
7 KEY STRATEGIC QUESTIONS FOR FERTILIZER CEOS
8 APPENDIX
- 8.1 Global Overview
- 8.1.1 Overview
- 8.1.2 Porter's Five Forces Framework
- 8.1.3 Global Value Chain Analysis
- 8.1.4 Market Dynamics (DROs)
- 8.2 Sources & References
- 8.3 List of Tables & Figures
- 8.4 Primary Insights
- 8.5 Data Pack
- 8.6 Glossary of Terms
 2032年化肥市场预测:按肥料类型、作物类型、形态、分销管道、应用和地区分類的全球分析按类型、用途、形式和地区分類的肥料市场
 肥料市场机会、成长动力、产业趋势分析及2025-2034年预测肥料袋市场规模、份额和趋势分析报告:按材料、尺寸、封口类型、应用、地区和细分市场预测,2025-2033 年全球永续海藻肥料市场:2032 年预测 - 按产品、原料、作物类型、萃取方法、应用和地区进行分析
 2025 年至 2033 年肥料市场规模、份额、趋势及预测(依产品类型、产品、产品形态、作物类型及地区划分)全球绿肥市场海藻基肥料市场机会、成长动力、产业趋势分析及 2025 - 2034 年预测
 混合肥料的全球市场:类型·作物类型·适用法·通路·终端用户·形态·各地区 (~2032年)
 2025年全球复合肥料市场报告