


 |
市场调查报告书
商品编码
1693751
美国农业生技药品:市场占有率分析、产业趋势、统计数据、成长预测(2025-2030 年)United States Agricultural Biologicals - Market Share Analysis, Industry Trends & Statistics, Growth Forecasts (2025 - 2030) |
||||||
价格
※ 本网页内容可能与最新版本有所差异。详细情况请与我们联繫。
简介目录
美国农业生技药品市场规模预计在 2025 年为 35.5 亿美元,预计到 2030 年将达到 64.8 亿美元,预测期内(2025-2030 年)的复合年增长率为 12.81%。
- 2022年,作物保护剂引领美国农业生技药品市场,规模达13.5亿美元。生物农药是美国农业生技药品市场消费最多的产品,2022年在作物保护领域占最大份额,达83.5%。生物农药在生物农药领域占主导地位,用于控制病原真菌引起的植物疾病。生物杀菌剂要么来自微生物,要么植物来源。预计生物杀菌剂子区隔的市场规模在 2022 年将达到 6.509 亿美元,占同年 49.5% 的市场占有率,成为消费量最大的生物农药类型。
- 预计 2022 年美国生物杀虫剂子区隔市场规模为 4.039 亿美元,市占率为 30.7%。它是第二大消费量生物农药。
- 2022年,作物营养在美国农业生技药品市场中占11.5亿美元。 2022年美国农业生技药品市场中,有机肥料是作物营养领域的最大消费者。化肥是美国消费量最大的有机肥料,2022 年占最大,达 46.7%。堆肥可以是植物来源的,也可以是动物基的,由分解植物或动物废物(如粪肥)製成,通常富含有机物。动物或植物废弃物堆肥、农地肥料和绿肥是农业中常用的类型。
- 农民对过度使用化学肥料的认识不断提高,政府支持永续和有机农业实践的倡议正在推动对基于作物营养的农业生技药品的需求。因此,预计市场将从 2023 年到 2029 年成长。
美国农业生技药品市场趋势
依照国家法律法规增加有机种植面积,特别是连续作物
- 过去二十年来,美国的有机农业取得了显着发展,这主要归功于具体立法的出台。 2021年,美国有623,000公顷土地采用有机耕作。
- 加州是美国最大的农产品生产州,也是有机生产的领导者,拥有 3,000 多个有机农场。相较而言,其他几个州用于有机农业的土地面积比加州更大,而加州的有机农业土地面积仅占其农田面积的 4% 左右。相反,有机农民数量最多的州是缅因州、纽约州和佛蒙特州等东北部各州。
- 耕地作物是美国有机作物的主导。 2021年,其占有机农地总面积的约71.8%。谷类生产占主导地位。主要粮食作物有玉米、小麦、稻米、小米。有机产品的消费在美国消费者中越来越流行,越来越多的消费者因其各种健康益处而选择有机食品。
- 有机园艺作物种植总面积呈上升趋势,从 2017 年的 112,900 公顷增加到 2021 年的 156,100 公顷。就 2021 年国内产量而言,前五的水果和蔬菜分别是苹果(31.1%)、草莓(9.5%)、柳橙(6.9%)、罗马生菜(6.7%)和马铃薯(6.2%)。在贸易方面,进口量最大的产品是香蕉(53.1%)、酪梨(7.7%)、芒果(5.8%)、蓝莓(5.0%)和南瓜(4.3%),出口量最大的产品是苹果(80.0%)、梨子(14.4%)、樱桃(4.0%)、洋葱干(1.5%)。
对有机农产品的需求不断增加,尤其是在水果和蔬菜领域,人均有机食品支出也在增加
- 美国是世界最大的有机产品消费国。根据《营养商业日誌》(NBJ,2021 年)的数据,2020 年该国有机食品总销售额为 516 亿美元。 2021年,美国是北美地区人均有机产品支出最高的国家,相当于158美元。
- 自有机食品零售业诞生以来,有机新鲜水果和蔬菜一直是有机食品的主要类别。 2020年,这些有机产品的零售额价值200亿美元,显示对有机农产品的需求不断增加。过去20年来,对有机新鲜水果和蔬菜的需求稳步上升。有机食品销售的成长是由于消费者意识的增强,尤其是高所得族群。需求量最大的有机食品类别包括鸡蛋、乳製品、水果和蔬菜等主食。
- 不同人群和地区的人们对有机食品的偏好各不相同。 18-29 岁的年轻人比 65 岁以上的老年人更有可能想要有机产品(超过 50%)。收入和地区也起着一定的作用,42% 的收入低于 30,000 美元的人想要有机产品,而 49% 的收入超过 75,000 美元的人想要有机产品。
- 美国的人均有机产品支出正在增加,2017 年至 2021 年的复合年增长率为 5.2%。对有机产品的需求不断增长,为美国有机生产商创造了机会,使其能够进入国内和国际高价值市场。有机产品的价格溢价是低收入消费者消费有机食品的主要限制因素之一。
美国农业生技药品产业概况
美国农业生技药品市场细分化,前五大公司占6.56%的市占率。该市场的主要企业包括 Bioworks Inc.、Cedar Grove Composting Inc.、Certis USA LLC、Corteva Agriscience、Novozymes 等。
其他福利
- Excel 格式的市场预测 (ME) 表
- 3个月的分析师支持
目录
第一章执行摘要和主要发现
第二章 报告要约
第三章 引言
- 研究假设和市场定义
- 研究范围
- 调查方法
第四章 产业主要趋势
- 有机种植区
- 有机产品人均支出
- 法律规范
- 美国
- 价值炼和通路分析
第五章市场区隔
- 功能
- 作物营养
- 生物肥料
- 固氮螺菌
- 固氮菌
- 菌根真菌
- 解磷细菌
- 根瘤菌
- 其他生物肥料
- 生物肥料
- 胺基酸
- 富里酸
- 腐植酸
- 蛋白质水解物
- 海藻萃取物
- 其他生物刺激素
- 有机肥
- 肥料
- 餐食基肥料
- 油饼
- 其他有机肥料
- 作物保护
- 生物防治剂
- 大型微生物
- 微生物
- 生物防治剂
- 生物真菌剂
- 生物除草剂
- 生物杀虫剂
- 其他生物防治剂
- 作物营养
- 作物类型
- 经济作物
- 园艺作物
- 耕地作物
第六章 竞争格局
- 重大策略倡议
- 市场占有率分析
- 商业状况
- 公司简介
- Andermatt Group AG
- Bioline AgroSciences Ltd
- Bioworks Inc.
- Cedar Grove Composting Inc.
- Certis USA LLC
- Corteva Agriscience
- Koppert Biological Systems Inc.
- Novozymes
- Sustane Natural Fertilizer Inc.
- Symborg Inc.
第七章:CEO面临的关键策略问题
第 8 章 附录
- 世界概况
- 概述
- 五力分析框架
- 全球价值链分析
- 市场动态(DRO)
- 资讯来源及延伸阅读
- 图片列表
- 关键见解
- 数据包
- 词彙表
简介目录
Product Code: 500011
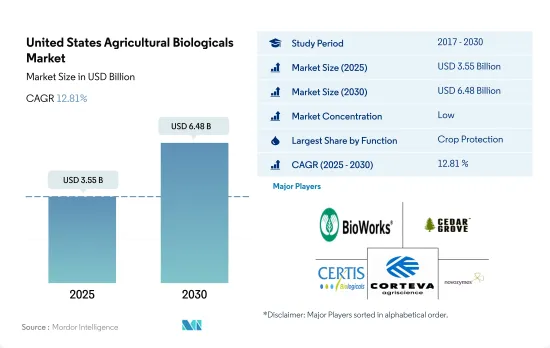
The United States Agricultural Biologicals Market size is estimated at 3.55 billion USD in 2025, and is expected to reach 6.48 billion USD by 2030, growing at a CAGR of 12.81% during the forecast period (2025-2030).
- In 2022, crop protection led the US agricultural biologicals market, accounting for USD 1.35 billion. Biopesticides are the most consumed in the US agricultural biologicals market and accounted for a maximum share of 83.5% in the crop protection segment in 2022. Biofungicides dominate the biopesticides segment and are used to control plant diseases that are caused by pathogenic fungi. Biofungicides may be of microbial or botanical origin. The biofungicides sub-segment was valued at USD 650.9 million in 2022, and they are the most consumed biopesticide type, with a market share of 49.5% in the same year.
- The bioinsecticides sub-segment in the United States was valued at USD 403.9 million in 2022, and it accounted for a share of 30.7%. They are the second-most consumed biopesticides.
- Crop nutrients accounted for USD 1.15 billion in the US agricultural biologicals market in 2022. Organic fertilizers were the most consumed in the US agricultural biologicals market in the crop nutrition segment in 2022. Manures are the most consumed organic fertilizer in the United States, accounting for a maximum share of 46.7% in 2022. Manures can be of plant or animal origin, and they are a decomposed form of plant or animal waste like excreta, generally rich in organic matter. Animal or plant waste compost manure, farmyard manure, and green manure are the common types used in agriculture.
- The increasing awareness about the overuse of fertilizers among farmers and the government initiatives to support sustainable agricultural practices and organic farming resulted in a rising demand for crop nutrition-based agricultural biologicals. Therefore, the market is anticipated to increase between 2023 and 2029.
United States Agricultural Biologicals Market Trends
Increase in organic area, particularly in row crops, due to country's laws and regulations
- Organic agriculture in the United States has increased significantly over the last 20 years, owing mostly to the introduction of particular laws and regulations. In 2021, the area under organic agricultural farming in the United States was 623 thousand hectares.
- California is the nation's top state for agricultural sales overall, and it is also the leader in organic production, with more than 3,000 organic farms. In relative terms, several other states devote a greater share of their farmland to organic farming than California, where organic farms represent only about 4% of the state's agricultural acreage. Instead, the list of top states for organic farms on a relative basis is led by northeastern states, including Maine, New York, and Vermont.
- Row crops dominate organic farming in the nation. In 2021, they accounted for about 71.8% of all organic cropland. The production of cereal crops predominates. The main cereals include maize, wheat, rice, and millet. The consumption of organic products has become popular among US consumers, who increasingly choose to eat organic foods because of their various health benefits.
- An increasing trend was observed in the overall organic horticulture crop cultivation area, from 112.9 thousand hectares in 2017 to 156.1 thousand hectares in 2021. Regarding domestic production in 2021, the top five fruits and vegetables were apples (31.1%), strawberries (9.5%), oranges (6.9%), romaine lettuce (6.7%), and potatoes (6.2%). In the case of trade, the most imported produce was bananas (53.1%), avocados (7.7%), mangoes (5.8%), blueberries (5.0%), and squash (4.3%), while the most exported were apples (80.0%), pears (14.4%), cherries (4.0%), dried onions (1.5%), and potatoes (0.2%).
Growing demand for organic produce especially in the fruits and vegetables sector, rise in per capita spending on organic food
- The United States is one of the largest organic product consumers in the world. In 2020, the country's total sales of organic food products accounted for USD 51.6 billion, according to the Nutrition Business Journal (NBJ, 2021). In 2021, the United States had the largest per capita spending on organic products in the North American region, worth USD 158.0.
- Organic fresh fruits and vegetables have been the leading organic food category since the organic food retail industry began. In 2020, retail sales for these organic products were valued at USD 20.0 billion, showing a growing demand for organic produce. The demand for organic fresh fruits and vegetables has steadily risen over the past two decades. Organic food sales are rising due to growing consumer awareness, especially among high-income consumers. The most in-demand organic categories include basic foods like eggs, dairy, fruits, and vegetables.
- Organic food preferences vary by demographic and region. Younger people of age between 18-29 are more likely to seek out organic products (over 50%) compared to older people aged 65 and above. Income and region also play a role, with 42% of those with under USD 30 thousand income and 49% of those with over USD 75.0 thousand seeking organic products.
- The per capita spending on organic products is increasing in the country, and it recorded a CAGR of 5.2% from 2017 to 2021. The growing demand for organic products creates opportunities for US organic producers to tap into high-value markets domestically and abroad. The price premium associated with organic products is one of the major limiting factors for organic food consumption for low-level income consumers.
United States Agricultural Biologicals Industry Overview
The United States Agricultural Biologicals Market is fragmented, with the top five companies occupying 6.56%. The major players in this market are Bioworks Inc., Cedar Grove Composting Inc., Certis USA LLC, Corteva Agriscience and Novozymes (sorted alphabetically).
Additional Benefits:
- The market estimate (ME) sheet in Excel format
- 3 months of analyst support
TABLE OF CONTENTS
1 EXECUTIVE SUMMARY & KEY FINDINGS
2 REPORT OFFERS
3 INTRODUCTION
- 3.1 Study Assumptions & Market Definition
- 3.2 Scope of the Study
- 3.3 Research Methodology
4 KEY INDUSTRY TRENDS
- 4.1 Area Under Organic Cultivation
- 4.2 Per Capita Spending On Organic Products
- 4.3 Regulatory Framework
- 4.3.1 United States
- 4.4 Value Chain & Distribution Channel Analysis
5 MARKET SEGMENTATION (includes market size in Value in USD and Volume, Forecasts up to 2030 and analysis of growth prospects)
- 5.1 Function
- 5.1.1 Crop Nutrition
- 5.1.1.1 Biofertilizer
- 5.1.1.1.1 Azospirillum
- 5.1.1.1.2 Azotobacter
- 5.1.1.1.3 Mycorrhiza
- 5.1.1.1.4 Phosphate Solubilizing Bacteria
- 5.1.1.1.5 Rhizobium
- 5.1.1.1.6 Other Biofertilizer
- 5.1.1.2 Biostimulants
- 5.1.1.2.1 Amino Acids
- 5.1.1.2.2 Fulvic Acid
- 5.1.1.2.3 Humic Acid
- 5.1.1.2.4 Protein Hydrolysates
- 5.1.1.2.5 Seaweed Extracts
- 5.1.1.2.6 Other Biostimulants
- 5.1.1.3 Organic Fertilizer
- 5.1.1.3.1 Manure
- 5.1.1.3.2 Meal Based Fertilizers
- 5.1.1.3.3 Oilcakes
- 5.1.1.3.4 Other Organic Fertilizer
- 5.1.2 Crop Protection
- 5.1.2.1 Biocontrol Agents
- 5.1.2.1.1 Macrobials
- 5.1.2.1.2 Microbials
- 5.1.2.2 Biopesticides
- 5.1.2.2.1 Biofungicides
- 5.1.2.2.2 Bioherbicides
- 5.1.2.2.3 Bioinsecticides
- 5.1.2.2.4 Other Biopesticides
- 5.1.1 Crop Nutrition
- 5.2 Crop Type
- 5.2.1 Cash Crops
- 5.2.2 Horticultural Crops
- 5.2.3 Row Crops
6 COMPETITIVE LANDSCAPE
- 6.1 Key Strategic Moves
- 6.2 Market Share Analysis
- 6.3 Company Landscape
- 6.4 Company Profiles (includes Global Level Overview, Market Level Overview, Core Business Segments, Financials, Headcount, Key Information, Market Rank, Market Share, Products and Services, and Analysis of Recent Developments).
- 6.4.1 Andermatt Group AG
- 6.4.2 Bioline AgroSciences Ltd
- 6.4.3 Bioworks Inc.
- 6.4.4 Cedar Grove Composting Inc.
- 6.4.5 Certis USA LLC
- 6.4.6 Corteva Agriscience
- 6.4.7 Koppert Biological Systems Inc.
- 6.4.8 Novozymes
- 6.4.9 Sustane Natural Fertilizer Inc.
- 6.4.10 Symborg Inc.
7 KEY STRATEGIC QUESTIONS FOR AGRICULTURAL BIOLOGICALS CEOS
8 APPENDIX
- 8.1 Global Overview
- 8.1.1 Overview
- 8.1.2 Porter's Five Forces Framework
- 8.1.3 Global Value Chain Analysis
- 8.1.4 Market Dynamics (DROs)
- 8.2 Sources & References
- 8.3 List of Tables & Figures
- 8.4 Primary Insights
- 8.5 Data Pack
- 8.6 Glossary of Terms
02-2729-4219
+886-2-2729-4219
 动物微生物组市场规模、份额和增长分析:按动物种类、产品类型、原材料、形态、应用、最终用户、通路和地区划分——2026-2033年行业预测
 农业生物製品:市场占有率分析、产业趋势与统计、成长预测(2026-2031)
 全球农业生技药品市场规模、份额、趋势和成长分析报告(2026-2034年)
 2026年全球农业生技药品市场报告
 生物合理作物保护市场依产品类型、作物类型、配方、作用机制、成分及应用方法划分-2026-2032年全球预测
 农业生技药品市场规模、份额和趋势分析报告:按作物类型、产品类型、应用方法、地区和细分市场预测(2026-2033 年)
 日本农业生物製品市场报告(按类型、来源、应用方式、应用领域和地区划分,2026-2034年)
 农业生技药品市场规模、份额和成长分析(按类型、来源、应用、作物类型和地区划分)-2026-2033年产业预测
 农业生技药品市场规模、份额和成长分析(按类型、来源、应用、作物类型和地区划分)-2026-2033年产业预测农业生技药品市场-2025-2030年预测
▼