


 |
市场调查报告书
商品编码
1852018
菲律宾货运与物流:市场份额分析、行业趋势、统计数据和成长预测(2025-2030 年)Philippines Freight And Logistics - Market Share Analysis, Industry Trends & Statistics, Growth Forecasts (2025 - 2030) |
||||||
※ 本网页内容可能与最新版本有所差异。详细情况请与我们联繫。
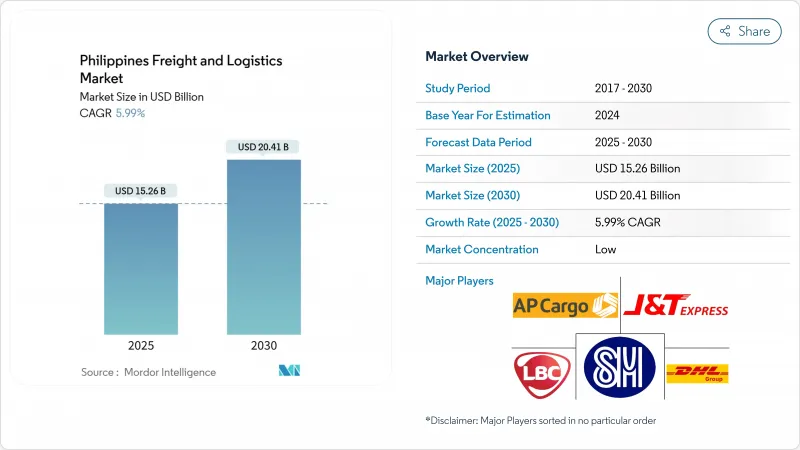
预计到 2025 年,菲律宾的货物和物流市场规模将成长至 152.6 亿美元,到 2030 年将成长至 204.1 亿美元,复合年增长率为 5.99%(2025-2030 年)。
菲律宾政府斥资8.8兆比索(约1,581.9亿美元)的「建设、完善、更多」计画、外资所有权自由化以及不断增长的电子商务需求,正在推动这一扩张。儘管公路货运仍然是该网路的主力军,但港口自动化和航空货运的升级正在重塑运输方式的选择。外国投资者正透过合资企业进入市场,这些合资企业将全球专业知识与本地资源结合,加速了仓储、货运和最后一公里配送领域的技术应用。政府主导的数位化互联互通政策,包括世界银行提供的7.5亿美元贷款,正在完善实体基础设施,并使小型企业能够采用平台经营模式。
菲律宾货运及物流市场趋势及洞察
透过「建设、完善、更多」基础建设计划提高公路和港口吞吐能力
耗资8.8兆菲律宾比索(约1581.9亿美元)的旗舰管道项目已完成11,945公里的道路计划,另有15,769公里正在建设中,这将使吕宋岛的通行时间缩短高达50%,并将八打雁、马尼拉、克拉克和苏比克湾连接成一条统一的走廊。道路、港口和铁路的协调升级可望缩短运输时间,优化供应链调度,并提高卡车周转率。投资者正在加快在新高速公路附近建造物流枢纽,以确保先发优势。合约物流供应商正在根据高速公路地图设计其网络,以减少回程空驶里程。随着多式联运节点的出现,整合公路运输和沿海航运的营运商比单一运输方式的竞争对手更具成本优势。
港口现代化和自动化公私合作项目(例如MICT)旨在缩短船舶週转时间
马尼拉国际货柜码头 (MICT) 安装了 N4 3.4 作业系统,并投入 150 亿菲律宾比索(约 2.6964 亿美元)进行堆场维修,泊位等待时间缩短了 35%,马尼拉 2023 年的吞吐能力提升至 506 万标准箱。更快的清关速度降低了卸货费用,并减少了托运人的库存缓衝。货运代理商正在将即时港口数据整合到其订舱工具中,使出口商能够选择拥塞程度最低的航线。设备自动化也使最后一公里运输车队受益,延长了闸口开放时间,支援隔夜短途运输,并缓解了白天的交通拥堵,从而帮助车队满足紧迫的交货期限。
铁路货运网不发达限制了多式联运效率
儘管交通运输预算高达披索亿菲律宾比索(约24.3亿美元),但货运铁路所占比例仍微乎其微,2024年仅有11.7亿披索(约2,103万美元)的预算用于铁路运输。重工业由于不得不将大宗货物运输转移到卡车,因此失去了规模经济效益。世界银行指出,菲律宾的物流成本比周边国家高出20%至30%。一些私营财团正在评估连接经济区和港口的专用货运铁路线路,但土地征用仍是一大障碍。一旦铁路走廊开始建设,那些尝试建造公路铁路联运货柜走廊的业者可能会获得先发优势。
细分市场分析
2024年,批发和零售贸易将占销售额的30.79%,预计2025年至2030年将以6.59%的复合年增长率成长。製造业的成长主要由半导体后端加工厂、个人护理用品製造以及依赖稳定原料供应的饮料生产线扩张所驱动。建设业吸收了基础建设的需求,从而推动了对粗骨材、钢铁和水泥的需求。随着低温运输升级延长保质期并提高农民收益,农业、渔业和林业预计将实现成长。
零售商和工厂都要求即时库存简介和协调补货,物流合作伙伴引入物联网感测器和API网关。马士基在「创造更多」税收优惠政策下对履约的投资表明,一体化的海运到仓储服务正日益受到跨国製造商的青睐。石油天然气和采矿业需要专业的巨型钻机和危险品运输合规性,而快速增长的「其他」频宽,如医疗保健、教育和逆向物流,为菲律宾货物和物流市场中擅长高价值、高服务细分领域的营运商创造了机会。
至2024年,货运代理业务将占总收入的63.34%,凸显其作为菲律宾货物和物流市场支柱的地位。卡车运输、沿海航运、空运和管道运输支撑着菲律宾7,600多个岛屿的供应链的持续运作。儘管目前由于社群电商经销商和电商巨头承诺提供全国隔日宅配,快递、速递和小包裹(CEP)产业正在萎缩,但预计2025年至2030年间,该产业仍将维持6.89%的复合年增长率。仓储和货运代理产业是连接上游生产和下游零售的关键环节。
中央包裹运输 (CEP) 领域的蓬勃发展正在重塑竞争格局。纯小包裹公司正在整合数位钱包,而传统的第三方物流 (3PL) 公司则采用众包雷射雷达模型来捍卫市场份额。仓库正在部署机器人并建造多温区,以吸引製药和农业企业进入。货运代理商正在利用港口自动化和海外合作关係,将报关服务与套件组装和逆向物流等附加价值服务捆绑在一起。总而言之,这些转变表明,菲律宾货运和物流市场生态系统正朝着端到端编配的方向发展,而非各自为政的执行模式。
其他福利:
- Excel格式的市场预测(ME)表
- 3个月的分析师支持
目录
第一章 引言
- 研究假设和市场定义
- 调查范围
第二章调查方法
第三章执行摘要
第四章 市场情势
- 市场概览
- 人口统计数据
- 按经济活动分類的GDP分配
- 按经济活动分類的GDP成长
- 通货膨胀
- 经济表现及概况
- 电子商务产业趋势
- 製造业趋势
- 运输和仓储业GDP
- 出口趋势
- 进口趋势
- 燃油价格
- 物流绩效
- 模态共享
- 票价趋势
- 货物吨位趋势
- 基础设施
- 法律规范(公路和铁路)
- 法律规范(海事和航空)
- 价值炼和通路分析
- 市场驱动因素
- 透过「大建特建2」基础建设计画提高公路和港口吞吐能力
- 扩大渔业及农产品出口的低温运输能力
- 透过港口现代化和自动化公私合作项目(例如,MICT)缩短船舶週转时间
- 放宽外资所有权限制(修订《公共服务法》)及吸引外商直接投资进入第三方物流业
- 在吕宋岛大都会区蓬勃发展的B2C电子商务领域,可提供隔日送达服务。
- 製造业的成长推动了对工业物流的需求
- 市场限制
- 铁路货运网不发达阻碍了多式联运的效率
- 马尼拉大都会区严重的道路壅塞推高了最后一公里运输成本。
- 这是一个分散的行业,以中小企业为主,数位化较低。
- 颱风和地震高风险导致供应链中断
- 市场创新
- 波特五力分析
- 买方的议价能力
- 供应商的议价能力
- 新进入者的威胁
- 替代品的威胁
- 竞争对手之间的竞争
第五章 市场规模与成长预测
- 终端用户产业
- 农业、渔业、林业
- 建造
- 製造业
- 石油天然气、采矿和采石
- 批发和零售
- 其他的
- 物流职能
- 快递、速递和小包裹(CEP)
- 目的地
- 国内的
- 国际的
- 货运代理
- 透过交通方式
- 航空
- 海运和内河航运
- 其他的
- 货物运输
- 透过交通方式
- 航空
- 管道
- 路
- 海运和内河航运
- 仓储
- 透过温度控制
- 无温度控制
- 温度控制
- 其他服务
- 快递、速递和小包裹(CEP)
第六章 竞争情势
- 市场集中度
- 关键策略倡议
- 市占率分析
- 公司简介
- AP Moller-Maersk
- AAI Worldwide Logistics
- AP Cargo
- Ayala Corporation(Including Airfreight 2100, Inc.)
- CMA CGM Group(Including CEVA Logistics)
- DHL Group
- DSV A/S(Including DB Schenker)
- Fast Logistics
- FedEx
- J&T Express(Including PH Global Jet Express, Inc.)
- JRS Business Corporation
- Kuehne+Nagel
- LBC Express Holdings, Inc.
- LF Global Logistics Solutions, Inc.
- Mitsui OSK Lines, Ltd.
- Ninja Van Group(Including Ninja Van Philippines)
- NYK(Nippon Yusen Kaisha)Line
- Orient Freight
- Royal Cargo
- SM Investments Corporation(Including 2GO Group, Inc.)
- United Parcel Service of America, Inc.(UPS)
第七章 市场机会与未来展望
The Philippines freight and logistics market size stands at USD 15.26 billion in 2025 and is projected to advance to USD 20.41 billion by 2030, reflecting a 5.99% CAGR (2025-2030).
The expansion gains momentum from the PHP 8.8 trillion (USD 158.19 billion) "Build, Better, More" program, liberalized foreign-ownership rules, and increased e-commerce demand. Road freight remains the backbone of the network, yet port automation and air-cargo upgrades are reshaping modal decisions. Foreign investors are entering through joint ventures that pair global expertise with local reach, accelerating technology adoption across warehousing, freight forwarding, and last-mile delivery. Government-led digital connectivity policies, including a USD 750 million World Bank loan, complement physical infrastructure and allow smaller operators to adopt platform business models.
Philippines Freight And Logistics Market Trends and Insights
Infrastructure "Build, Better, More" Program Boosting Road and Port Capacity
The PHP 8.8 trillion (USD 158.19 billion) flagship pipeline has completed 11,945 km of road projects and is constructing 15,769 km more, slashing Luzon travel times by up to 50% and linking Batangas, Manila, Clark, and Subic into a unified corridor. Harmonized road, port, and rail upgrades promise lower transit times, tighter supply-chain scheduling, and higher truck turns. Investors are fast-tracking distribution hubs near the new expressways to secure first-mover advantages. Contract logistics providers are aligning network designs with the expressway map to cut empty back-haul miles. As multimodal nodes emerge, operators that integrate trucking with coastal shipping gain cost leverage over single-mode rivals.
Port Modernization and Automation PPPs (e.g., MICT) Cutting Vessel Turn-Around Time
Manila International Container Terminal (MICT) applied an N4 3.4 operating system and yard upgrades worth PHP 15 billion (USD 269.64 million), slicing berth time by 35% and raising Manila's 2023 throughput to 5.06 million TEUs. Quicker clearances reduce demurrage penalties and lower inventory buffers for shippers. Forwarders embed real-time port data in booking tools, letting exporters choose sailings with minimal congestion. Equipment automation unlocks longer gate hours, which supports night-time drayage and eases daytime traffic, benefiting last-mile fleets working tight delivery windows.
Under-Developed Rail Freight Network Limiting Multimodal Efficiency
Freight rail remains negligible despite a PHP 135.4 billion (USD 2.43 billion) transport budget, of which only PHP 1.17 billion (USD 21.03 million) targets rail transport in 2024. Heavy industries lose scale benefits when bulk cargo must shift to trucks. Logistics costs run 20-30% higher than regional peers, the World Bank notes. Private consortia are evaluating dedicated cargo spurs between economic zones and ports, but land-acquisition hurdles persist. Operators experimenting with road-rail containers position themselves for first-mover gains once corridors break ground.
Other drivers and restraints analyzed in the detailed report include:
- Foreign-Ownership Liberalization Attracting FDI in 3PLs
- Surging B2C E-Commerce Requiring Same-/Next-Day Logistics Across Luzon Urban Corridors
- Severe Road Congestion in Metro Manila Inflating Last-Mile Costs
For complete list of drivers and restraints, kindly check the Table Of Contents.
Segment Analysis
Wholesale and retail trade represented 30.79% of 2024 revenue with a projected CAGR (2025-2030) of 6.59%, mirroring the nation's consumption-driven economy. Manufacturing is linked to the expansion of semiconductor back-end plants, personal-care production, and beverage lines that depend on predictable inbound raw-material streams. Construction absorbed the infrastructure push, buoyed demand for bulk aggregates, steel, and cement. Agriculture, fishing, and forestry are expected to grow with cold chain upgrades, facilitating longer shelf life and better farm-gate revenue.
Retailers and factories alike now seek real-time inventory snapshots and coordinated replenishment, prompting logistics partners to embed IoT sensors and API gateways. Maersk's fulfilment-center investments under CREATE MORE tax incentives illustrate how integrated ocean-to-warehouse services resonate with multinational manufacturers. Oil, gas, and mining require specialized heavy-haul rigs and hazardous-cargo compliance, while the fast-growing "others" band, healthcare, education, and reverse logistics, creates opportunities for operators proficient in high-value, high-service niches within the Philippines freight and logistics market.
Freight transport generated 63.34% of the 2024 total revenue, underscoring its role as the backbone of the Philippines freight and logistics market. Trucking, coastal shipping, air cargo, and pipelines underpin national supply-chain continuity across more than 7,600 islands. Courier, Express, and Parcel (CEP) segment, though a smaller slice today, is clocking a 6.89% CAGR between 2025-2030 as social-commerce sellers and marketplace giants promise next-day delivery nationwide. The warehousing and storage segment and freight forwarding form critical links that synchronize upstream production with downstream retail intake.
Momentum inside CEP is redrawing competitive boundaries: pure-play parcel firms are integrating digital wallets, while traditional 3PLs adopt crowdsourced rider models to protect share. Warehouse operators deploy robotics and construct multi-temperature zones to attract pharmaceutical and agrifood tenants. Forwarders leverage port automation and foreign-capital partnerships to bundle customs brokerage with value-added services such as kitting and reverse logistics. Collectively, these shifts confirm an ecosystem moving toward end-to-end orchestration rather than siloed execution in the Philippines freight and logistics market.
The Philippines Freight and Logistics Market Report is Segmented by End User Industry (Agriculture, Fishing, and Forestry, Construction, Manufacturing, Oil and Gas, Mining and Quarrying, Wholesale and Retail Trade, and More) and by Logistics Function (Courier, Express, and Parcel (CEP), Freight Forwarding, Freight Transport, Warehousing and Storage, and Other Services). The Market Forecasts are Provided in Terms of Value (USD).
List of Companies Covered in this Report:
- A.P. Moller - Maersk
- AAI Worldwide Logistics
- AP Cargo
- Ayala Corporation (Including Airfreight 2100, Inc.)
- CMA CGM Group (Including CEVA Logistics)
- DHL Group
- DSV A/S (Including DB Schenker)
- Fast Logistics
- FedEx
- J&T Express (Including PH Global Jet Express, Inc.)
- JRS Business Corporation
- Kuehne+Nagel
- LBC Express Holdings, Inc.
- LF Global Logistics Solutions, Inc.
- Mitsui O.S.K. Lines, Ltd.
- Ninja Van Group (Including Ninja Van Philippines)
- NYK (Nippon Yusen Kaisha) Line
- Orient Freight
- Royal Cargo
- SM Investments Corporation (Including 2GO Group, Inc.)
- United Parcel Service of America, Inc. (UPS)
Additional Benefits:
- The market estimate (ME) sheet in Excel format
- 3 months of analyst support
TABLE OF CONTENTS
1 Introduction
- 1.1 Study Assumptions and Market Definition
- 1.2 Scope of the Study
2 Research Methodology
3 Executive Summary
4 Market Landscape
- 4.1 Market Overview
- 4.2 Demographics
- 4.3 GDP Distribution by Economic Activity
- 4.4 GDP Growth by Economic Activity
- 4.5 Inflation
- 4.6 Economic Performance and Profile
- 4.6.1 Trends in E-Commerce Industry
- 4.6.2 Trends in Manufacturing Industry
- 4.7 Transport and Storage Sector GDP
- 4.8 Export Trends
- 4.9 Import Trends
- 4.10 Fuel Price
- 4.11 Logistics Performance
- 4.12 Modal Share
- 4.13 Freight Pricing Trends
- 4.14 Freight Tonnage Trends
- 4.15 Infrastructure
- 4.16 Regulatory Framework (Road and Rail)
- 4.17 Regulatory Framework (Sea and Air)
- 4.18 Value Chain and Distribution Channel Analysis
- 4.19 Market Drivers
- 4.19.1 Infrastructure "Build Build Build 2" Program Boosting Road and Port Capacity
- 4.19.2 Expansion of Cold-Chain Capacity for Fisheries and Agrifood Exports
- 4.19.3 Port Modernization and Automation PPPs (e.g., MICT) Cutting Vessel Turn-Around Time
- 4.19.4 Foreign-Ownership Liberalization (Public Service Act Amendments) Attracting FDI in 3PLs
- 4.19.5 Surging B2C E-commerce Requiring Same-/Next-Day Logistics Across Luzon Urban Corridors
- 4.19.6 Growing Manufacturing Sector Driving Industrial Logistics Demand
- 4.20 Market Restraints
- 4.20.1 Under-developed Rail Freight Network Limiting Multimodal Efficiency
- 4.20.2 Severe Road Congestion in Metro Manila Inflating Last-Mile Costs
- 4.20.3 Fragmented SME-Dominated Sector with Low Digitalization
- 4.20.4 High Typhoon and Seismic Risk Disrupting Supply Chains
- 4.21 Technology Innovations in the Market
- 4.22 Porter's Five Forces Analysis
- 4.22.1 Bargaining Power of Buyers
- 4.22.2 Bargaining Power of Suppliers
- 4.22.3 Threat of New Entrants
- 4.22.4 Threat of Substitutes
- 4.22.5 Competitive Rivalry
5 Market Size and Growth Forecasts (Value, USD)
- 5.1 End User Industry
- 5.1.1 Agriculture, Fishing, and Forestry
- 5.1.2 Construction
- 5.1.3 Manufacturing
- 5.1.4 Oil and Gas, Mining and Quarrying
- 5.1.5 Wholesale and Retail Trade
- 5.1.6 Others
- 5.2 Logistics Function
- 5.2.1 Courier, Express, and Parcel (CEP)
- 5.2.1.1 By Destination Type
- 5.2.1.1.1 Domestic
- 5.2.1.1.2 International
- 5.2.2 Freight Forwarding
- 5.2.2.1 By Mode of Transport
- 5.2.2.1.1 Air
- 5.2.2.1.2 Sea and Inland Waterways
- 5.2.2.1.3 Others
- 5.2.3 Freight Transport
- 5.2.3.1 By Mode of Transport
- 5.2.3.1.1 Air
- 5.2.3.1.2 Pipelines
- 5.2.3.1.3 Road
- 5.2.3.1.4 Sea and Inland Waterways
- 5.2.4 Warehousing and Storage
- 5.2.4.1 By Temperature Control
- 5.2.4.1.1 Non-Temperature Controlled
- 5.2.4.1.2 Temperature Controlled
- 5.2.5 Other Services
- 5.2.1 Courier, Express, and Parcel (CEP)
6 Competitive Landscape
- 6.1 Market Concentration
- 6.2 Key Strategic Moves
- 6.3 Market Share Analysis
- 6.4 Company Profiles (Includes Global Level Overview, Market Level Overview, Core Segments, Financials as Available, Strategic Information, Market Rank/Share for Key Companies, Products and Services, and Recent Developments)
- 6.4.1 A.P. Moller - Maersk
- 6.4.2 AAI Worldwide Logistics
- 6.4.3 AP Cargo
- 6.4.4 Ayala Corporation (Including Airfreight 2100, Inc.)
- 6.4.5 CMA CGM Group (Including CEVA Logistics)
- 6.4.6 DHL Group
- 6.4.7 DSV A/S (Including DB Schenker)
- 6.4.8 Fast Logistics
- 6.4.9 FedEx
- 6.4.10 J&T Express (Including PH Global Jet Express, Inc.)
- 6.4.11 JRS Business Corporation
- 6.4.12 Kuehne+Nagel
- 6.4.13 LBC Express Holdings, Inc.
- 6.4.14 LF Global Logistics Solutions, Inc.
- 6.4.15 Mitsui O.S.K. Lines, Ltd.
- 6.4.16 Ninja Van Group (Including Ninja Van Philippines)
- 6.4.17 NYK (Nippon Yusen Kaisha) Line
- 6.4.18 Orient Freight
- 6.4.19 Royal Cargo
- 6.4.20 SM Investments Corporation (Including 2GO Group, Inc.)
- 6.4.21 United Parcel Service of America, Inc. (UPS)
7 Market Opportunities and Future Outlook
- 7.1 White-Space and Unmet-Need Assessment
 货运和物流市场规模、份额和成长分析(按运输方式、服务、最终用户和地区划分)-2025-2032年产业预测
 中东欧货运与物流:市场占有率分析、产业趋势、统计数据与成长预测(2025-2030 年)新加坡货运与物流:市场份额分析、行业趋势、统计数据和成长预测(2025-2030 年)
 全球货物审核与结算市场预测(2025-2030)
 2032 年碳中和解决方案市场预测:按类型、组件、部署模式、组织规模、技术、最终用户和地区进行的全球分析
 2025年货运和物流全球市场报告
 货运审核与结算市场规模、份额及成长分析(依公司规模、最终用户、应用及地区)-2025 年至 2032 年产业预测
 2034 年货运与物流市场分析与预测:类型、产品、服务、技术、组件、应用、流程、模式、最终用户2025年全球货运车辆市场报告东协货运与物流:市场占有率分析、产业趋势与成长预测(2025-2030 年)